South African Journal of Animal Science 2004, 34 (3) © South African Society for Animal Science
166
Application of random regression models to the genetic evaluation of cow weight in Bonsmara cattle of South Africa K.A. Nephawe# ARC-Animal Improvement Institute, Private Bag X2, Irene 0062, South Africa
Abstract Repeated records (n = 58,295) of Bonsmara cows were used to evaluate mature cow weight (CW), using random regression animal models (RRM). Cows (n = 11,847), age two to 11 years (AY), were weighed at weaning of their calves. Data were analysed with the Restricted Maximum Likelihood (REML) procedure, using orthogonal (Legendre) polynomials on age in months (AM). The model included fixed regression on AM (range from 30 to 138 mo) and the effect of herd-measurement date concatenation. Random parts of the model were RRM coefficients for additive and permanent environmental effects, while residual effects were modelled to account for heterogeneity of variance by AY. Estimates of variances increased with cow age, though tended to be flat at older ages. Heritability estimates ranged from 0.39 to 0.47, and were comparable with estimate of 0.41 obtained using a simple repeatability model (SRM). Estimates of genetic correlations were greater than 0.82 among measures of weight at all ages. The resulting covariance functions were used to estimate breeding values of each animal along the age trajectory. Genetic trends for CW over the years showed only a slightly increasing pattern, suggesting that CW did not change much, and was similar whether SRM or RRM was used. Results suggest that selection for CW could be effective and that RRM could be useful for the National Genetic Evaluation of CW in Bonsmara cattle. However, given the complexity of the RRM, for practical purposes a SRM might be an acceptable approximation for prediction of breeding values. Keywords: Covariance functions, mature weight, genetic parameters, beef cattle #
E-mail:
[email protected]
Introduction Since its inception the application of genetic principles to selective breeding of farm animals has led to significant improvements and large economic benefits to the South African Beef Cattle Industry. However, as overall growth (e.g. weaning and slaughter weight) increased over the years, both breeders and scientists have debated whether mature cow sizes have been increased to extremes. Of concern is the fact that the energy required to attain and maintain mature weight (CW) is a major cost in the beef cattle production system. Selection to reduce or to restrict CW while increasing saleable weight of calves at weaning and at slaughter requires good estimates of genetic parameters and correlations amongst weights at different ages. The literature shows that growth of an animal to a mature age is a longitudinal process whereby an animal increases in size or weight continuously over time until reaching a plateau at maturity. Such a process can be represented by a set of size-age points describing a typical trajectory process and resulting in a set of many, highly correlated measures (Meyer, 1998a). Several approaches have been proposed to deal with such data, from simplest repeatability models (SRM) to complex multivariate models (MTM). The SRM considers different measurements at different stages (ages) as a realization of the same genetic trait with constant variance, while all measurements of an individual are considered to be different traits with heterogeneous variances using the MTM approach. Most recently random regression models (RRM) have been proposed to analyse longitudinal data (Kirkpatrick et al. 1990; 1994). In beef cattle the method was outlined by Varona et al. (1997) and was used by Meyer (1998a; 1999; 2000) and Arango (2002). With the RRM approach, infinite-dimensional models are used where the phenotype of an individual is represented by a continuous function of time. The main requirement for RRM is that the time-dependent response can be expressed as a linear function of a set of covariates (Schaeffer & Dekkers, 1994). The primary objectives of this study were to estimate genetic parameters, breeding values and genetic trends for CW of Bonsmara cows using RRM, and to compare the results with those obtained using a SRM. With traditional methods of genetic evaluation in beef cattle, weights are corrected towards certain landmark ages, because it is impossible to measure all animals at the same age. This paper describes an analysis to The South African Journal of Animal Science is available online at http://www.sasas.co.za/Sajas.html
South African Journal of Animal Science 2004, 34 (3) © South African Society for Animal Science
167
obtain genetic parameters using a procedure that does not require correcting phenotypic measures towards landmark ages.
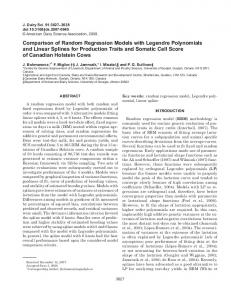
Materials and Methods Data of Bonsmara cows obtained from the South African National Beef Cattle Improvement Schemes database were used in this study. Data included records of cows measured at weaning of their calves. Preliminary analyses to test for non-genetic sources of variation on cow weight were performed using PROC MIXED in SAS (Littell et al., 1996). Basic edits excluded cows that had less than three measurements and records of cows that were regarded as outliers. The final data included 58,295 measurements from two through 11 years of age, representing 11,847 cows, progeny of 2040 sires. Figure 1 shows the unadjusted means, least square means (LSM) and generalised least square means (GLS) for cow weights (kg) by age in month (AM). Following the notation of Kirkpatrick et al. (1990; 1994), the RRM model for records over time (including additive genetic and permanent environmental random effects) could be represented as follows:
y ij = F +
n −1
n G −1
n C −1
m=0
m=0
m=0
∑ b m φ m (t ij ) + ∑ α im φ m (t ij ) + ∑ γ im φ m (t ij ) +ε ij
y = Xb + Zg + Z * c + e where yij represent the observations; F are the fixed effects in the model; φm(tij) are the covariates as a function of age with tij, the jth age of animal i standadized to range –1 to +1, and with φm, the mth orthogonal Legendre polynomial for n the order of fit (with φm evaluated for tij, there will be n coefficients for each age); bm is the mth fixed regression coefficient; αm and γm are the mth additive genetic and permanent environmental random regression coefficients for cow i; nG and nc are orders of fit for additive genetic and permanent environmental effects; and εij is the temporary environmental effect or measurement error. For the present study, the RRM model included fixed quadratic regression on AM (range from 30 to 138 mo) and the contemporary group effect of herd-measurement date concatenation. Random parts of the model were RRM coefficients for additive (g) and permanent environmental (c) effects, while temporary environmental effects (e) were modelled to account for heterogeneity of variance by age in years. Kirkpatrick et al. (1990; 1994) further indicated that RRM is an extension to regular linear mixed model, but with incidence matrices (X and Z) containing coefficients other than zeros and ones. Coefficients of 1 are replaced by functions of ages at which the records are taken (i.e., φm(tij)). The “design” matrix of covariates (standardized ages, incorporating orthogonal polynomial coefficients) is Z for all animals, whereas Z* is the part of Z corresponding to only those cows with records. The model’s first and second moments are:
E(y) = Xb '
V(y) = Z(K G ⊗ A)Z ' + Z * (K C ⊗ I)Z * + R where A and I are the numerator relationship matrix and an identity matrix, respectively; KG and KC are the matrices of genetic and permanent environmental (co)variances (coefficients of the covariance functions, CF), with dimensions equals to order of fit of the covariance functions (CFs) in the analysis; R is the variance of the temporary environmental effects (error term), which is a diagonal matrix allowing for different variances by age t. Genetic evaluation with a RRM was performed in DFREML-DXMRR programs (Meyer, 1998b). The CFs were on age of the cow expressed in months (AM) using quadratic (order three) regressions based on orthogonal (Legendre) polynomials, initially proposed by Kirkpatrick & Heckman (1989). The matrices of coefficients KG and KC (corresponding to the additive genetic and permanent environmental functions, G and C), and of the elements of R were estimated directly from the data by REML (Meyer & Hill, 1997) as covariance matrices of the corresponding random regression coefficients and were used to estimate breeding The South African Journal of Animal Science is available online at http://www.sasas.co.za/Sajas.html
South African Journal of Animal Science 2004, 34 (3) © South African Society for Animal Science
168
values for each animal at each age represented in the data. Additive genetic and permanent environmental random effects for RRM analyses were assumed to be uncorrelated as in the usual linear animal model (finite-dimensional) analyses. Genetic parameters and breeding values for CW were also estimated using a SRM, assuming measurements at different ages to represent the same trait with constant variance. The model included fixed effects of herd-measurement date concatenation (i.e. contemporary group) and linear and quadratic regressions on cow age in month. Additive genetic and permanent environmental effects of the cow were included as random effects in model. Maternal genetic effects were found to be negligible and were excluded from the model. The analyses were performed with a derivative-free REML algorithm (Smith & Graser, 1986) using the MTDFREML programs (Boldman et al., 1995).
Results and Discussions The unadjusted means (mean), predicted least squares-mean (LSM, ignoring random effects) and predicted generalised least-squares mean (GLS) for cow weights (kg) by age in month are presented in Figure 1. The predicted LSM and GLS were obtained fitting a RRM. The overall mean of weights was 507 ± 67 kg, with a range from 260 to 720 kg, and with a coefficient of variation of 13.3%. Cow weights show an increasing trend at early ages, a flat pattern at intermediate ages, and a decreasing trend at latter ages. Unadjusted weights showed seasonal fluctuations within a particular year of age. However LSM and GLS corrected for such fluctuations by adjusting for unequal subclasses and for random effects, respectively.
600
Weight (kg)
500 400
m ean lsm gls
300 200 100 0 30
45
60
75
90
105
120
135
Age (mo)
Figure 1 Unadjusted means (mean), least squares-mean (LSM) and generalised least squares-mean (GLS) for cow weights (kg) by age in month Table 1 Summary statistics and estimates of variance components and genetic parameters for mature weight (CW) of Bonsmara cows using simple repeatability modela,b No h2 c2 e2 Mean ± s.d. σ2p CW (kg) 58295 2118 507 ± 67.4 0.41 ± 0.023 0.31 ± 0.021 0.28 ± 0.004 a No = number of records; Mean = unadjusted mean; s.d. = standard deviation b 2 σ p = phenotypic variance; h2 = heritability; c2 = fraction of total variance due to the permanent environmental effect of the cow; e2 = fraction of total variance due to temporary environmental effects
Estimates of variance components and genetic parameters for cow weight from analysis using SRM are presented in Table 1. In general, estimate of heritability was moderate (0.41) indicating that selection for CW could be effective. The proportion of phenotypic variance due to permanent environmental effects associated with the cow accounted for 31% of the phenotypic variance for CW. Mature cow weight is a highly repeatable trait as indicated by the magnitude of total animal variance as proportion of the total The South African Journal of Animal Science is available online at http://www.sasas.co.za/Sajas.html
South African Journal of Animal Science 2004, 34 (3) © South African Society for Animal Science
169
phenotypic variance (0.72). The results are comparable with those reported by Nephawe et al. (2004) using data from the Germplasm Evaluation Project (GPE) at the US Meat Animal Research Centre (USMARC). Genetic parameters for CW were also estimated using RRM, allowing heterogeneity of variance by age in years (AY). Estimates of residual variances for cow weight by AY are shown in Table 2. The results indicate that temporary environmental variances tended to increase with age and suggest that assuming that the residual variances are homogenous as in the traditional repeatability model, may result in bias in genetic evaluation, especially for younger cows. Residual variances at older ages were comparable with the estimate of residual obtained using the SRM (σ2e = 593).
Table 2 Summary statistics and estimates of residual variance components (σ2e) for cow weights by age (yr) using random regression modela,b Age (yr) No Mean ± s.d. 2.5 – 3.4 6192 440 ± 53.8 3.5 – 4.4 7572 476 ± 57.9 4.5 – 5.4 9263 503 ± 60.0 5.5 – 6.4 9573 517 ± 61.6 6.5 –7.4 9070 525 ± 62.6 7.5 – 8.4 6945 531 ± 63.1 8.5 – 9.4 4834 533 ± 63.0 9.5 – 10.4 3107 531 ± 63.4 10.5-11.4 1739 534 ± 63.8 a No = number of records; Mean = unadjusted mean; s.d. = standard deviation b 2 σ e = variance due to temporary environmental effects (residual variance component)
σ2e 265.4 489.4 477.3 493.7 543.9 549.8 573.8 584.5 591.3
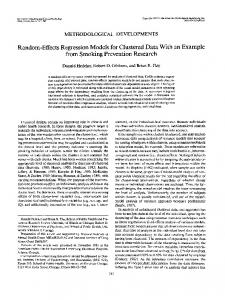
Estimates of additive genetic (co)variances showed an increasing pattern as animals aged, although they tended to flatten at later ages. Genetic variances ranged from 537 to 1162 for the range of ages, compared to the estimate of 868 obtained using SRM. Corresponding estimates of genetic correlations (Figure 2) exhibited a smooth surface with large values, which nearly formed a plane about unity. Genetic correlations declined as the interval between ages increased, but were over 0.82 for any pair of ages. The results agreed with those obtained by Arango (2002) who obtained estimates of genetic correlations that were greater than 0.70 amongst any pair of ages when analysing growth data from the GPE at USMARC. Meyer (1999), however, obtained correlations that were variable as low as 0.23 between extreme ages (19 and 199 mo) when working with Hereford cows. Such discrepancies could be attributable to the order of polynomials and rank of fit, as well as the particularities of the data sets.
Figure 2 Estimates of genetic correlations for monthly weights of Bonsmara cows The South African Journal of Animal Science is available online at http://www.sasas.co.za/Sajas.html
South African Journal of Animal Science 2004, 34 (3) © South African Society for Animal Science
170
Estimates of permanent environmental (co)variances also tended to increase with age but were comparable for pairs of intermediate ages. Permanent environmental variances ranged from 346 to 928, compared to 657 obtained using the SRM. The corresponding estimates of permanent environmental correlations were greater than 0.47 among pairs of ages in the data (Figure 3).
Figure 3 Estimates of permanent environmental correlations for monthly weights of Bonsmara cows Phenotypic (co)variances also tended to increase with age, but tended to be flat for pairs of later ages. Phenotypic variances ranged from 967 to 2549, compared to the estimate of 2118 obtained using the SRM. Phenotypic correlations (Figure 4) ranged from 0.51 to 0.82 amongst pairs of ages, but were somewhat erratic for pairs of early ages.
Figure 4 Estimates of phenotypic correlations for monthly weights of Bonsmara cows Estimates of heritability (h2) and permanent environmental effects (c2) for monthly weights of Bonsmara cows are presented in Figure 5. Estimates of heritability ranged from 0.39 to 0.47 and were consistent with the estimate of 0.41 obtained using the SRM. Meyer (1999) reported estimates of heritability with RRM that ranged from 0.37 to 0.57 for Hereford cows, and from 0.42 to 0.49 for Wokalups. Estimates of permanent environmental effect variances as a proportion of the total variance ranged from 0.30 to 0.42, The South African Journal of Animal Science is available online at http://www.sasas.co.za/Sajas.html
South African Journal of Animal Science 2004, 34 (3) © South African Society for Animal Science
171
Estimate
comparable with the estimate of 0.31 using SRM. The opposite relationship between estimates of permanent environmental variance and estimates of heritability was evident over time, in that the two components tended to balance each other. 0.5 0.45 0.4 0.35 0.3 0.25 0.2 0.15 0.1 0.05 0
h2 c2
30
50
70
90
110
130
150
Age (month)
Figure 5 Estimates of heritabilities (h2) and permanent environmental effects (c2) for monthly weights of Bonsmara cows One of the major advantages of RRM is that breeding values of a particular animal can be obtained at different time points (e.g., at any of the 108 months represented in the data). Figure 6 shows estimated breeding values (EBV) for selected sires (selected to represent the widest possible range and possible reranking) throughout the age trajectory represented in this study. For example, estimated breeding values of sires indicate that daughters of one sire would be genetically heavier at 90 months of age by about 40 kg (i.e. half of the EBV of the sire), whilst another sire would reduce mature size of his daughters by about 50 kg, as compared to their contemporaries. Noteworthy is that some lines crossed, suggesting possible re-ranking of sires along the ages represented in the data. 100 80 60 40
EBV
20 0 -20 30
50
70
90
110
130
-40 -60 -80 -100 Age (month)
Figure 6 Breeding values of selected sires throughout the age trajectory using the random regression model (RRM) Figure 7 shows genetic trends (i.e., breeding values plotted over birth year) for CW of Bonsmara cattle obtained by fitting a SRM and a RRM, using 1986 as the base year. Since a RRM gives an estimated breeding value of each animal for each age in month (i.e. 108 EBVs for each animal representing 30 to 138 mo), an average of all breeding values was taken for the purpose of plotting. Although in practice, each age (in months) could be considered a different time point with a different economic weight, equal economic The South African Journal of Animal Science is available online at http://www.sasas.co.za/Sajas.html
South African Journal of Animal Science 2004, 34 (3) © South African Society for Animal Science
172
weights were assumed along the age trajectory in the present study. Over the years, from 1967 to 1997, breeding values showed a slight increasing pattern to indicate that CW did not change to a great extent. The slope of the RRM plot was about 0.15 kg genetic increment per year, and that of the SRM was about 0.10 kg increment per year. More evident from the plots is that genetic trends for CW were similar whether genetic evaluations were performed using a SRM or RRM.
8 6
EBV
4 2 0 67
72
77
82
87
92
97
-2 Year of Birth -4
RRM
SRM
-6
Figure 7 Estimated breeding values plotted over birth year for mature weight of Bonsmara cattle, fitting either a simplest repeatability models (SRM) or a random regression models (RRM)
Conclusions The results suggest that selection for CW could be effective in South African beef cattle. The RRM approach using orthogonal (Legendre) polynomials on age, as implemented in this study, could be considered as useful to model repeated measures of CW. The results of the RRM were generally consistent with those obtained using a SRM. Therefore, for practical purposes the SRM might be an acceptable approximation for prediction of breeding values, given the computational demands of the RRM, although the accuracy of selection would always be higher with RRM.
References Arango, J.A., 2002. Genetic study of weight, height and body condition score in beef cows. PhD dissertation, University of Nebraska, USA. Boldman, K.G., Kriese, L.A., Van Vleck, L.D., Van Tassell, C.P. & Kachman, S.D., 1995. A manual for USE of MTDFREML. A set of Programs to Obtain Estimates of Variances and Covariances [DRAFT]. USDA-ARS., Washington DC, USA. Kirkpatrick, M. & Heckman, N., 1989. A quantitative genetic model for growth, shape, reaction norms, and other infinite-dimensional characters. J. Math. Biol. 27, 429-450. Kirkpatrick, M., Lofsvold, D. & Bulmer, M., 1990. Analysis of the inheritance and evolution of growth trajectories. Genetics 124, 979-993. Kirkpatrick, M., Hill, W.G. & Thompson, R., 1994. Estimating the covariance structure of traits during growth and aging, illustrated with lactation in dairy cattle. Genet. Res., Camb. 64, 57-69. Littell, R.C., Milliken, G.A., Stroup, W.W. & Wolfinger, R.D., 1996. SAS System for Mixed Models. SAS Institute Inc. Cary, North Carolina, USA. Meyer, K., 1998a. Estimating covariance functions for longitudinal data using random regression model. Genet. Sel. Evol. 30, 221-240.
The South African Journal of Animal Science is available online at http://www.sasas.co.za/Sajas.html
South African Journal of Animal Science 2004, 34 (3) © South African Society for Animal Science
173
Meyer, K., 1998b. ‘DXMRR’- A program to estimate covariance functions for longitudinal data by Restricted Maximum Likelihood. Proc. 6th World Congr. Genet. Appl. Livest. Prod., Armidale, Australia 27, 465-466. Meyer, K., 1999. Estimates of genetic and phenotypic covariance functions for postweaning growth and mature weight of beef cows. J. Anim. Breed. Genet. 116, 181-205. Meyer, K., 2000. Random Regression to model phenotypic variation in monthly weights of Australian beef cows. Livest. Prod. Sci. 65, 19-38. Meyer, K. & Hill, W.G., 1997. Estimation of genetic and phenotypic covariance functions for longitudinal or ‘repeated’ records by restricted maximum likelihood. Livest. Prod. Sci. 47, 185-200. Nephawe, K.A., Cundiff, L.V., Dikeman, M.E., Crouse, J.D. & Van Vleck, L.D., 2004. Genetic relationships between sex-specific traits in beef cattle: Mature weight, weight adjusted for body condition score, height and body condition score measurement of cows and carcass traits of their steer relatives. J. Anim. Sci. 82, 647-653. Schaeffer, L.R. & Dekkers, J.C.M., 1994. Random regression animal models for test-day production in dairy cattle. Proc. 5th World Congr. Genet. Appl. Livest. Prod., Guelph, Canada. 18, 443-446. Smith, S.P. & Graser, H.U., 1986. Estimating variance components in a class of mixed models by restricted maximum likelihood. J. Dairy Sci. 69, 1156-1165. Varona, L., Moremo, C., Garcia-Cortes, L.A. & Altariba, J., 1997. Multiple trait genetic analysis of underlying biological variables of production functions. Livest. Prod. Sci. 47, 201-210.
The South African Journal of Animal Science is available online at http://www.sasas.co.za/Sajas.html