Jun 27, 2008 - map of the environment created from bird-eye view perspective. .... a large amount of automated vision techniques assume perspective pro-.
U NIVERSITEIT VAN A MSTERDAM BACHELOR T HESIS A RTIFICIAL I NTELLIGENCE
Creating a Bird-Eye View Map Using an Omnidirectional Camera
Supervisor: Dr. Arnoud Visser
Author: Steven Roebert
June 27, 2008
Abstract An omnidirectional camera has properties which are highly beneficial for navigation of a mobile robot. In this thesis this is demonstrated with a new application; a visual map of the environment created from bird-eye view perspective. This visual map can be created on-line, which allows an operator to navigate the robot through an unknown environment based on this visual map.
Contents 1
2
3
4
Introduction 1.1 Omnidirectional Views . . 1.2 Urban Search And Rescue 1.3 USARSim . . . . . . . . . 1.4 Research Questions . . . .
. . . .
. . . .
. . . .
. . . .
. . . .
. . . .
. . . .
. . . .
. . . .
. . . .
. . . .
. . . .
. . . .
. . . .
. . . .
. . . .
. . . .
. . . .
. . . .
. . . .
. . . .
. . . .
. . . .
. . . .
1 1 1 2 3
Method 2.1 Creating a Bird-Eye View Image . . . . . . . . . 2.1.1 3D to Omnidirectional Pixel Relation . . 2.2 USARCommander . . . . . . . . . . . . . . . . 2.2.1 Creating a New Layer . . . . . . . . . . 2.2.2 Simultaneous Localization and Mapping . 2.3 Creating a Map . . . . . . . . . . . . . . . . . . 2.3.1 Transforming the Images . . . . . . . . . 2.3.2 Gradual Overlap . . . . . . . . . . . . . 2.3.3 Loss of Resolution . . . . . . . . . . . . 2.3.4 Obstacle Filtering . . . . . . . . . . . . . 2.3.5 Using the Grid Map . . . . . . . . . . . 2.4 Self Localization . . . . . . . . . . . . . . . . . 2.4.1 Kalman Filter . . . . . . . . . . . . . . .
. . . . . . . . . . . . .
. . . . . . . . . . . . .
. . . . . . . . . . . . .
. . . . . . . . . . . . .
. . . . . . . . . . . . .
. . . . . . . . . . . . .
. . . . . . . . . . . . .
. . . . . . . . . . . . .
. . . . . . . . . . . . .
. . . . . . . . . . . . .
. . . . . . . . . . . . .
. . . . . . . . . . . . .
3 3 3 4 5 5 5 5 6 6 6 7 7 7
Experimental Results 3.1 Image Transformations . . . . . 3.2 Mapping . . . . . . . . . . . . . 3.2.1 Without Object Filtering 3.2.2 Using Obstacle Filtering 3.3 Multiview . . . . . . . . . . . . 3.4 Grid Map . . . . . . . . . . . . 3.5 Self Localization . . . . . . . .
. . . . . . .
. . . . . . .
. . . . . . .
. . . . . . .
. . . . . . .
. . . . . . .
. . . . . . .
. . . . . . .
. . . . . . .
. . . . . . .
. . . . . . .
. . . . . . .
7 7 9 9 9 10 12 13
. . . .
17 17 17 17 18
. . . . . . .
Discussion and Further Work 4.1 Localization Improvement . . . . 4.2 Object Detection Improvement . . 4.3 Simulation Improvement . . . . . 4.4 Landmark Detection Improvement
. . . . . . .
. . . .
. . . . . . .
. . . .
. . . . . . .
. . . .
. . . . . . .
. . . .
. . . . . . .
. . . .
. . . . . . .
. . . .
. . . . . . .
. . . .
. . . . . . .
. . . .
. . . .
. . . .
. . . .
. . . .
. . . .
. . . .
. . . .
. . . .
. . . .
. . . .
. . . .
5
Conclusion
18
6
Acknowledgments
18
1
Introduction
Robots are becoming more and more integrated in today’s world. One typical field of work where robots have proven to be quite useful is in exploring environments that are either hard to reach or dangerous for human beings. In this particular field the robots can either be remotely controlled or express an autonomous behavior for exploring. However, in either way it is necessary for the human controller or observer to get a good understanding of the environment that is being explored. To achieve this effect can be quite an interesting problem, since the robot itself mostly uses representations of its world that are hardly intuitive or visual to humans. A good way of representing the environment to a person would be to create a visual map.
1.1
Omnidirectional Views
Although it is necessary for humans to have a good visual representation of an unknown environment, agents operating in a complex physical environment do also more often than not benefit from visual data obtained from their surroundings. The possibilities for obtaining visual information are numerous as one can vary between imaging devices, lenses and accessories. Omnidirectional vision, providing a 360◦ view of the sensors surroundings, is currently popular in the robotics research area and is currently an important sensor in the RoboCup. Omnidirectional views can be obtained using multiple cameras, a single rotating camera, a fish-eye lens and or a convex mirror. A catadioptric vision system, consisting of a conventional camera in front of a convex mirror with the center of the mirror aligned with the optical axis of the camera, is the most generally applied technique for omnidirectional vision. Mirrors which are conic, spherical, parabolic or hyperbolic all are able to provide omnidirectional images [1]. An omnidirectional catadioptric camera has some great advantages over conventional cameras, one of them being the fact that visual landmarks remain in the field of view much longer than with a conventional camera. Also does the imaging geometry have various properties that can be exploited for navigation or recognition tasks, improving speed and efficiency of the tasks performed by the robot. The main disadvantage of omnidirectional cameras over conventional ones is the loss of resolution in comparison with standard images [6]. Omnidirectional vision has played a major part in past and present research. At the University of Amsterdam, the Intelligent Autonomous Systems Group uses omnidirectional vision for Trajectory SLAM and for appearance based self localization using a probabilistic framework [3, 2]. For a complete overview of application of omnidirectional vision in robotics, see [5].
1.2
Urban Search And Rescue
One particular field of robot exploration which will be used in the experiments of this thesis is Urban Search And Rescue (USAR). It involves the location, extrication, and initial medical stabilization of victims trapped in confined spaces. There can be many causes for victims being trapped in their environment and the most common cause would be the collapse of buildings. In these operations the main goal is to rescue as many victims as possible while minimizing the risks for the rescuers. The main phases of these operations are as follows:
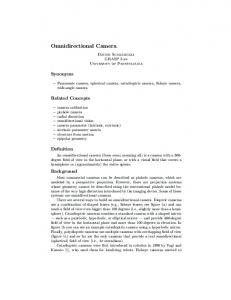
Figure 1: The catadioptric omnidirectional camera, real and simulated. • Sizeup: Gather as much information as possible about the current disaster, make initial decisions on the course of actions. • Search: Searching the environment of the disaster to localize victims. Many techniques are known to do this efficiently. • Rescue: Where possible rescue the victims that have been trapped and found. In the search part, localizing the victims is usually done by humans rescuers or trained dogs, but since 2001 the use of robots as aid to the rescuers was introduced. It is this part of USAR operations, where it is necessary to locate victims and to get a good representation of the environment, which will be the focus of this thesis.
1.3
USARSim
The RoboCup Rescue Simulation League is a competition where teams are challenged to let their robots find as many victims in an unknown environment as possible in a set amount of time. One of the simulators which is used and developed on this league is USARSim [4], the 3-D simulation environment of USAR robots and environments (Fig. 2), built on top of the Unreal Tournament game and intended as a research tool for the study of human-robot interfacing and multi-robot coordination [7]. The omnidirectional vision sensor is a recent extension [9] of the USARSim environment. The Virtual Robots Competition, using USARSim as the simulation platform, aims to be the meeting point between researchers involved in the Agents Competition and those active in the RoboCup Rescue League.
Figure 2: The DM-compWorldDay1 250.utx map in the USARSim environment.
1.4
Research Questions
With the introduction of the omnidirectional camera (Fig. 1) to the USARSim environment [9] there has been created an opportunity to more easily explore its uses. Although there is quite some research in the uses of the omnidirectional images, there is hardly any in the direction of the bird-eye view images that can be created from the omnidirectional data. Since these bird-eye view images seem a lot more intuitive to the human eye (e.g. it looks like a visual map, Fig. 5) it could be of use when guiding robot’s through the unknown environments and especially when rescuers need to rescue any localized victims. The main research question I will try to answer in this thesis is as follows. Can omnidirectional camera’s improve performance (i.e. exploration, mapping and victim detection) during Urban Search and Rescue missions? I will also form an answer to the following subquestions to aid my final conclusion. How can a map of the environment, from a bird-eye’s view perspective, be created from omnidirectional image data? How can such a map aid the rescuers on their missions? And how do bird-eye view images perform in self localization comparing to the default omnidirectional images?
2
Method
2.1
Creating a Bird-Eye View Image
Omnidirectional image data provided by a parabolic catadioptric omnidirectional camera is hardly intuitive to a human observer (Fig. 4) as the parts of the image data shows the robot’s surroundings upside down, which could makes recognition more complicated, and due to reflection the environment is mirrored. The image also shows heavy counter-intuitive perspective distortion. It has already been shown [6] that image postprocessing can greatly improve the readability of omnidirectional data to a human observer. Further, a large amount of automated vision techniques assume perspective projection, which makes the transformation of omnidirectional image data to geometrically correct perspective images highly desirable. Here is described how to transform real omnidirectional image data into the perspective of an observer above the robot: the bird-eye view. This view allows to present the observation in a convenient way to a human operator. 2.1.1
3D to Omnidirectional Pixel Relation
Bird-eye views are obtained by radial correction around the image center. The bird-eye view is a scaled orthographic projection of the ground plane, and significantly simplifies the navigation system. For example, corridors appear as image bands of constant width. Shree K. Nayar describes a direct relation between a location in a 3D environment and the location in the omnidirectional image where this point can be seen if nothing obstructs the view [8]. The correspondence between a pixel in the omnidirectional image pomni = (xomn , yomn ) and a pixel in the birds-eye view image pbe = (xbe , ybe ) is defined by the following equations:
z , θ = arccos q 2 + z2 x2be + ybe
φ = arctan
ybe xbe
h 1 + cos θ = ρ sin θ cos φ, yomn = ρ sin θ sin φ ρ=
xomn
(1)
(2) (3)
where h is the radius of the circle describing the 90◦ incidence angle on the omnidirectional camera effective viewpoint. The variable z is defined by the distance between the effective viewpoint and the projection plane in pixels. These equations can be used to construct perspectively correct images based on omnidirectional camera data by translating 3D projection plane pixel locations to omnidirectional pixel locations. The results of these transformations can be seen in Figure 5.
2.2
USARCommander
USARCommander is created by the UvA Rescue Team and will be used in the upcoming Robocup Rescue Simulation League to control the robots. The target will be to explore the unknown environment and find as many victims as possible in a specific amount of time. The application uses a variety of algorithms and exploration techniques to guide robots on their search for victims. The interface of the program (Fig. 3) exists of two panels. One panel is reserved for creating a map of the environment, which the commander will use when guiding the robot’s on their exploration mission. The other panel is used to setup the robot’s variables and to control the robots when the simulation has started.
Figure 3: The USARCommander interface. The first of the two panels exists of multiple layers that are drawn onto a blue background. The commander uses this screen to retrieve all the necessary information about the environment to guide the robots in the right directions. It is therefore most important
that this information is intuitive and easy to understand. All the different layers contain different information and can be toggled on or off by the user. For example, there is a layer that only shows obstacles, a layer that shows free space and a layer that shows the locations of the agents on the map. 2.2.1
Creating a New Layer
The generated views by these layers are already very useful and provides the most basic needs when driving the robot around an unknown environment (e.g. obstacles and free space). Unfortunately, this information is only given by specific colors which will always be the same, no matter what environment. To make it more intuitive and especially have a lot more resemblance to the real world, a new layer will be created for displaying a map generated with the bird-eye view images. The bird-eye view images are particularly suited for creating this map, because they have a perspective as if they were taking directly above the scene, just as with the map used in USARCommander. So when adding a layer that creates textures that precisely match the colors and contours of the real environment, the use of USARCommander should become a lot more intuitive. Even better would be when combining this layer with other already existing layers to increase the performance of the user. 2.2.2
Simultaneous Localization and Mapping
Before the bird-eye view images can be used in a map, there needs to be information about the robot’s current location and orientation. USARCommander is already equipped with algorithms and techniques to estimate this so called pose of the robot. The algorithm used for the localization is Simultaneous Localization and Mapping (SLAM). This algorithm does what the name suggests. It builds up a map of an unknown environment while at the same time keeping track of the robot’s current location on this map. Observations used in the SLAM algorithm can be visual (e.g. landmark detection) or based on the accurate laser scanners used by the robots. USARCommander uses the ManifoldSLAM algorithm created by B. Slamet and M. Pfingsthorn [10], which uses the laserscanners on the robot.
2.3
Creating a Map
Once the location of the robot is known, it will represent the location on the map where the center of the bird-eye view image can be placed. With that information you can start building the visual map. 2.3.1
Transforming the Images
When the images are taken by the camera, the robot can be at any possible orientation on the map. Although the images have a field of view of 360◦ the images will still be different if the robot is facing another direction (i.e. rotated around the center of the image). This means the images have to be rotated to a default orientation in order to fit on the map. To obtain the required images which are all aligned in the same way, one can simply rotate the images using the same angle as the robot’s current rotation on the map. An alternative approach would be to estimate the relative orientation between two omnidirectional images, as done by [6].
As mentioned in section 2.1, the images taken from an omnidirectional camera are mirrored due to reflection. Since you do not want any mirrored images on a map, the images need to be flipped. After all these transformations it is time to use the transformed image to create the map. 2.3.2
Gradual Overlap
Because of possible localization errors it is not possible to take images in specific intervals in order to precisely fill up the map. Moreover, because there is a chance of localization errors, you will want new images to overlap older ones, in order to correct these errors. If images are drawn directly on the map, the overlapping parts of the current map will be overwritten by new information. Then if the new images contain small errors, they will also be directly visible on the map. To overcome these errors, the image will not be drawn directly but the colors of the map will gradually be changed towards the values of the bird-eye view images. The gradual change can be controlled by the use of a so called Gamma factor. This factor will be a number between 1 and 255 (i.e. possible color values) and will represent the maximum change in color value for a pixel when a camera image is being processed. It will then take multiple images from the camera to build up a visual map. Small errors will gracefully smooth out. 2.3.3
Loss of Resolution
A main disadvantage of catadioptric omnidirectional cameras is the loss of resolution. This loss of resolution mainly occurs for pixels further from the center of the image (Fig. 5). Therefore pixels further from the center should have less effect on the visual map. This effect can be implemented by adding a 2-dimensional Gaussian filter (equation 4).
e
−(x−x0 )2 +(y−y0 )2 2σ 2
(4)
This filter also takes into account the fact that the localization and perspective errors are more likely to occur further from the center of the image. The further away from the center, the lower the value for the Gaussian will be and thus the lower the change in color value will be performed. 2.3.4
Obstacle Filtering
When creating a bird-eye view from an omnidirectional camera image, there will be one significant difference from an image truely taken directly above the scene. This difference comes from the fact that an omnidirectional camera at the height of the robot can only see the sides of larger objects and not the actual top. This results in obstacles distorting the visual map behind them, polluting the map from all directions that those obstacles have been seen. The best way to deal with these objects is not to draw them at all, by applying an additional rendering filter. However, for such a filter a form of obstacle detection sensors on the robot should be present. In these experiments laser scanners where used for self localization and object detection. Using the laser scanners one can establish the location of the obstacles as objects in the bird-eye view image. The algorithm to filter the objects is build into the algorithm for merging the camera images with the map (i.e.
the algorithm using the gamma factor). The algorithm will go through all pixels from the camera image and decides if there exists an object on this location. This is done by consulting the data from the laser scanner that pointed towards the angle of that specific location. If the data provides the evidence for an existing object, every pixel that lies behind this object (in a line from the center of the image) will be filtered. Since one can not know exactly how tall an object will be, pixels behind it are not considered and will not be drawn. 2.3.5
Using the Grid Map
The standard USARSim maps do not really provide any hard evidence for the correct working of the map creation algorithm, the results can only be verified by people who have actually worked with these maps and know how it is constructed. This is why I also tested the algorithm on a map that consists of a grid floor, which is highly useful for camera calibration (Fig. 10).
2.4
Self Localization
Besides creating a map, I experimented with a more effective way of testing the performance of the bird-eye view images. Recently the omnidirectional images as well as panorama images that can be created from them, where tested on performance by using them for self localization in combination with a Kalman Filter [9]. 2.4.1
Kalman Filter
The Extended Kalman Filter (EKF), a recursive filter which estimates a Markov process based on a Gaussian noisy model, is based on formulas provided by Thrun and Burgard in [11]. The robot position µt is estimated on the control input ut and landmark measurement mt , as defined by Equations 5 to 7 respectively.
µt = (xt , yt , φt )
(5)
ut = (vt , δφt )
(6)
mt = (rt , γt )
(7)
where xt and yt define the robot location in world coordinates, φt defines the robot direction, vt defines the robot velocity, δφt defines robot rotation angle, γt defines the landmark perception angle. User input ut is defined by noisy odometry sensor data and the measured distance to a landmark, rt , is calculated based on the inverse of Equation 2.
3 3.1
Experimental Results Image Transformations
Using the equations 1, 2 and 3, the following images where created. As can been seen in the resulting bird-eye view images, you will get a clear view as if taken from directly above the scene. The only differences are the pillars which are exceptionally stretched, whereas normally when taken from above the scene they would just be small circles.
(a) Omnidirectional view of DMspqrSoccer2006 250.utx
(b) Omnidirectional view of DM-compWorldDay1 250.utx
Figure 4: Omnidirectional images taken in the USARSim environment.
(a) Transformation of figure 4(a)
(b) Transformation of figure 4(b)
Figure 5: 500x500 pixel bird-eye transformations of Figures 4 with zw = 40
3.2 3.2.1
Mapping Without Object Filtering
The first map construction experiments where done without the obstacle filtering. They where performed in 4 different RoboCup worlds. Unfortunately, most of the RoboCup worlds resemble an environment after a disaster, which means that there color scheme is mainly gray. The constructed maps are not that sharp as the single images depicted in Figure 5, because they are a combination of many bird-eye views, every time from a slightly different location. The constructed maps cover more area than a single bird-eye view. For instance Figure 6(c) covers an area of 20x20 meter.
(a) DM-spqrSoccer2006 250
(c) DM-Mapping 250.utx
(b) DM-Mobility 250.utx
(d) compWorldDay1 250.utx
DM-
Figure 6: Bird-eye view maps created in 4 different RoboCup worlds, without object filter, using omnidirectional images of 640x480 pixels The best resemblance to the real world was gained with the soccer map (Fig. 6(a)), obviously because this is a relatively small map with hardly any obstacles. As can be seen in Figures 6(b) and 6(c), the obstacles (mainly the walls) oppose a huge problem in the final outcome of the map. In Figure 6(b) the walls greatly overlap other parts of the map. This fact combined with the overall grayness of the world, results in a quite unclear and unusable map. For the map to be of any use, there must at least be a clear distinction between free space and non-free space. Since this distinction can not be made without any form of obstacle detection, the obstacle filter was introduced (see section 2.3.4). 3.2.2
Using Obstacle Filtering
When using the obstacle filter, one can clearly see a huge improvement in the created maps. Figure 7 shows the same maps as discussed above, only now the obstacle filter has
been applied. The greatest improvement can be found in the mapping map (Fig. 7(c)). The free space is now clearly visible, while the non-free space is not drawn at all, leaving the original blue color. You immediately get a good idea of the outlines of the world, while Figure 6(c) did not have this effect at all.
(a) DM-spqrSoccer2006 250
(c) DM-Mapping 250.utx
(b) DM-Mobility 250.utx
(d) compWorldDay1 250.utx
DM-
Figure 7: Bird-eye view maps created in 4 different RoboCup worlds, with object filter, using omnidirectional images of 640x480 pixels When taking a closer look at the generated maps using the objects filter, there are some details that need to be discussed. One typical error that seems to occur more often when the robot makes a lot of sharp turns, is the breaking of some straight lines. This can be seen quite clearly in the image from the competition map (Fig. 7(d)). The lines of the zebra crossing are distorted and you can see two divided parts which have a different rotation. As can be seen in the path the robot traveled on the map, this error occurs almost every time when the robot makes a sharp turn. Another detail worth mentioning is the black trail that is visible on most parts of the map. This is the path the robot traveled. Because the center of the omnidirectional images will always exist of the robot, the robot will be drawn on every part of the map where an image is taken. If needed (depending on the application), this trail could be easily removed by including the robot shape as an obstacle in the obstacle filter. The robot’s image would then be filtered and it will no longer leave a black trail.
3.3
Multiview
For the above results the highest possible resolution for the omnidirectional images was used, 640x480 pixels. This is obviously necessary to get the best results, since less resolution would result in less detail and more errors when transforming the images to their bird-eye view format. However, when attending the Robocup Rescue Simulation
League there will be multiple robots driving around the environment, all using a camera (either a normal perspective one, or omnidirectional) to detect and localize victims. All of these camera images will be put in one high resolution image when being send to the USARCommander software, this is the so called Multiview mode. This obviously results in a much lower resolution image per robot to work with. Because the initial idea was to use the map creation technique in the Robocup league, it also has to work correctly at lower resolutions. To test the lower resolutions, images containing a resolution of 320x240 pixels were obtained and all previously used maps were used once again for a good comparison. The results can be seen in Figure 8.
(a) DM-spqrSoccer2006 250
(c) DM-Mapping 250.utx
(b) DM-Mobility 250.utx
(d) compWorldDay1 250.utx
DM-
Figure 8: Bird-eye view maps created in 4 different RoboCup worlds, with object filter, using omnidirectional images of 320x240 pixels At first sight these images do not look very different from the ones in Figure 7 which were made using higher resolution images. But when you zoom in and look closer, you can really see some differences. First and most obvious would be the less amount of detail. This is particularly visible in Figure 8(a) on the locations of the white lines on the soccer field. These white lines are very thin compared to the resolution of the images and due to localization errors they will mostly be overwritten by the green parts on newly taken images. However, in the high resolution images you can still make them out if you look close enough, whilst in the lower resolution images you can only see some white spots without any forming of a line. Although minimal, it is a difference non the less and should be taken into account when small details on the map are important. Another interesting difference between the two images is the fact that the object rendering seems to be better on the lower resolution images. Once again this is mostly visible on the soccer map, which will be caused by the simple fact that this map is a lot
smaller than the other three and therefore has more details per pixel. The small pillars and the goals are filtered, like they should, from the lower resolution map, whilst they are still visible on the higher resolution maps. However, this difference is not a direct effect of using lower resolution images, but has to do with the amount of laser scanners used for object detection. In the used simulation the robot has 180 laser scanners in an 180◦ angle, so one scanner for each degree in front of the robot. When determining for a pixel if it should be drawn or if there is an obstacle and it should not be drawn, the algorithm uses the fact that this pixel will be seen by at least one of the laser scanners. If the image has less pixels, this method will obviously work better than if a higher resolution image with more pixels is being used. In the case of more pixels there is a higher chance per pixel that it is not really covered by one of the laser scanners, which results in more errors for smaller objects. In the case of a wall, this problem does not really exist, because most of the time the nearest laser scanner to a pixel will also see the wall and so the pixel is not drawn.
(a) A high resolution image.
(b) A low resolution image.
Figure 9: Illustration of problem with laser scanner coverage for high resolution images. To better illustrate this problem I have created two images (Fig. 9), one with a high and one with a low resolution. Both have the same laser scanners, in the form of red lines. The green part of the images are the pixels that are covered by at least one of the laser scanners. As you can see, in the lower resolution image, although not very accurate, a much larger part of the image is covered by green and so more objects will be filtered. To solve this problem, one could either use more laser scanners when working with higher resolution images, or use alternative methods to detect objects on the actual images.
3.4
Grid Map
To further test the performance of the map creation algorithm a test was done on a map that exists of walls and a floor with a grid of 15x15 squares. The test was done using 640x480 as well as 320x240 omnidirectional images. The results can be found in Figure 10. Although lines are visible on both images, one can not distinctly see a 15x15 grid on any of them. These images do suggest that a higher resolution camera and a better localization would be needed if such a level of detail is required. It proves that the algorithm definitely has room for improvement.
(a) Map created using 640x480 (b) Map created using 320x240 omnidirectional images. omnidirectional images.
Figure 10: Maps created on a grid map consisting of 15x15 square textures.
3.5
Self Localization
For measuring self localization performance with bird-eye view images, the same experiments where executed as described in [9]. The results from the experiments (Fig. 11(a) and 12(a)) show a lot of resemblance. Both estimated paths show little errors and both results show more errors between time steps 60 and 80. This results from problems in detecting the blue and red landmarks. Clearly visible on Figure 12(a) are some detected landmarks far from their true position. These false positives are significantly more present at the bird-eye view results, compared to the omnidirectional results. These errors are caused by stretching of the landmarks and jpeg artifacts. The application used to retrieve the images from USARSim is only able to deliver jpeg images. Because of the artifacts in these images combined with low resolution, some of the landmark colors can also be found in dark corners and a few pixels next to the real landmarks (Fig. 4(a)). When transforming the images to bird-eye view images, the landmarks are stretched, but the artifacts are as well (Fig. 5(a)). This results in more significant artifacts that are falsely detected as landmarks. The problem of landmarks being detect in dark corners can be found in the results in Figure 12(a) in the lower left corner. The estimated path makes an error by going down too far and then back up again, because a landmark was detected where it is not. Further manual landmark detection has been done to measure the true positives and false positives, the results from these experiments can be seen in Figure 13. Results from the previous discussed figures are confirmed by these experiments. Landmark detection on omnidirectional images show little to no false positives, while the birdeye view images show significantly more errors. However, the estimated path for the bird-eye view images is still as precise as the one for omnidirectional images. This comes from the fact that on most of the time steps with the omnidirectional images, the landmark detection algorithm can only find one particular landmark. As can be seen in Figure 4(a) the landmarks are relatively small, so most of the time only the nearest one is detected. With the bird-eye view images however, most of the time two or even three landmarks are detected, because in these images the landmarks are stretched out (Fig. 5(a)), resulting in a better detection from further away.
(a) Landmark measurements and robot self local- (b) EKF localization uncertainty covariance plot. ization. Red path: noisy odometry sensor data, black path: EKF estimated path, grey path: actual robot path.
(c) Localization error in meters.
Figure 11: Self Localization results on the DM-spqrSoccer2006 250 map using omnidirectional images
(a) Landmark measurements and robot self local- (b) EKF localization uncertainty covariance plot. ization. Red path: noisy odometry sensor data, black path: EKF estimated path, grey path: actual robot path.
(c) Localization error in meters.
Figure 12: Self Localization results on the DM-spqrSoccer2006 250 map using bird-eye view images
(a) Using omnidirectional images.
(b) Using bird-eye view images.
Figure 13: Color histogram based landmark detection test results.
4
Discussion and Further Work
In the course of the project, some specific problems arose that might need further research. These problems and possible solutions will be discussed in this section.
4.1
Localization Improvement
During the creation of a map of the environment, the most significant error in the final outcome of these maps had to do with localization errors. As can be seen best in Figure 7(d), these errors will occur more frequently if the robot makes a lot of sharp turns. This would make sense, since the SLAM algorithm will detect a lot of changes in the environment when the robot turns around on the spot and will start recalculating its location. Errors in these calculations will be more clearly visible on the map than when driving forward, because now more images are being processed on one location. Given the results from the self localization experiment, using an Extended Kalman Filter, in section 3.5, it can be concluded that omnidirectional image data, as well as the transformed bird-eye view images are suited for localization. Together with the techniques for estimating the relative orientation between two omnidirectional images [6], this could be the next step in improving the map creation.
4.2
Object Detection Improvement
As for the object detection, it works quite well. The larger and more dominant objects like walls are easily detected and filtered. One disadvantage in the current solution however, is that there are only 180 laser scanners in front of the robot and none directed to its backside. Because of this the map can only be updated in front of the robot, which removes the highly usable 360◦ field of view the omnidirectional camera provides. This could be improved by using the local map that is being stored by the ManifoldSLAM algorithm. This map combines measurements from the current state as well as previous states of the robot to form a larger area of object locations. This would then mean one can use a larger portion of the omnidirectional images and results in more accurate updates. Another possibility, although more advanced, would be to directly detect objects in the omnidirectional image data. This could be done using learning algorithms which will learn what kind of shapes or colors are highly likely to be objects. In that case the object detection is no longer dependent on any other sensor and the complete 360◦ images can be used.
4.3
Simulation Improvement
Although most of the errors in the map come from localization errors, I also noticed some delay between the activities in USARSim and the interface from USARCommander. To test this delay I build in a timer for measuring synchronization errors (between images taken from the camera and the calculation of the robot’s current pose). Most of the time this error was insignificant, but from time to time it would increase to such an extend that it causes problems in the creation of the map. I experimented with this problem on multiple computers and it also seems to be more present on slower computers. Although I did not have enough time to get to the bottom of this specific problem in the simulation, it is obvious that it needs to be corrected and will be a topic for further work.
4.4
Landmark Detection Improvement
In section 3.5 I discussed the differences between self localization using omnidirectional images and bird-eye view images. Although bird-eye view images have more chance of detecting multiple landmarks at a time, they also seem to cause more false positives. These tests where done only to prove that bird-eye view images can be used for self localization and the landmark detection algorithm used was originally designed for omnidirectional images. Since landmarks will be stretched out in bird-eye view images, they are more clearly visible, even from a distance, but because of the resolution loss as discussed in section 2.3.3 wrongly detected landmarks occur more often. As further research, the detection algorithm for the landmarks in bird-eye view images could be improved, taking into account the stretched look and possible loss of resolution. This could then result in a possibly even better localization performance than with default omnidirectional image data.
5
Conclusion
Based on the theory described in section 2 and the results from section 3, I can conclude that bird-eye view images transformed from omnidirectional image data improves performance in localization and mapping for unknown environments. This especially includes missions for Urban Search and Rescue. Maps created from the bird-eye view images, although not perfect yet, provide a more intuitive way and shows more details than the default maps created from laser scanners. It has already been proven that omnidirectional image data provides good performance in localization [6], mostly because the images have a field of view of 360◦ which results in landmarks being visible for a much longer time than with normal camera images. From the results in section 3.5 I can conclude that bird-eye view images also provide this kind of performance and can even detect more landmarks at a time than the default omnidirectional images. This makes the bird-eye view images suitable for landmark detection and thus for self localization.
6
Acknowledgments
I would like to thank my supervisor Arnoud Visser for his constructive feedback, clear goals and giving me enough great ideas to experiment with and write about. Not only am I glad with my choice of subject for this thesis because if was very interesting and fun to work on, but also very glad I had Arnoud as my supervisor. Furthermore, I would like to thank Tijn Schmits for his great help on the localization experiments, which were done using his code. I could not have done it without someone with this much insight on the actual code.
References [1] S. Baker and S. K. Nayar. A theory of single-viewpoint catadioptric image formation. International Journal of Computer Vision, 35(2):1–22, 1999. [2] O. Booij, B. Terwijn, Z. Zivkovic, and B.J.A. Kr¨ose. Navigation using an appearance based topological map. In Proceedings of the International Conference on Robotics and Automation ICRA’07, pages 3927–3932, Roma, Italy, 2007.
[3] R. Bunschoten and B.J.A. Kr¨ose. Robust scene reconstruction from an omnidirectional vision system. IEEE Transactions on Robotics and Automation, 19(2):351– 357, 2003. [4] S. Carpin, M. Lewis, J. Wang, S. Balakirsky, and C. Scrapper. Bridging the Gap Between Simulation and Reality in Urban Search and Rescue. In G. Lakemeyer, E. Sklar, D.G. Sorrenti, and T. Takahashi, editors, RoboCup 2006: Robot Soccer World Cup X, volume 4434 of Lecture Notes on Artificial Intelligence, pages 1–12, Berlin Heidelberg New York, October 2007. Springer. [5] K. Daniilides and N. Papanikolopoulos. Special issue on panoramic robots. IEEE Robotics & Automation Magazine, 11(4), December 2004. [6] J. Gaspar, N. Winters, and J. Santos-Victor. Vision-based navigation and environmental representations with an omnidirectional camera. IEEE Transactions on Robotics and Automation, 16(6):890–898, 2000. [7] A. Jacoff, E. Messina, and J. Evans. A standard test course for urban search and rescue robots. In Proceedings of the Performance Metrics for Intelligent Systems Workshop, pages 253–259, 2000. [8] Shree K. Nayar. Catadioptric Omnidirectional Camera. In IEEE Conference on Computer Vision and Pattern Recognition (CVPR), pages 482–488, Jun 1997. [9] Tijn Schmits and Arnoud Visser. An Omnidirectional Camera Simulation for the USARSim World. In Proceedings of the 12th RoboCup International Symposium, July 2008. Proceedings CD. To be published in the Lecture Notes on Artificial Intelligence series. [10] B. Slamet and M. Pfingsthorn. Manifoldslam: a multi-agent simultaneous localization and mapping system for the robocup rescue virtual robots competition. Master’s thesis, Faculteit der Natuurwetenschappen, Wiskunde en Informatica, Universiteit van Amsterdam, 2006. [11] S. Thrun, W. Burgard, and D. Fox. Probabilistic Robotics. MIT Press, Inc., Cambridge, MA, USA, 2005.