Map World Forum
Hyderabad, India
Crop Types Classification By Hyperion Data And Unmixing Algorithm H. FAHIMNEJAD1, S.R. SOOFBAF2, A. ALIMOHAMMADI3, M. J. VALADAN ZOEJ4 Geodesy and Geomatic Faculty, K.N.Toosi University of Technology, Tehran, Iran Tel: +989121985407, +982188786212, +982188770218 Fax: +982188786213 1
[email protected],
[email protected], 3
[email protected],
[email protected]
KEY WORDS:
classification , Hyperion, Crop types, unmixing, Iran
Abstract:
Availability of new generation of hyperspectral sensors such as the Hyperion has lead to new challenges in the area of crop type mapping and agricultural management. The sensor’s 242 Spectral band between 400 and 2500 nm (level 1B1) and spatial resolution of 30m bear high potentials for agricultural crop discrimination and detailed land use classification. Wheat and barley are examples of crop types which display high similarities in normally available multispectral data. Examination of the separability of these two crop types is the main objective of this work. In this research, Capabilities of Hyperion hyperspectral imagery acquired from an agricultural area located in southern parts of Tehran, Iran, has been evaluated for discrimination of wheat and barley. Atmospheric correction and other pre-processing operations on the hyperspectral imagery have been performed by using routine procedures. Based on the detailed ground truth data, two supervised classification approaches including the Spectral Angle Mapper (SAM) and linear Spectral Unmixing have been evaluated. Results of the classifications indicate the higher accuracy of the LSU algorithm and promising capabilities for discrimination of wheat and barley by the Hyperion data.
1. INTRODUCTION 1.1. Overview The Hyperion sensor onboard NASA’s Earth Observing 1 (EO-1) satellite is the first spaceborne hyperspectral instrument to acquire both visible/near-infrared (4001000 nm) and shortwave infrared (900-2500 nm) spectral data [1]. Because of having 242 potential bands and spatial resolution of 30 m, the sensor bears the potential to provide data for both detailed land use classification and estimation of biogeophysical and chemical properties of heterogeneously vegetated areas. In this study, the suitability of Hyperion data for crop type classification in typical Iranian agricultural environment composed of small fields with diverse crop types has been investigated. Discrimination of crop types has been performed by using both a well known Spectral Angle Mapper approach and a Linear Spectral Unmixing method. Because of difficulties of separation by normally available multispectral data, examination of the capabilities of Hyperion data for discrimination of two spectrally
GIS Development ©
Map World Forum
Hyderabad, India
similar crop types including wheat and barley has been the main objective of this research. 1.2. The study Site An agricultural area located in southern parts of Tehran, known as Ahmadabad has been selected as the study site. Wheat and barley are the main agricultural crops in the area. More than 30 fields of detailed ground-truth dataset have been visited in the field and their records have been used as a ground truth data for training and verifying the results of the classification. 1.3. Hyperspectral Data Hyperion data were acquired over the Ahmadabad village on May 21, 2002 at 06:57:56 GMT. The EO-1 satellite is a sun-synchronous orbit at 705 km altitude. Hyperion data includes 256 pixels with a nominal size of 30 m on the ground over a 7.65 km swath. Well-calibrated data (Level 1B1) is normally available. Post-Level 1B1 processing of the dataset, as performed in this study, included correction for bad lines, striping pixels and smile, atmospheric correction and co-alignment. Hyperion data is acquired in pushbroom mode with two spectrometers. One operates in the VNIR range (including 70 bands between 356-1058 nm with an average FWHM of 10.90 nm) and the other in the SWIR range (including 172 bands between 852- 2577nm, with an average FWHM of 10.14 nm). 44 of 242 bands including bands 1-7, 58-76 and 225-242 are set to zero by TRW software during Level 1B1 processing [1].
2. REMOTE SENSING DATA PREPARATION Post-level 1B1 data processing operations for preparation of the Hyperion data for classification including band selection, correction for bad lines, striping pixels and smile, a pixel-based atmospheric correction using FLAASH [2] and a co-alignment were performed as follow. 2.1. Band selection Atmospheric water vapor bands which absorb almost the entire incident and reflected solar radiation and the bands that have very severe vertical stripping are usually identified by visual inspection of the image data or atmospheric modeling [3]. The subset of 160 selected bands are listed in Table Ι. Array VNIR SWIR
Bands 8 t0 57 83 to 119 130 to 164 181 to 184 187 to 220
Wavelength(nm) 427 to 926 973 to 1336 1447 to 1790 1962 to 1992 2022 to 2355
Table I: List of the selected 160 bands used for this research
GIS Development ©
Map World Forum
Hyderabad, India
2.2. Bad line correction The bad lines in Hyperion level 1B1 data appear as dark vertical lines. These pixels have lower DN values as compared to their neighboring pixels. These pixels were corrected by replacing their DN values with the average DN values of their immediate left and right neighboring pixels [4]. 2.3. Correction of striping Pixels Vertical stripes are caused by differences in gain and offset of different detectors in pushbroom-based sensors. The statistics of the detector arrays can be studied by accumulating mean, variance, minimum, and maximum data for each pixel in each band over the lines of an image. As discussed above, Vertical stripe occurs where the statistics indicates, that the image information is valid (that is not considered as bad pixel) but with significantly modified gain and offset. We assume that such gains and offsets are relatively stable over a collect but not necessarily between collects [3]. A general approach for removing vertical stripes with these characteristics is similar to methods used in the past to balance horizontal stripes in mirror scanner images by histogram equalization or to flatten images affected by limb brightening or to balance detectors in airborne pushbroom sensors [3]. That is, histogram moments, such as the means and variances of the columns in each band, are used to balance the statistics of the arrays to those of a reference histogram. The pixel balancing applied here is different in that it may be done either “globally” or “locally.” In global balancing, the statistical moments of each column are modified to match those for the whole image for each band. In the local approach, reference moments are estimated locally [3]. In this research, global balancing method was used. 2.4. Smile Correction Smile, which exists in all Hyperion datasets, refers to an across-track wavelength shift from center wavelength, which is due to the change of dispersion angle with field position. According to the Hyperion spectral calibration [5], the shifts are dependent on pixel position in the across-track direction. For VNIR bands, the shifts range between 2.6–3.5nm. For SWIR bands, the shifts are less than 1 nm and are not significant for agricultural applications [5]. Considering the high spectral resolution of the Hyperion data, the 2.6–3.6-nm shifts of VNIR bands cannot be ignored, in this case the pixel spectra may result in reduction of classification accuracies. Column Mean Adjustment in Radiance Space method was used for smile correction in this research [5]. 2.5. Co-alignment A shift of one pixel in the line direction was corrected in the SWIR image data. This shift occurred between pixel positions 128 and 129. A spatial misregistration between the VNIR and SWIR data was detected. A co-alignment between the two datasets are achieved by a counter-clockwise rotation followed by a negative onepixel shift in the line direction. These operations were carried out on the VNIR data, which were then resampled with a piecewise linear interpolation based on the values of the nearest eight points. GIS Development ©
Map World Forum
Hyderabad, India
The VNIR were matched to the SWIR data. The co-alignment was carried out prior to atmospheric correction in order to use the 940-nm water vapour absorption in combination with the one located at 1130-nm for scene-based retrieval of water vapour content on a pixel basis [6].
2.6. Atmospheric Correction Atmospheric correction of the 160 channels of Hyperion dataset was performed by using FLAASH, an atmospheric correction program based on look-up tables generated with a radiative transfer code (MODTRAN-4) [7].
3. CLASSIFICATION 3.1. Spectral Angle Mapper Spectral Angle Mapper (SAM) is a classification method that permits rapid mapping by calculating the spectral similarity between the image spectrums to reference reflectance spectra. The reference spectra can either be taken from laboratory, field measurements or extracted directly from the image. SAM measures the spectral similarity by calculating the angle between the two spectra, treating them as vectors in n-dimensional space [8]. Small angles between the two spectrums indicate high similarities and high angles indicate low similarities (figure 1).
Figure 0: The concept of spectral angle between two material A and B
This method is less sensitive to solar illumination factors, because the angle between the two vectors is independent of the vectors length. It takes the arccosine of the dot product between the test spectrums "t" to a reference spectrum "r" expressed as the following equation [8]: nb t i ri ∑ −1 i= 1 α = COS 1 1 nb 2 2 nb 2 2 ∑ t i ∑ ri i= 1 i= 1
(1)
Where nb = the number of bands GIS Development ©
Map World Forum
Hyderabad, India
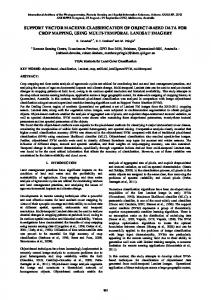
t i = test spectrum ri = reference spectrum The main advantages of the SAM algorithm are its simple structure, easy and rapid usage for mapping the spectral similarity of image spectra to reference spectra. It is also a very powerful classification method because it represses the influence of shading effects to accentuate the target reflectance characteristics. However, the main disadvantage of using this algorithm as a hard classifier is not considering the spectral mixture problem. The most erroneous assumption made with SAM is that endmembers chosen to classify the image represent the pure spectra of a reference material. This problem generally occurs with medium spatial resolution images, such as the Landsat and Hyperion. The surface of the Earth is complex and heterogeneous in many ways, thus having mixed pixels is incontestable. The spectral confusion between pixels often can lead to underestimation or overestimation errors for a spectral class. In theory, the spectral mixture problem for a given set of objects is expected to decrease with higher resolution images like IKONOS. But in some cases, it may also increase the mixture problem because local variations in the spectral properties of a surface, caused by parameters such as the humidity, elevation and shading effects may become more apparent [8]. Although selection of a suitable threshold for hard classification by SAM is very critical, after careful consideration, 0.1 was determined and used as the best threshold for discrimination of wheat and barley in this research. 3.2. Endmember extraction Theoretically the existing pure features in mixed pixels are refered to as endmembers. Selection and identification of spectral endmembers in an image is the key point to success of the linear spectral mixing model. A set of endmembers should allow the description of all spectral variability for all pixels. Two different approaches have generally been used to define endmembers in a mixing model: • Use of the existing library of reflectance spectra • extraction of the purest pixels from the image data itself Endmembers resulting through the first option are denoted as known endmembers whereas the second option results in derived endmembers. Because of the difficulties of access to spectral library or field measurement of spectral properties of land cover types of interest, endmember data of the known ground cover types were extracted from the Hyperion data. Three endmembers including soil, wheat and barley crops as extracted from the Hyperion data are represented in figure 2.
GIS Development ©
Map World Forum
Hyderabad, India
Figure 2: Spectral profile of 3 endmembers extracted from the Hyperion data
3.3. Linear Spectral Unmixing A simple and commonly used method of mixture analysis is the linear model. In this model, the spectrum is considered as a linear combination of the "pure" spectra of the materials located in the pixel area, weighted by their fractional abundance [9]. In linear mixture modeling the resulting pixel reflectance spectrum is assumed to be a summation of the individual material reflectance functions multiplied by the surface fraction they constitute. That means with known number of endmembers and by having the spectra of each pure component, the observed pixel value in any spectral band can be modeled by the linear combination of the spectral response of components within the pixel. The linear mixture model for a pixel, with the observed reflectance ri in band i can be described as: ri =
n
∑
j= 1
f j aij + ε i
(2)
Where n is the number of endmembers f j : Fraction of endmember j aij : Spectral response of Endmember j in band i
ε i : Error term Using these techniques it is possible to derive the relative or absolute abundance of a number of spectrally pure components, together termed as endmembers, contributing to the observed reflectance of the pixel. Therefore, the fractions at each pixel (the unmixing result) can be computed by taking the inverse of equation 2. Additionally, one can impose constraints upon the solutions of equation 2. One set of constraints requires the fractions within a pixel to sum to unity. n
∑
i= 1
fi = 1
(3)
A fully constrained set would also require that each individual fraction to lie between 0 and 1: 0 ≤ fi ≤ 1 ( 4)
GIS Development ©
Map World Forum
Hyderabad, India
For the purpose of crop type discrimination, results of the linear spectral unmixing were classified. Training data of these crops were used as a guide for thresholding these results. 4. Results Figure 3, represents classification results of using SAM and Linear Spectral Unmixing methods on Hyperion image of the agricultural test site. Accuracy of these two classification methods are shown in table 2 and 3. Soil Wheat Barley Unclassified
SpectralFigure similarities betweenresults barley wheat have resulted in some classification 3: Classification forand SAM (left) and Linear Spectral Unmixing (right)two for discrimination of three classes soil, wheat barley errors between these crops. The confusion between theseand crops is more obvious in results of the SAM classification (table 2). Class
Wheat
Ground truth(test pixels) Barley Soil Total
Unclassified
563
423
16
1002
Wheat
1046
79
0
1125
Barley
185
1071
0
1256
Soil
0 1794 0.58
0 1573 0.68
467 483 0.97
Total Reliability
467 3850 Overall accuracy= 67.1169% Kappa value(k)= 0.5403
Table 2: Accuracy of SAM algorithm for discrimination of 3 cover types
Results of spectral unmixing approach are more promising and considerable increases in the accuracy of classification as compared to SAM have been obtained (table 3). In addition to increases in accuracy also unclassified pixels are considerably decreased. Observation of more unclassified pixels in the SAM results can be contributed to the subjective selection of threshold for classification. GIS Development ©
Map World Forum
Class
Wheat
Hyderabad, India
Ground truth(test pixels) Barley Soil Total
Unclassified
0
0
0
0
Wheat
1558
93
0
1651
Barley
47
1309
2
1358
Soil
0
0
475
475
Total
1605 0.97
1402 0.93
477 1.00
Reliability
3484 Overall accuracy= 95.9242% Kappa value(k)= 0.9328
Table 3: Accuracy of Linear Spectral Unmixing algorithm for discrimination of 3 cover types
5. Conclusions Classification accuracy for discrimination of wheat and barley by Linear Spectral Unmixing method is considerably higher than that of the SAM method. One major reason for this increase in accuracy can be more efficient utilization of the rich spectral data in this method. Application of linear spectral unmixing for discrimination of two spectrally overlapping crops including wheat and barley has been promising. Considerable increase in the accuracy as compared to the SAM algorithm has been observed. Because of the high capability of Hyperion data wider evaluation of these data for crop type mapping and also extraction of useful quantitative information for the purpose of crop monitoring and management is recommended.
References [1] Jay S. Pearlman, "Hyperion Validation Report", Boeing Report Number 03-ANCOS-001, July 16, 2003 [2] Beck R., "EO-1 User Guide v. 2.3 ", Department of Geography University of Cincinnati, July 15, 2003 [3] Datt, B., McVicar, T.R., Van Niel, T.G., Jupp, D.L.B., and Pearlman, J.S, 2003, "Preprocessing EO-1 Hyperion Hyperspectral Data to Support the Application of Agricultural Indexes", IEEE Trans. Geosci. Remote Sensing, 41(2), pp.1246-1259. [4] T. Han, D. G. Goodenough, A. Dyk, and J. Love, “Detection and correction of abnormal pixels in Hyperion images,” in Proc. IGARSS, vol. III, Toronto, ON, Canada, 2002, pp. 1327–1330. [5] Goodenough, D.G., Dyk, A., Niemann, O., Pearlman, J.S., Chen, H., Han, T., Murdoch, M., and West, C., 2003.Processing HYPERION and ALI for Forest Classification.IEEE Trans. Geosci. Remote Sensing, 41(2), pp.1321-1331. [6] Staenz, K., R.A. Neville, H.P. and White, S., “Retrieval Of Surface Reflectance From Hyperion Radiance Data”, IEEE International Geoscience and Remote Sensing Symposium, June 24-28, 2002. [7] FLAASH Module User’s Guide, ENVI FLAASH Version 4.2 August, 2005 Edition. [8] Girouard G., Bannari A., Harti A. El and Desrochers A.," Validated Spectral Angle Mapper Algorithm for Geological Mapping: Comparative Study between Quickbird and Landsat-TM", isprs conferences, istanbul2004.
GIS Development ©
Map World Forum
Hyderabad, India
[9] Shresthad D.P.,Margate D.E.,Anh H.V. and Van Der Meer F.,"Spectral unmixing versus spectral angle mapper for land degradation assessment: a case study in southern spain",17th WCSS,12-21 August 2002,Thailand,Symposium no.52
GIS Development ©