Features - Classes and Objects. K.3.2 [Computers and Education]: Computer and Information. Science Education - Computer Science Education. General ...
CS1 Assessment Using Memory Diagrams Mark A. Holliday and David Luginbuhl Department of Mathematics and Computer Science Western Carolina University Cullowhee, NC 28723
+1 (828) 227-3951 {holliday, drl}@cs.wcu.edu ABSTRACT
Understanding the execution of an object-oriented program can be a challenge for a student starting a CS1 course. We believe that a type of diagram that we call a memory diagram can aid the student in understanding object-oriented programming and can assist the instructor in assessing the student’s understanding. Memory diagrams focus on how, in an abstract sense, the memory of the machine changes as the program executes. Though memory diagrams are a simple idea, by careful use of shape and placement, a number of key points about the meaning of a program fragment can be conveyed visually. We have found a correlation between a student’s ability to construct these diagrams and that student’s comprehension of object-oriented concepts. We feel that this correlation indicates that memory diagrams can be used as an assessment technique that, in turn, can be used to improve student learning.
Categories and Subject Descriptors
these abstractions. The technique we have found most helpful is a diagramming technique that we developed called memory diagrams [7, 8]. A memory diagram represents the state of objects in memory at a particular point in the execution of a program. Thus, a series of memory diagrams illustrates how the state of objects changes during the execution of that code. The fundamental advantage of memory diagrams is that they provide a visual means for someone to describe the object-related effects of each step of the execution of a code fragment. The diagrams afford an alternative to the code itself, to pseudocode, and to textual or verbal descriptions. From the instructor’s perspective, memory diagrams provide an alternative for the instructor to describe the meaning of certain language features and their effect on execution. For students, memory diagrams provide a means for understanding these features, particularly in code they write themselves.
D.1.5 [Programming Techniques]: Object-Oriented Programming D.3.3 [Programming Languages]: Language Constructs and Features - Classes and Objects K.3.2 [Computers and Education]: Computer and Information Science Education - Computer Science Education
Consequently, a substantial component of our course involves students drawing the sequence of memory diagrams representing the execution of a particular code fragment. Sometimes the code fragment is supplied by the instructor, but often it is a code fragment that the student has written. The process of coming up with the sequence of memory diagrams forces the student to more deeply analyze what is happening in the code fragment.
General Terms: Measurement, Languages
Having the student draw the memory diagram not only helps the student directly in learning the object-related concepts, it also aids the instructor in assessment. In particular, the diagrams provide a means of identifying what the student understands by a distinctly different medium than merely examining the code that the student has written. That assessment can then be used to help the student correct specific misunderstandings that have been identified.
Keywords: Computer Science Education; Object-Oriented Programming; Java; CS1; Memory Diagrams; Student Assessment
1. INTRODUCTION
CS1 at our university provides an introduction to object-oriented programming using Java, and assumes no prior programming experience. We take an objects-first approach. We have been successful in developing in a large majority of our students a sound understanding of programming with objects. However, reaching that point has required us to pay careful attention to techniques that can help students develop an ability to work with Permission to make digital or hard copies of all or part of this work for personal or classroom use is granted without fee provided that copies are not made or distributed for profit or commercial advantage and that copies bear this notice and the full citation on the first page. To copy otherwise, or republish, to post on servers or to redistribute to lists, requires prior specific permission and/or a fee. SIGCSE’04, March 3–7, 2004, Norfolk, Virginia, USA. Copyright 2004 ACM 1-58113-798-2/04/0003…$5.00.
This paper addresses the effectiveness of memory diagrams as an assessment technique in a CS1 with an emphasis on understanding object-related concepts. Our diagrams were developed in the context of teaching CS1 using Java, but they could easily be adapted to other object-oriented languages. In section 2, we present a brief introduction to memory diagrams. Section 3 illustrates how memory diagrams can be used in assessment. Section 4 describes an evaluation of the effectiveness of memory diagrams as an assessment technique. In section 5 we review related work. We conclude in Section 6.
2. INTRODUCTION TO MEMORY DIAGRAMS
In a related paper [7] we present memory diagrams in a systematic and detailed manner. The lecture notes for our course use memory diagrams extensively [8]. Due to space constraints we show one
example in this section and outline the key concepts. The idea of memory diagrams is that by careful use of shape and placement, a number of key points about the meaning of a program fragment can be conveyed visually. We assert that a beginning CS1 student learns more effectively if we use different shapes for each type of entity being modeled, thus the diagrams should represent each type of entity with a clearly distinguishable shape. We will use the following code fragment as an example. The students are told that the Dog class has one String field called name and one int field called age. This example is similar to a final exam question we used in a recent semester. Dog spot; // diagram a) spot = new Dog("spot", 3); // right hand side is diagram b) // left hand side and equal sign is diagram c) String spotInfo = spot.toString()); // right hand side is diagram d) // left hand side and equal sign is diagram e) As indicated by the comments in the code the student is expected to draw a series of figures. Requiring a series of memory diagrams is important since it makes clear that the student understands the execution sequence as well as what the final result of the code fragment looks like. Figures 1, 2, and 3 below show the diagrams a-d of the question (diagram e is not shown). Variables, objects, and classes are three key types of entities and each should have shapes as different as possible as an aid for the beginning CS1 student. Our memory diagrams use rectangles for variables, circles for objects, and diamonds for classes. The representation of a class itself in a memory diagram occurs only in the second half of our CS1 course because classes need to be represented only when static fields and static methods are introduced. On a related note, entities that are fundamentally the same should use the same shape as a visual hint to the student that they are the same. In particular, local variables, formal parameters, and fields are all variables. Thus, they are all represented as rectangles. Placement also conveys information. Instance fields and methods are drawn with the object of which they are part. Static fields and methods are drawn with the diamond representing the class. Private fields and methods are shown inside the object circle or class diamond to suggest their inaccessibility from outside. Public fields and methods are on the boundary of the object or class to convey their accessibility from both inside and outside. Diagram a) in Figure 1 displays the rectangle for the reference variable only. This demonstrates that declaring a variable does not create an object nor a reference. Diagram b) in Figure 1 involves creating the instance of the Dog class. The student needs to show: 1) that he understands that the String “spot” is an object referenced by the field name; 2) that name and age are instance fields that are private and therefore inside the Dog object; 3) the difference between a field holding a primitive type value and one holding a reference; and 4) that a reference to the Dog object is created as well as the Dog object. However, note that the reference to the Dog object is not in the variable spot.
spot
spot (a)
Dog age String
3 name
“ spot” (b)
Figure 1: Creation of reference variables and objects Diagram c) in Figure 2 is identical to diagram b) except that the reference to the Dog object has now been assigned to the variable spot. That a reference sometimes exists without being inside a variable is conveyed by such a reference floating freely. To depict that a reference that has been assigned to a variable is really inside the variable, we emphasize that the arrow for such a reference must start on the inside of the reference’s rectangle. This helps to convey the fact that a variable can only hold at most one reference at a time (since the reference is “inside” the rectangle).
spot Dog age String
3 name
“ spot” (c)
Figure 2: Assignment of a value to a reference variable References and method calls are both naturally drawn as arrows but to distinguish between them, straight arrows are references and wavy arrows are method calls. Method calls also have parentheses and inside the parentheses appear any arguments that are being passed (those arguments, in turn, are either references or primitive type values). The method being called is shown as a short straight line. Diagram d) in Figure 3 shows a method call and the effect of the method call. The double arrow points to the object and reference created by the method call. The parentheses in the method call would contain any arguments that are being passed. A key point is that the method call creates a reference as well as a new String object. In fact, that reference is the return value of the method call. Being able to point to that return value reference in the diagram helps make clear what is being returned. Memory diagrams also use visualization to describe the difference between primitive type variables and reference variables, the meaning of pass-by-value semantics, the meaning of the this reserved word, that multiple objects of the same class can exist and each have their own copies of instance fields and methods, that variables have names but objects do not, that multiple variables may reference the same object, and that a reference variable sometimes does not hold a reference at all (in which case it holds the special value “null”) [7, 8].
spot Dog age String
toString
Clearly, much is happening in the execution of the right-hand side of the second statement. Of the mistakes listed above, the most common are (1) not drawing a separate String object for “ spot” , and (2) not showing the fields name and age inside the Dog object. Both mistakes indicate a lack of understanding of when something is an object and how fields relate to objects.
String
Diagram c), representing assignment, involves placing the reference to the Dog object inside the rectangle for the variable named spot. The typical mistake is for the student to have already done this as part of diagram b). This indicates that the student does not understand how the assignment operator causes the return value from the constructor call to be assigned.
()
3 name
“ spot” (d)
“ (Dog: name= “ spot” ; age=3)” Figure 3: Method invocation resulting in new object Memory diagrams help the student to understand how arrays are implemented in Java. In particular, multidimensional arrays are arrays of arrays. The diagrams make this clear with a circle representing the Array object for the first dimension (the column) as well as a circle for each Array object representing a row. Each circle (object) has its own length field which makes clear why ragged arrays are possible [7, 8].
3. USING DIAGRAMS TO MEASURE STUDENT COMPREHENSION One of the advantages of memory diagrams is that they help precisely identify which programming concept a student is having trouble with within a program fragment. We use the Dog class example code fragment in Section 2 to illustrate how memory diagrams can be used to measure student comprehension. Diagram a) of the Dog example should display merely the rectangle for the reference variable. The problem is that students often think that the Dog object is also created by such a declaration. This is a fundamental misunderstanding on the students’ part that memory diagrams help us to detect. We are not aware of another technique that so quickly and simply identifies such a misunderstanding. Diagram b) involves creating the instance of the Dog class, indicating that it has two fields: name, which is a reference variable pointing to a String object whose value is "spot", and age, a primitive type variable that contains the integer value 3. Diagram b) also shows the creation of a reference to the Dog object. There are several common misunderstandings that can be detected by having students draw this diagram. One is neglecting to realize the creation of the reference (the arrow) to the Dog object. A second common misconception is prematurely assigning to the variable spot the reference to the Dog object (which should be shown in diagram c)). A third mistake is failing to put rectangles in the Dog object for the name field and the age field (recall that a field is represented by a rectangle, since a field is a variable). A fourth common error is forgetting that a String, "spot", is an instance of a String object, which means that a circle for that String object must be created and a reference to that String object must be placed inside the name field of the Dog object. A fifth common error is forgetting that the age field holds the value 3 inside the variable instead of holding a reference to a value 3 that is somewhere else.
Diagram d) is a method call that creates an object and returns a reference. One misunderstanding is not realizing that a method is associated with an object and, if public, is on the boundary of the object' s circle. A second error is not realizing that a new String object is created, and furthermore, that a new reference to that object is created. Examining the diagram allows the instructor to assess whether the student has conquered the object-oriented concepts related to these errors.
4. EVALUATION OF ASSESSMENT EFFECTIVENESS
Our most common form of assessment using memory diagrams is informally through class interaction. Much of the time in the regular class sessions is spent doing in-class group exercises. As each group demonstrates its work, students are often asked to draw the memory diagrams associated with their solution to the exercise. Similarly, during the weekly closed lab sessions, we often ask students to demonstrate their understanding of the lab by diagramming part of their solution. However, since we do not maintain records on those interactions we can not evaluate the effectiveness of memory diagrams during this informal assessment. To evaluate assessment effectiveness we conducted two studies using questions on examinations normally given in the course of a semester. The first study examined how well a student’s ability to draw the memory diagrams for a program fragment as a test question was an indicator of the student’s performance on the rest of that test. The second study looked at how well a student’s ability to draw the memory diagrams for a program fragment as a test question was an indicator of the student’s performance on the course overall. For both studies we examined three separate test questions from two separate CS1 classes. We will refer to these as Experiments 1 through III. Experiment I involved one section of our introductory programming course that at the time of the experiment had 13 students. The test question involved the following code fragment Dog spot; spot = new Dog(“spot”); System.out.println(spot.toString()); Experiments II and III involved a different section of that same introductory programming course that at the time of the experiments had 14 and 13 students, respectively. The second test question was
String name = “John”; // diagram a String state = “North Carolina”; // diagram b name = name.concat(“Smith”); // diagram c state = state.substring(6, 11); // diagram d
The alternative hypothesis is: Ha: A student doing well on the memory diagram question does have a positive correlation with that student doing well on the rest of the test.
and the third test question was
The null and alternative hypotheses for the second study were similar except that the comparison was with the student’ s score for the entire course.
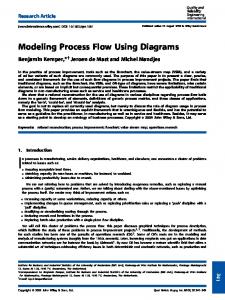
Dog fido = new Dog(“setter”); Dog anyDog = fido; String dogInfo = fido.toString(); The sections were taught by different instructors. Both instructors followed the same syllabus and both used memory diagrams throughout the course. All three tests were in-class and included approximately eight questions including the memory diagram question. The tests were closed-book except for one question (worth 30% of the test) that was open-book, done on the computer, and completed after the rest of the test had been submitted. As an example, Figure 4 shows the data for Experiment III from both studies. In other words, Figure 4 shows for each student in one of the sections the normalized scores for the memory diagram test question, the rest of the test, and the course. The students are listed in the order of their scores on the memory diagram test question. Experiment Three for Both Studies
For both studies the statistical test for each experiment used the Pearson product moment correlation coefficient as the test statistic [9]. The value of the Pearson coefficient ranges from -1.0 to 1.0 and reflects the extent of a linear relationship between two data sets. The closer the value is to 1.0 the more a positive correlation exists. Given that the alternative hypothesis is for a positive correlation, an upper-tail rejection region, RR = {z > za}, was used. The first row of values in Table 1 contains the values for the correlation test statistic for the six experiments. The question is whether for each experiment the value of the test statistic for that experiment causes us to reject the null hypothesis and thus, conclude that a positive correlation exists. Clearly this depends on the size of the rejection region which in turn depends on the value chosen for ��7KH�YDOXH� �LV�WKH�SUREDELOLW\�RI�D�7\SH�,�HUURU�DQG� is called the significance level. A Type I error is made if the null hypothesis is rejected when in fact the null hypothesis is true. Table 1: Correlations and P-values (attained significance level).
1.2 1 0.8
Question
0.6
Rest of Test Course
0.4 0.2 0 1
2
3
4
5
6
7
8
9
10 11 12 13
Figure 4: Experiment III scores for the memory diagram question, the rest of that test, and for the course as a whole. As shown in Figure 4 in Experiment III the mean values of the scores for the memory diagram questions are significantly lower than the overall test mean scores. This property was also observed in Experiments I and II. This indicates that the students find diagramming relatively difficult. This is consistent with the conclusion that being able to correctly draw memory diagrams requires the student to have a deep understanding of what is happening in a code fragment. It is possible for a student with a partial understanding to be able write correct code without completely understanding the code. This is an advantage of memory diagrams in that it alerts the instructor and the student when the understanding is adequate for most measurement techniques but is not complete. In the first study there were three statistical tests, one for each experiment. For those statistical tests the null hypothesis was: H0: A student doing well on the memory diagram question does not have a positive correlation with that student doing well on the rest of the test.
Study One Experiments Study Two Experiments I II III I II III Correlation .538 .781 .782 .534 .900 .632 p-value 0.025 < ��� ��� 0.025 < ����������� ��� ������� 0.005 0.005 ������� 0.005< 0.025 ,QVWHDG� RI� FKRRVLQJ� DQ� DUELWUDU\� YDOXH� IRU� � ZH report what is called the p-value or the attained significance level. The p-value is WKH�VPDOOHVW�OHYHO�RI�VLJQLILFDQFH�� ��IRU�ZKLFK�WKH�REVHUYHG�GDWD� indicates that the null hypothesis should be rejected. The second row of values in Table 2 contains these p-values. Rather than precise p-values we present ranges [9]. These p-values clearly indicate that the null hypothesis should be rejected in all six experiments. In all the experiments the p-value is less than the common guideline of 0.05. In fact for three of the cases, the p-value is even less than 0.005. Thus, the alternative hypothesis that a positive correlation exists is accepted. The correlation results indicate that how well students can draw memory diagrams does correlate with how well they understand the course material as measured by the score on the rest of the test and as measured by the score for the course. Thus, whether a student is able to draw memory diagrams correctly appears to be an indicator that an instructor can use to predict the student' s understanding of the programming concepts in general. Correlation does not imply causality. We have not shown that understanding memory diagrams causes students to do better in overall programming understanding. A more detailed, formal study would need to be conducted to answer that question.
5. RELATED WORK
Our paper introducing memory diagrams contains a detailed review of work related to the topic of memory diagrams. There we contrast them to algorithm animations [10, 13] and program
visualization tools [2, 5]. Neither of those is a diagrammatic technique for visually representing the differences in language features that occur in a program fragment. We also contrast memory diagrams with Unified Modeling Language (UML) class diagrams. More closely related are other diagramming techniques that involve the state of memory and are intended for introductory programming courses. One example is the diagramming of linked lists using ovals for the nodes and arrows for the pointers [3]. Another is state-of-memory diagrams [14]. The previous work has tended not to develop this approach very extensively. In contrast we feel that using diagramming techniques including shape and placement can be used to convey a wide-range of language features and precisely describe what is happening in a code fragment using an alternative modality. Moreover, in contrast to previous uses of diagramming in introductory programming courses, we have investigated how the diagrams can be used by students as well as by the instructor and consequently can be used for assessment of student comprehension. With respect to assessment in the introductory programming courses, much of the literature has addressed automating assessment [12]. But there does not appear to be much research into having students create abstract representations in order to assess comprehension of object-oriented programming concepts. [1] is an assessment of the correlation of student success in different types of student work (such as, closed labs versus tests). [6] is an evaluation of the effectiveness of a diagramming technique in improving program comprehensibility. However, the diagrams they consider reflect control structure, not objectoriented language features. Finally, the effectiveness of visual representations in helping to understand text has also been studied in fields other than computer science [4]
6. SUMMARY
The level of abstraction present at the start of a CS1 course teaching an object-oriented language in an objects early approach can prove to be a challenge for many students. Our experience is that if the students can diagram what is happening in memory as a fragment of object-oriented code executes, they can more easily and more deeply understand the meaning of that program fragment. Such memory diagrams represent memory in an abstract sense. By use of different shapes for different entities and by careful use of placement the student can employ the diagrams to visualize a significant amount of the meaning of the effect of the execution of a program fragment. In this paper we evaluate how well having students construct these diagrams can serve as an assessment tool. The memory diagram test questions that we have examined indicate that there is a correlation between how well students construct these diagrams and how well they perform on the rest of the test and in the course as a whole. This study could be extended in several ways. For example, one could develop test questions that require a student to both write a code fragment or small program and to draw the memory diagrams for some of the statements. Such questions would allow us to examine the correlation between correct memory diagrams and level of understanding of the specific programming concept that the diagram is representing. This is in contrast to the
correlation between correct memory diagrams and the level of more general programming understanding (as reflected in an overall test score). Another subject requiring further study is causality. To what extent does learning to construct correct diagrams cause a student to have a better understanding of the corresponding programming concept? Such a study probably would require dividing the students into two groups with one of the groups not being taught memory diagrams and then comparing their success in understanding the programming concept to that of the second group of students.
7. REFERENCES
[1] Chamillard, A.T. And Braun, Kim A., Evaluating Programming Ability in an Introductory Computer Science Course, Proc. of SIGCSE 2000, pp. 212-216. [2] Dershem, H.L. And Vanderhyde, J., Java Class Visualization for Teaching Object-Oriented Concepts, Proc. of SIGCSE 1998, pp. 53-57. [3] Dershem, H. and McFall, R., Animation of Java Linked Lists, Proc. of SIGCSE 2002, pp. 53-57. [4] Goolkasian, Paula, Picture-Word Differences in a Sentence Verification Task, Memory & Cognition, 1996, 24, pp. 584594. [5] Haddad, H. Curtis, E. and Brage, J. Visual Illustration of Object-Orientation: A Tool for Teaching Object-Oriented Concepts, The Journal of Computing in Small Colleges, 12, 2, (Nov. 1996), 83-93. [6] Hendrix, T. Dean, McKinney, Matthew, Maghsoodloo, Saeed, and Cross, James, Do Visualizations Improve Program Comprehensibilty? Experiments with Control Structure Diagrams for Java, Proc. of SIGCSE 2000, pp. 382-386. [7] Holliday, M. and Luginbuhl, D., Using Memory Diagrams When Teaching a Java-Based CS1, Proc. of the 41st Annual ACM Southeast Conference, pages 376-381, Savannah, GA, March 2003. [8] Holliday, M., “ Introducing Java Visually” , http://cs.wcu.edu/~holliday/LectureNotes/150/, 2002. [9] Mendenhall, W., Wackerly, D.D. and Schaeffer, R.L., Mathematical Statistics with Applications, Sixth Edition, Duxbury Publishing, 2001. [10] Naps, T.L., Eagan, J.R., Norton, L.L., JHAVÉ--An Environment to Actively Engage Students in Web-based Algorithm Visualizations, Proc. of SIGCSE 2000, pp. 109113. [11] Riley, D. The Object of Java, Addison Wesley, 2002. [12] Satratzemi, R., Dagdilelis, V., and Evagelidis, G. A System for Program Visualization and Problem-Solving Path Assessment of Novice Programmers. Proc. of ITiCSE 2001, pp. 137-140. [13] Stern, L. and Naish, L., Visual Representations for Recursive Algorithms, Proc. of SIGCSE 2002, pp. 196-200. [14] Wu, C. T. An Introduction to Object-Oriented Programming with Java, McGraw-Hill, 2001.