Localization and tracking of objects is a fundamental component of robotics. ... Over the last decade, there has been an abundance of research in computer vision algorithms as well ... data from the Kinect and a MATLAB script, the average RGB values of the color of .... We did commit each one to version control so we can.
CS231A: Project Final Report Object Localization and Tracking using Microsoft Kinect Gerald Brantner Laura Stelzner Martina Troesch •
Abstract Localization and tracking of objects is a fundamental component of robotics. In order to effectively interact with its environment and manipulate objects, a robot must be able to classify and distinguish between multiple objects and the environment, determine the position as well as orientation of these objects, and update these states in real-time. This project uses Microsoft’s Kinect sensor and the Scaling Series algorithm to achieve these goals. The algorithm that was developed for this project was able to accurately perform planar tracking (2 linear positions plus orientation) of a triangle that was segmented by color.
1
Introduction
In order to allow robots to operate in unstructured environments, it is essential to successfully detect, localize, and track objects. Localizing an object consists of determining its position and orientation in 3D space. We will refer to this problem as object state estimation going forward. Beyond detecting obstacles for manipulation and building environmental maps for navigation, a robot has to be able to update these models and abstractions in real-time. In particular for manipulation tasks, the robot has to simultaneously identify, localize, and track multiple objects. Current state of the art research robots [1–3] are equipped with a variety of sensors allowing them to interact with their surroundings. The most important of which are based on computer vision. Over the last decade, there has been an abundance of research in computer vision algorithms as well as hardware. In particular, Microsoft’s Kinect sensor has grown in popularity within the robotics community because it is relatively cheap and yet accurate [4]. In this project, we use the Kinect sensor and the Scaling Series algorithm, which together allow for real-time object recognition and tracking.
2 2.1
Methodology Previous Work
Segmentation Algorithms Common segmentation algorithms include histogram thresholding, edge detection, and K-means clustering [5]. Most segmentation algorithms rely on object features, such as edges and flat faces.
1
State Estimation Algorithms State estimation is the determination of an objects position and orientation. As the dimensionality of the problem increases, the number of discrete states increases meaning that exhaustive search algorithms treating every possible state are prohibitively slow. One promising approach is based on Scaling Series, as described in [4]. This algorithm was developed in the context of tactile perception, where a robotic sensor detects collision points with objects and computes the most likely states based on particle filters with annealing.
2.2
Our Method
We collected data using the Kinect, which captured a point cloud consisting of the object of interest as well as the surrounding environment. To separate the point cloud into object and environment, we need to apply a segmentation algorithm. Most segmentation algorithms were developed for static images and therefore are less applicable to real-time tracking. For this reason and because of the fact that we want this system to apply to any arbitrary object shape, we choose to segment based on color and represent the objects as triangular meshes. Finally, we applied the Scaling Series algorithm to estimate the objects state.
3 3.1
Technical Details Technical Summary
We collected data using a Microsoft Kinect, segmented based on color and clustering, and estimated the objects state using the Scaling Series algorithm.
3.2
Technical Approach
Data Collection The Kinect was chosen for this project because it is relatively cheap and accessible. Due to its growing popularity within the robotics community there are many resources available, including open source SDKs. The Point Cloud Library (PCL), provides a means for efficient interaction with the point cloud returned from the sensor [6]. For this reason and because we aimed at real-time capability, we developed in C++. The Kinect provides data at 30 frames per second, allowing us to update state estimations in real time with the current point clouds. Segmentation Color segmentation using data from the Kinect was used to separate the object from the environment. This was done by filtering out all the colors in the environment besides those within a specific range of the color of the object and then filtering any outliers that were left over. The first step in this process was to determine the average color of the object. Using an image of the point cloud of the data from the Kinect and a MATLAB script, the average RGB values of the color of the object were found. These values were then transformed into CIE76 color space in order to use a simple metric for determining the distance between colors [7]. Any points in the point cloud, transformed into the CIE76 space, that were not within a range of the average were removed from the point cloud. Finally, any remaining outliers were removed using a distance metric. An important aspect of segmentation by color is the selection of an appropriate color for the object. Experimentation with the different 2
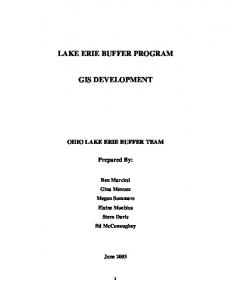
colors revealed that it was best to choose a color that does not have a mixture of RGB colors that are similar to the environment. For example, when experimenting with the color brown and red, it was found that skin tones and wooden tables were also segmented as well. Since the ultimate goal would be to hold an object and perform localization and tracking, any color near skin tone would not be an ideal choice for segmentation. After discussions with colleagues with experience in color segmentation, the color green was chosen for the object. In addition to the challenges of choosing an appropriate color, illumination and reflection affect the efficacy of segmentation by color. Depending on the orientation of the object, some planes can become quite reflective which results in a washed out color. This color can be outside the threshold value for the color filtering so those points get removed. Calibration was performed based on the setup to try to mitigate these effects. State Estimation The ultimate goal of this project was to detect and localize an object in 6 Degrees Of Freedom (DOF) (3 DOF for position and 3 DOF for orientation). Because of the high dimensionality of this problem, an exhaustive search of state space is not an option for real-time applications. The Scaling Series algorithm uses particle filtering with annealing and has been shown to function in real-time, in the context of tactile applications [4]. It determines the most likely state of an object given measurements of the objects position. We first implemented the algorithm for the case of 2 DOF (planar translation). Once it was tested and debugged in 2 DOF it was expanded to 3 DOF (planar translation and rotation). The input to the algorithm is a representation of the object of interest. This could either be in the shape of a point cloud or an analytic representation, such as the intersection of half-spaces. The algorithm begins with the specification of an initial search space, encompassing all dimensions of the state space. This forms a hyperellipsoid where the radii indicate the search boundary for each dimension. Each iteration samples a pre-defined number of random particles from the search region. Each particle represents a state and has associated new search spaces surrounding them. It then computes the weights of these particles by transforming the object according to the particle parameters, representing hypotheses of the objects true state. Initially, the weights were calculated using the Mahalonobis distance between the transformed object represented as a set of points and the closest measured points. This, however, involved the computation of all distances between every point of measurement and all points representing the object itself. To optimize the run time, we changed the objects representation from a point cloud to an expression using the intersection of halfspaces. This representation allowed us to compute the minimum-distance metric using an analytic expression. In order to avoid an exponential growth of the number of particles, eliminated a sub-set by pruning particles that had weights lower than 40% of the max-weight. The remaining particles were then used as the basis for the next search region, such that the new region is the union of the search-spaces centered at the particles with radii reduced by a zoom factor from the radii of the previous iteration. Figure 1 shows a schematic of this process for 3 DOF.
3
Figure 1: Schematic of the Scaling Series algorithm.
Expanding to 6 Degrees of Freedom We continued to expand the algorithm to 6D, which complicates the algorithm due to the increased dimensions of the hyper-ellipsoids representing the search region for the states particularly with regard to the different dimensions representing the orientation of the object. There were many complexities and challenges to consider due to the representation of spatial rotation, including redundancies, singularities, uniform sampling, and choosing a distance metric between 3D rotations. There are many ways to represent 3D rotations and each representation has benefits and drawbacks. Each added degree of freedom increases the search space, therefore a rotational representation using three parameters instead of four is essential to preserving the speed of the algorithm. However, representations with three parameters have singularities and redundancies which complicate the discretization of the search space. Perhaps the most difficult aspect of searching in three rotational dimensions is that it is difficult to find a metric to compare 3D rotations. The solution is not a simple euclidian distance between each of the three angle parameters like it is the case for the linear distances, because two rotations with distant parameters can actually represent similar orientations. [8] illustrates different metrics for determining if two 3D rotations are similar. Even with such a metric it is still very difficult to discretize the rotation-space in uniform regions. Currently, we are in the process of
4
evaluating the various representations and metrics. 3.2.1
Integration
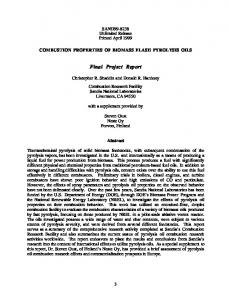
With segmentation and the scaling series working independently, the next step was to integrate the two. As an intermediate step, we generated artificial measurements and stored them in a dummy PCL point cloud. This allowed us to validate the algorithm by comparing the output to a known solution. Our first test case was a simple triangle. To determine its dimensions, we took a static image with the Kinect and stored it within a PCD file. Next, we imported it into MATLAB, and plotted the XY points. Figure 2 was our result, and we were able estimate the three vertices as (0, 0), (0.2, 0) and (0.2, 0.1). This allowed us to check that we could achieve real time tracking, and were getting accurate results since we could specify exactly which state the triangle was translated to. Next we replaced the artificial measurements with actual online data from the Kinect – the point cloud after applying the segmentation algorithm on the raw data.
Figure 2: MATLAB representation of the triangular object from point cloud data.
4
Experimentation and Results
Experiments We ran multiple experiments throughout this project to validate one step of the data pipeline at a time. Segmentation We visually checked the point cloud in a viewer to determine the segmentation. We experimented with different colored objects, different lighting conditions, different distances between camera and object, as well as different angles to vary reflections. Scaling Series To test our Scaling Series algorithm we started by defining a simulated triangles points and its expected state. We then checked how accurately the results compared to the expected result.
5
Integrated System First we tested the integrated system using a manufactured triangle point cloud. Next, to test our integrated setup with a live Kinect feed, the Kinect was mounted onto a metal frame roughly 1.2m above the ground, as illustrated in Figure 3 and Figure 4. The object was a piece of paper with a triangle outlined in green. With this setup, we manually moved the triangle and confirmed that it is tracked accurately.
Figure 3: Side view of the experimentation setup.
Figure 4: Top view of the experimentation setup.
6
Results Segmentation Figure 5 shows the the result of filtering with respect to brown color. The box is visible in the center of the image, but so is a substantial amount of noise from the back ground. After calibrating the color of the triangle to the lighting of the room and height of the Kinect we achieved segmentation results shown in Figure 6.
Figure 5: Resulting point cloud filtering on the color brown.
Figure 6: Resulting point cloud filtering on the color green.
7
Scaling Series We ran the 3DOF Scaling Series algorithm 1000 times, choosing a random initial state. We then calculated the relative error of each parameter (estimated value - actual value)/actual value. We summed these up and took the average to receive the following results: Parameter x y θ
Average % error 3.47 4.89 5.56
Integrated Algorithm We setup a viewer to display our point clouds in real time. Figure 7 depicts the results using the dummy triangle. The green dots represent the simulated measurements and the red dot represents the estimated state (the vertices of the triangle). Due to time constraints we ran our experiments on our integrated application in 2D and 3 DOF (planar translation with rotation). Some results of state estimation with 3 DOF are shown in Figure 8 and Figure 9. The states were updated during tracking as the object was moved around. The algorithm was able to update the states in real time.
Figure 7: Dummy triangle point cloud with resulting position prediction indicated with a red point.
Figure 8: Resulting prediction using live feed from the Kinect at one location.
8
Figure 9: Resulting prediction using live feed from the Kinect an another location.
Next Steps Throughout the project we expanded the dimensionality of the scaling series algorithm. We started with 2D translation and later expanded 2D with rotation (3DOF), and 3D position with 3D rotation (6 DOF). We are in the process of fully debugging and integrate the segmentation algorithm with each version of the scaling series algorithm. We did commit each one to version control so we can continue to debug, test and optimize the algorithms for the different dimensionalities and scenarios. We believe that the performance can be improved significantly by tuning the parameters of the Scaling Series algorithm (final discretization resolution, initial search region, number of new particles per search-space).
5
Conclusion
The most challenging part of this project was the implementation of the algorithm performing state estimation. This project shows that the scaling series algorithm works for tracking a planar object in real-time. It has the potential to be expanded to higher dimensions and continue to provide high frequency estimates. The algorithm is independent of the segmentation method, allowing others to be substituted in depending on the properties of the object you want to track. This algorithm could be ported to a robots vision system to allow for real-time manipulation and navigation tasks.
Acknowledgements We gratefully acknowledge David Held, Silvio Savarese, and Anya Petrovskaya for providing support and advice throughout this project.
9
References [1] Joel Chestnutt, Manfred Lau, German Cheung, James Kuffner, Jessica Hodgins, and Takeo Kanade. Footstep planning for the honda asimo humanoid. In Robotics and Automation, 2005. ICRA 2005. Proceedings of the 2005 IEEE International Conference on, pages 629–634. IEEE, 2005. [2] Atlas Robot boston dynamics. http://www.bostondynamics.com/robot_Atlas.html. Accessed: 2014-02-12. [3] Prashanta Gyawali and Jeff McGough. Simulation of detecting and climbing a ladder for a humanoid robot. In Electro/Information Technology (EIT), 2013 IEEE International Conference on, pages 1–6. IEEE, 2013. [4] Anna V Petrovskaya. Towards dependable robotic perception. Stanford University, 2011. [5] Carlos Hern´ andez Matas. Active 3d scene segmentation using kinect. 2011. [6] Radu Bogdan Rusu and Steve Cousins. 3d is here: Point cloud library (pcl). In Robotics and Automation (ICRA), 2011 IEEE International Conference on, pages 1–4. IEEE, 2011. [7] Jos´ e-Juan Hern´ andez-L´ opez, Ana-Linnet Quintanilla-Olvera, Jos´ e-Luis L´ opez-Ram´ırez, Francisco-Javier Rangel-Butanda, MarioAlberto Ibarra-Manzano, and Dora-Luz Almanza-Ojeda. Detecting objects using color and depth segmentation with kinect sensor. Procedia Technology, 3:196–204, 2012. [8] Du Q Huynh. Metrics for 3d rotations: Comparison and analysis. Journal of Mathematical Imaging and Vision, 35(2):155–164, 2009. [9] A. Petrovskaya and O. Khatib. Global localization of objects via touch. IEEE Trans. on Robotics, 27(3):569–585, June 2011. [10] Anna Petrovskaya, Oussama Khatib, Sebastian Thrun, and Andrew Y Ng. Bayesian estimation for autonomous object manipulation based on tactile sensors. In Robotics and Automation, 2006. ICRA 2006. Proceedings 2006 IEEE International Conference on, pages 707–714. IEEE, 2006.
10