CHINESE JOURNAL OF GEOPHYSICS Vol.58, No.5, 2015, pp: 486–495
CURVELET-BASED 3D RECONSTRUCTION OF DIGITAL CORES USING THE POCS METHOD WANG Ben-Feng1,2 , LI Jing-Ye1,2∗ , CHEN Xiao-Hong1,2 , CAO Jing-Jie3 1 State Key Laboratory of Petroleum Resources and Prospecting, China University of Petroleum, Beijing 102249, China 2 CNPC Key Laboratory of Geophysical Prospecting, China University of Petroleum, Beijing 102249, China 3 Shijiazhuang University of Economics, Shijiazhuang 050031, China
Abstract With the development of shale-gas exploration and exploitation, exploitation is necessary to study the 3D spatial distribution of shale fractures for research on shale rock physics. Because of the limitation of instruments, accurate shale slice is discontinuous in depth, and the minimum interval between adjacent slices is inconsistent with horizontal resolution of digital cores. Those are the main factors which can prevent accuracy improvement of fracture characterization and physical modeling for digital cores. In order to study the 3D spatial distribution of fractures, this paper achieves reconstruction of 3D digital cores using the curvelet transform and Project Onto Convex Sets (POCS) method. Firstly, sample one per two slices in depth regularly for 3D dataset of sandstone obtained by X ray scanner, then reconstruct the 3D dataset using the proposed method. The reconstructed result is consistent with the original one and superior over the current method (spgl1), which approves the validity and superiority of the proposed method. Secondly, double the accurate 2D shale slices in depth that are obtained using focused ion beam scanning electron microscopy (FIB-SEM). It generates the 3D digital cores in which the minimum interval between adjacent slices in depth is basically consistent with the horizontal resolution, weakens the discontinuity of shale slices in depth caused by the instrument limitations and makes the fracture distribution more clear. Tests on sandstone and accurate shale rocks demonstrate the validity and superiority of the proposed method. Key words Curvelet transform; Projection Onto Convex Sets (POCS); 3D digital cores; Shale; Reconstruction
1 INTRODUCTION With the development of exploration, it becomes more and more difficult. In recent years, research on shale-gas has become a hot topic in the unconventional energy area. However, shale-gas exploration and exploitation is a great challenge because the shale-gas is mainly enriched in shale, which has low porosity and permeability. Therefore, it is essential for shale-gas exploration and exploitation to study the fine distribution of shale fractures. 3D digital core techniques, which can characterize the micro-structure of rocks in the pore scale, can help study the fine spatial distribution of shale. Yao et al. (2005) gave a summation for current digital core studies and pointed out the shortcomings of current methods: process-based methods can’t simulate complicated sedimentary system and stochastic-based methods cannot construct digital cores with large range conductivity. He also discussed the applications of digital cores in percolation mechanisms, simulation of core displacement, and evaluation of the effects of flooding agent. There are mainly two categories of the methods for 3D digital core reconstruction: X-ray micro computed tomography (CT) scanning and reconstructing from 2D images. There are mainly two methods to reconstruct 3D digital cores based on 2D images: process-based method and stochastic-based method (Øren et al., 2002; Okabe et al., 2004; Liu et al., 2009a, b, 2013). Liu et al. (2013) compared the performances of different approaches for 3D digital core reconstruction based on sandstone and gave the prospects of the development of 3D digital cores. He also pointed out the accuracy limitation of X-ray micro computed tomography (CT) scanning and the high precision advantage of focused ion beam scanning electron microscopy (FIB-SEM). Although two-phase porous medium composed of matrix and E-mail:
[email protected] *Corresponding author:
[email protected]
Wang B F et al.: Curvelet-Based 3D Reconstruction of Digital Cores Using the POCS Method
487
pore can construct the fracture distribution of 3D digital cores with high resolution, it neglects the strength of fractures which will affect the performance of subsequent interpretation finally. X-ray method can obtain 3D digital cores, while its resolution and characterization for fracture spatial distribution are too coarse to meet the accurate imaging in nano-micron meter scale for shale fractures. FIB-SEM can achieve accurate imaging in nano-micron meter scale for shale fractures. But it has difficulty in guaranteeing consistency between minimum interval between adjacent slices and horizontal resolution of the digital cores, affecting accuracy improvement of data processing and related simulation analysis for the shale digital cores. With the development of shale-gas exploration and effective exploitation, it is essential to give accurate imaging of vertical distribution of shale fractures. Therefore, it is essentially necessary to reconstruct the 3D digital cores accurately with 2D shale slices obtained by FIB-SEM. The structure of shale fractures is complicated and the traditional reconstruction methods are hard to meet the accuracy of the 3D reconstruction. Curvelet transform is a new sparse transform, which belongs to the category of multi-scale mathematical transform. Compared with wavelet transform, it has directivity and is more suitable for curve singularity characterization. Besides, it has been successfully used in image denoising (Candes, 2001; Starck et al., 2002), image reconstruction (Starck et al., 2001), seismic data denoising (Neelamani et al., 2008), seismic data reconstruction (Hennenfent et al., 2008; Herrmann et al., 2008; Naghizadeh et al., 2010; Cao et al, 2012) and multiple elimination (Herrmann et al., 2007). Projection Onto Convex Sets (POCS) method was first proposed by Bregman (1965, 1967), being used in image reconstruction (Youla et al., 1982; Stark et al., 1989). Abma and Kabir (2006) introduced the POCS method into irregular seismic data reconstruction. Since then, computation cost and threshold selection have been studied by many authors to improve the convergence and reconstruction accuracy (Gao et al., 2010, 2012; Yang et al., 2012; Zhang et al., 2013). Because of the complicated structure of shale fractures, the advantages of the POCS method and the sparse curvelet transform are combined to obtain the 3D digital cores with highly accurate 2D shale slices obtained by FIB-SEM. Reconstruction analysis indicates that vertical spatial distribution of fracture is more continuous which laid the foundation for accuracy improvement for subsequent data processing and related simulations of shale digital cores. In order to verify the validity of the proposed method, firstly, we test the 3D sandstone digital cores obtained by X-ray scanner and analyze the similarity and differences before and after the reconstruction; then, the proposed method is used for the 3D reconstruction with nano-micron scale shale slices obtained by FIB-SEM to make the vertical spatial distribution of fractures more continuous. Numerical tests on sandstone and shale demonstrate the validity of the proposed method. 2 THEORY 2.1 Curvelet Transform Curvelet transform, which has angular parameters as compared with wavelet transform, is more suitable for curve singularity characterization and proper to describe the complicated fracture structure of shale. Curvelet transform evolved from ridgelet transform, the first and the second generation of curvelet transform. Currently, the commonly used curvelet transform is the second generation (Candes et al., 2006). The mathematical formula can be expressed as follows Z c(j, l, k) = hf, ϕj,l,k i =
f (x)ϕj,l,k (x)dx,
(1)
R2
where f is original signal, ϕ is curvelet basis, ϕ is the conjugate function of ϕ and j, l, k represent scale, angle and position parameters, respectively. 2.2 Projection Onto Convex Sets (POCS) Method Due to the limitation of equipments, the nano-scale 2D slices of shale obtained by FIB-SEM are discontinuous in depth and there is a certain gap between adjacent slices. In order to satisfy the accuracy requirement of data processing and related simulation analysis for the shale digital cores, it is necessary to regard it as an
488
Chinese J. Geophys.
Vol.58, No.5
image reconstruction problem. Each vertical slice of the 3D dataset is processed, and the formula is shown as follows. dobs = Rd0 , (2) where dobs is a vertical slice of the 3D dataset composed by discontinuous rock slices, R is the sampling matrix and d0 is the vertical slice of the 3D dataset after reconstruction. Based on the compressive sensing theory, with sparse transform and sparse promotion strategy, we can obtain the reconstructed image, which is the vertical slice of the 3D dataset after reconstruction. Curvelet transform is a multi-scale and multi-directional sparse transform, therefore assuming d0 is sparse in the curvelet domain and sparse promotion strategy can be used more suitably to get the reconstructed vertical slices of rocks. It is an ill-posed problem to solve Eq.(2), and the unconstrained functional is constructed as shown in Eq.(2) with sparse promotion strategy, considering the sparsity of d0 in the curvelet domain, Φ(x) = kdobs − RC T xk22 + µP (x),
(3)
where x is the curvelet coefficient vector, C is the curvelet transform, C T represents the inverse curvelet transform, P (x) is a sparse constraint and µ is the regularization factor. Then the reconstruction formula for a vertical slice of rock is derived based on the curvelet transform and the POCS method, dk = dobs + (I − R)C T Tλk (CD k−1 ),
(4)
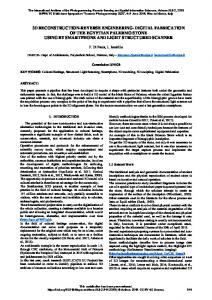
where dk is the kth iterative solution, Tλk is a threshold function and λk is the threshold determined by an exponential threshold model, shown in Eq.(5), τek = τmax ec(k−1)/(N −1) , c = ln(τmin /τmax ), k = 1, 2, · · · , N. (5) Blumensath and Davies (2008, 2009) and Loris (2010) pointed out that Tλk is the soft threshold function, subjecting to Eq.(6) when P (x) = kxk1 , x − λk , xi > λk i Tλk (xi ) = 0, |xi | ≤ λk (6) xi + λk , xi < −λk , where λk = 0.5µ is the threshold and xi is the ith component of coefficient vector x. Tλk is the hard threshold function, subjecting to Eq.(7) when P (x) = kxk0 , ( xi , |xi | ≥ λk Tλk (xi ) (7) 0, |xi | < λk , √ where λk = µ is the threshold and xi is the ith component of coefficient vector x. With the L0 norm constraint to solve Eq.(3), rock vertical slices doubled in depth can be obtained. Then, the 3D dataset with slices doubled in depth can be obtained after the reconstruction of each vertical slice. Fig. 1 shows the flow chart of 3D digital core reconstruction with the POCS method in the curvelet domain.
Fig. 1 Flow chart of the 3D digital core reconstruction with the POCS method in the curvelet domain
Wang B F et al.: Curvelet-Based 3D Reconstruction of Digital Cores Using the POCS Method
489
3 NUMERICAL EXAMPLES First, test and analyze the 3D sandstone data obtained by X-ray scanning which demonstrates the validity of the proposed method. Sample one slice per two slices in depth regularly for the 3D sandstone data obtained by X-ray scanning, reconstruct each vertical slice with the proposed method and the popular spgl1 method (Van Den Berg et al., 2008). Compare the reconstructed vertical slices and the original complete vertical slice, and analyze the performances of different reconstruction methods, the result indicates that the proposed method is more superior. Then the 3D digital core of shale is achieved from the nano-scale 2D shale slices obtained by FIB-SEM using the proposed method, and the vertical continuity and spatial distribution of shale fractures are compared between before and after reconstruction to demonstrate the validity of the proposed method. 3.1 Sandstone Currently, the accuracy of X-ray scanning cannot meet the fine description of spatial distribution of shale fractures because the shale fractures are always in nano-micron scale. While X-ray scanning can provide the whole 3D dataset of sandstone. The horizontal and vertical slices of sandstone dataset obtained by X-ray scanning are shown in Fig. 2, from which we can observe the sandstone particles and the spatial distribution of fractures. The resolution is 13.4923 µm, that is to say the distance between adjacent sampling points is 13.4923 µm which means the accuracy is lower. Fig. 2 shows the sandstone samples: the size of horizontal slice is 500 × 500 with actual length 6.74615 × 6.74615 mm and the size of vertical slice is 500 × 100 with actual length 6.74615 × 1.34923 mm. In order to verify the validity of the proposed method, firstly, sample one slice per two slices of the 3D sandstone dataset in depth regularly and the sampled horizontal and vertical slices are shown in Fig. 3. The maximum iterations are set to 50, and the reconstruction for vertical slices of the sampled sandstone is done using the proposed and spgl1 methods. The reconstructed horizontal and vertical slices of sandstone are shown in Figs. 4(a)-(b). Enlarge the vertical slices of the original, sampled and reconstructed sandstone, shown in Fig. 5. Figs. 5(a)-(d) represent the original vertical slice, the vertical slice sampled in depth, the reconstructed vertical slice by the proposed method and the reconstructed vertical slice by the spgl1 method, respectively.
Fig. 2 Horizontal and vertical slices of the sandstone
490
Chinese J. Geophys.
Vol.58, No.5
Fig. 3 Horizontal and vertical slices of the sandstone sampled in depth
Comparisons among the complete 3D dataset shown in Fig. 2, the reconstructed results shown in Fig. 4 and enlarged versions shown in Fig. 5 indicate that the proposed method and the spgl1 method can obtain the reconstructed sandstone from the sampled one, while the proposed method is more accurate. Moreover, the proposed method just uses forward transform, inverse transform and threshold operator in each iteration, while the spgl1 method should calculate the step for updating besides those operations, therefore the proposed method is more efficient compared with the spgl1 method. Reconstruction for the sampled 3D sandstone dataset demonstrates the validity of the proposed method. Comparison with the spgl1 method proves the superiority of the proposed method, and it is suitable to apply the proposed method in the 3D digital core reconstruction from shale slices with complicated fracture structure in nano-micron scale obtained by FIB-SEM. 3.2 3D Digital Core Reconstruction of Shale FIB-SEM can achieve precise imaging for nano-scale fractures. Because of the limitation of equipments, shale slices are discontinuities in depth and the minimum interval between adjacent slices is inconsistent with horizontal resolution of digital cores. It could limit the characterization of vertical spatial distribution of fractures and affects the accuracy improvement of data processing and related simulation analysis of the shale digital cores. Therefore, 3D digital core reconstruction from the 2D shale slices is an essential step for digital rock physics research. Then, the 3D digital cores can be achieved through image reconstruction from the 192 shale slices obtained by FIB-SEM. The distance between adjacent slices is 10 nm and the resolution of horizontal slice is 5.56 nm. The size of the horizontal slice is 2048 × 1768 and the horizontal and vertical slices of shale are shown in Fig. 6. In order to better characterize the spatial distribution of shale fracture and improve the accuracy of data processing and related simulation analysis of the shale digital cores, slices doubled in depth are obtained from the original shale slices based on the proposed method with 50 iterations. The minimum interval between adjacent slices is basically consistent with horizontal resolution in the reconstructed 3D digital cores, and the shale slices in depth are doubled as compared with the original shale slices. The vertical slices before and after reconstruction, are shown in Figs. 7-8. Figs. 7-8 show that the distance between the adjacent slice is halved
Wang B F et al.: Curvelet-Based 3D Reconstruction of Digital Cores Using the POCS Method
491
and fracture distribution is clearer, thus guaranteeing the vertical continuity and weakening the discontinuity of shale slices in depth caused by the limitation of equipments. Local display of the 3D shale dataset before and after reconstructionis shown in Fig. 9. After reconstruction, fracture continuity is more continuous and the minimum interval between adjacent slices is basically consistent with horizontal resolution with no fake fractures emerging, which demonstrate the validity of the proposed method for highly accurate 3D digital core reconstruction from the 2D shale slices obtained by FIB-SEM.
Fig. 4 Horizontal and vertical sandstone slices after reconstruction (a) Using the proposed method; (b) Using the spgl1 method.
492
Chinese J. Geophys.
Vol.58, No.5
Fig. 5 Enlarged vertical slice of the sandstone
Fig. 6 Horizontal and vertical slices of the 3D dataset composed of raw shale slices
Wang B F et al.: Curvelet-Based 3D Reconstruction of Digital Cores Using the POCS Method
493
Fig. 7 Vertical shale slice before and after reconstruction (a) Before reconstruction; (b) After reconstruction by the proposed method.
Fig. 8 Vertical shale slice before and after reconstruction in another direction (a) Before reconstruction; (b) After reconstruction using the proposed method.
4 CONCLUSION The 3D digital cores are reconstructed from the 2D shale slices based on the Projection Onto Convex Sets (POCS) method in the curvelet domain. Sandstone reconstruction test of the 3D digital cores demonstrates that the proposed method is more suitable for rock slices reconstruction with high efficiency and accuracy compared with the popular spgl1 method. The shale reconstruction test of the 3D digital cores from nano-scale shale slices obtained by FIB-SEM, indicates that vertical spatial distribution of fractures is clearer and the minimum interval between adjacent slices is basically consistent with the horizontal resolution after reconstruction, which can lay the foundation for the subsequent data processing and related simulation analysis of the shale digital cores. The 3D digital core reconstruction tests on 2D sandstone and shale slices, demonstrate the validity of the proposed method. Methods based on the direct 3D dataset and efficient sparse transforms will be developed in future work. ACKNOWLEDGMENTS This research is sponsored by the National Natural Science Foundation of China (U1262207) and Key State Science and Technology Project (2011ZX05023-005-005, 2011ZX05019-006).
Chinese J. Geophys.
Vol.58, No.5
Depth
Depth
494
Fig. 9 Local display of the 3D shale dataset (a) Before reconstruction; (b) After reconstruction.
References Abma R, Kabir N. 2006. 3D interpolation of irregular data with a POCS algorithm. Geophysics, 71(6): E91-E97, doi: 10.1190/1.2356088. Blumensath T, Davies M E. 2008. Iterative thresholding for sparse approximations. Journal of Fourier Analysis and Applications, 14(5-6): 629-654, doi: 10.1007/s00041-008-9035-z. Blumensath T, Davies M E. 2009. Iterative hard thresholding for compressed sensing. Applied and Computational Harmonic Analysis, 27(3): 265-274, doi: 10.1016/j.acha.2009.04.002. Bregman L. 1965. The method of successive projection for finding a common point of convex sets (Theorems for determining common point of convex sets by method of successive projection). Soviet Mathematics, 6: 688-692.
Wang B F et al.: Curvelet-Based 3D Reconstruction of Digital Cores Using the POCS Method
495
Bregman L. 1967. The relaxation method of finding the common point of convex sets and its application to the solution of problems in convex programming. USSR Computational Mathematics and Mathematical Physics, 7(3): 200-217. Cand`es E. 2001. The curvelet transform for image denoising. Proceedings 2001 International Conference on Image Processing. Thessaloniki: IEEE. Cand`es E, Demanet L, Donoho D, et al. 2006. Fast discrete curvelet transforms. Multiscale Modeling & Simulation, 5(3): 861-899. Cao J, Wang Y F, Yang C C. 2012. Seismic data restoration based on compressive sensing using the regularization and zero-norm sparse optimization. Chinese J. Geophys. (in Chinese), 55(2): 596-607, doi: 10.6038/j.issn.00015733.2012.02.022. Gao J J, Chen X H, Li J Y, et al. 2010. Irregular seismic data reconstruction based on exponential threshold model of POCS method. Applied Geophysics, 7(3): 229-238, doi: 10.1007/s11770-010-0246-5. Gao J J, Stanton A, Naghizadeh M, et al. 2012. Convergence improvement and noise attenuation considerations for beyond alias projection onto convex sets reconstruction. Geophysical Prospecting, 61(Suppl. 1): 138-151, doi: 10.1111/j.13652478.2012.01103.x. Hennenfent G, Herrmann F J. 2008. Simply denoise: Wavefield reconstruction via jittered undersampling. Geophysics, 73(3): V19-V28, doi: 10.1190/1.2841038. Herrmann F J, B¨ oniger U, Verschuur D J E. 2007. Non-linear primary-multiple separation with directional curvelet frames. Geophysical Journal International, 170(2): 781-799, doi: 10.1111/j.1365-246X.2007.03360.x. Herrmann F J, Hennenfent G. 2008. Non-parametric seismic data recovery with curvelet frames. Geophysical Journal International, 173(1): 233-248, doi: 10.1111/j.1365-246X.2007.03698.x. Liu X F, Sun J M, Wang H T. 2009a. Reconstruction of 3-D digital cores using a hybrid method. Applied Geophysics, 6(2): 105-112, doi: 10.1007/s11770-009-0017-y. Liu X F, Sun J M, Wang H T. 2009b. Numerical simulation of rock electrical properties based on digital cores. Applied Geophysics, 6(1): 1-7, doi: 10.1007/s11770-009-0001-6. Liu X F, Zhang W W, Sun J M. 2013. Methods of constructing 3-D digital cores: A review. Progress in Geophys. (in Chinese), 28(6): 3066-3072, doi: 10.6038/pg20130630. Loris I, Douma H, Nolet G, et al. 2010. Nonlinear regularization techniques for seismic tomography. Journal of Computational Physics, 229(3): 890-905, doi: 10.1016/j.jcp.2009.10.020. Naghizadeh M, Sacchi M D. 2010. Beyond alias hierarchical scale curvelet interpolation of regularly and irregularly sampled seismic data. Geophysics, 75(6): WB189-WB202, doi: 10.1190/1.3509468. Neelamani R, Baumstein A, Gillard D, et al. 2008. Coherent and random noise attenuation using the curvelet transform. The Leading Edge, 27(2): 240-248, doi: doi: 10.1190/1.2840373. Okabe H, Blunt M J. 2004. Prediction of permeability for porous media reconstructed using multiple-point statistics. Physical Review E, 70(6): 066135, doi: 10.1103/PhysRevE.70.066135. h Øren P E, Bakke S. 2002. Process based reconstruction of sandstones and prediction of transport properties. Transport in Porous Media, 46(2-3): 311-343. Starck J L, Donoho D L, Candes E J. 2001. Very high quality image restoration by combining wavelets and curvelets. // Proc. SPIE 4478, Wavelets: Applications in Signal and Image Processing IX, 9, doi:10.1117/12.449693 . Starck J L, Cand`es E J, Donoho D L. 2002. The curvelet transform for image denoising. IEEE Transactions on Image Processing, 11(6): 670-684. Stark H, Oskoui P. 1989. High-resolution image recovery from image-plane arrays, using convex projections. JOSA A, 6(11): 1715-1726. Van Den Berg E, Friedlander M P. 2008. Probing the Pareto frontier for basis pursuit solutions. SIAM Journal on Scientific Computing, 31(2): 890-912. Yang P L, Gao J H, Chen W C. 2012. Curvelet-based POCS interpolation of nonuniformly sampled seismic records. Journal of Applied Geophysics, 79: 90-99, doi: 10.1016/j.jappgeo.2011.12.004. Yao J, Zhao X C, Yi Y J, et al. 2005. The current situation and prospect on digital core technology. Petroleum Geology and Recovery Efficiency (in Chinese), 12(6): 52-54. Youla D C, Webb H. 1982. Image Restoration by the Method of Convex Projections: Part 1-Theory. IEEE Transactions on Medical Imaging, 1(2): 81-94. Zhang H, Chen X H. 2013. Seismic data reconstruction based on jittered sampling and curvelet transform. Chinese J. Geophys. (in Chinese), 56(5): 1637-1649, doi: 10.6038/cjg20130521.