Cycle-Accurate Microarchitecture Performance Evaluation, by Richard Hough, Phillip Jones, Scott Friedman, Roger Chamberlain, Jason Fritts, John Lockwood, and Ron Cytron, In Proceedings of Workshop on Introspective Architecture, Austin, TX, February 2006.
Cycle-Accurate Microarchitecture Performance Evaluation ∗ Richard Hough, Phillip Jones, Scott Friedman, Roger Chamberlain, Jason Fritts, John Lockwood, and Ron Cytron † Washington University St. Louis, Missouri
Abstract
1
We present the design, implementation, and evaluation of a circuit we call the Statistics Module that captures cycle-accurate performance data at (or above) the microarchitecture layer. The circuit is deployed introspectively—in the architecture itself— using an FPGA in the context of a soft-core implementation of a SPARC architecture (LEON). Accessible over the Internet, the circuit can be dynamically configured (without resynthesis) to capture programlevel, function-level, and instruction-level statistics on any subset of predefined VHDL signals. The circuit is deployed outside the actual soft core, so that its operation does not interfere with a program’s execution at any level.
Any introspective system must at least be capable of monitoring detailed aspects of its own performance. In this paper, we present a hardware design for a circuit, called the Statistics Module, that measures and accumulates statistics about a program’s execution. Before presenting our circuit’s design, we consider the following extant approaches that measure characteristics of a program’s execution:
In contrast with simulations, StatsMod monitors actual real-time program executions, including runtime artifacts such as multithreading, operating system support, and external interrupts. Furthermore, unlike software-introduced instrumentation, the measurements do not affect the statistics, and microarchitecture characteristics are easily captured. Our design avoids the otherwise combinatorial size of circuitry that would be required to accommodate all methods and events, scaling well with the number of artifacts that are actually measured. We have used this circuit to measure cycle-accurate cache-RAM statistics, such as cache hits and misses, RAM reads and writes, using both write-through and write-back policies. In this paper, we show the scalabilty of our design as it accommodates more methods and events. ∗
This work was sponsored by the National Science Foundation under grant ITR–0313203. † Contact:
[email protected]
Introduction
Profiling: Compilers such as the gcc suite offer the ability to instrument an application [3] so as to develop a profile of where the application’s time is spent. The overhead for such instrumentation is typically reasonable in terms of cost, but not always reasonable in terms of accuracy. One fundamental problem is that the instrumentation affects the very phenomena one wishes to observe. For real-time benchmarks and relatively short program segments, the instrumentation overhead can dominate the application’s behavior of interest. In the case of the benchmarks and architectures we consider for this paper, some of the performance problems were in the cache subsystem, whose behavior is very sensitive to a program’s instruction stream and storage references. Instrumentation introduced by profiling profoundly affects a cache, skewing the performance results by perturbing the very component requiring evaluation. Moreover, while profiling can perhaps show where performance problems exist, that technique cannot observe, measure, or account for the effects of a system’s microarchitecture on the produced timings. In our case, much of the performance can be attributed to the cache subsystem, which is beyond the purview of profiling.
Simulation: This approach (for example, SimpleScalar [4]) can produce performance statistics that account for architecture and microarchitecture detail; however, there are two problems here as well. First, simulation can be very slow—so slow that an entire program’s execution is usually infeasible if results are needed within a day. Second, the simulation is only as good as the model of the system’s relative behavior in the simulator. Most simulators cannot account for thread or process interaction, operating system behavior, or external events. Simulators that do try to account for such phenomena rely on the accuracy of the model in the simulator, which may have no provable connection to what actually occurs during a program’s execution. While the above techniques have merit in some circumstances, they are inadequate to the task of runtime introspective monitoring. We are concerned in particular with deployment of program-analysis tools on a reconfigurable architecture. As such, we are able to deploy circuitry in addition to an application’s requisite circuitry (such as a core processor, cache subsystem, etc.) that can develop meaningful statistics about a program’s execution. In such a domain, the following approaches are currently available: On-Chip Logic Analyzer: Using a tool like Identify or ChipScope, signals from the VHDL design that characterizes the architecture and microarchitecture can be specified for monitoring. The signal’s behavior is captured in Block RAM that is allocated for use by the analyzer. The Block RAM values are pushed off-chip through the JTAG port and the resulting signals can be visualized by the end-user. While this approach works very well for debugging circuitry, it is not ideal for the exigent need to understand performance. Specifically, analyzers require a trip through at least a partial (re)synthesis of the reconfigurable device (FPGA), which can take hours to complete. In our approach, we anticipate the measurement of a large number of signals and we dynamically configure registers on the FPGA to determine which signals are actually measured. We thereby avoid synthesis without limiting the set of signals that can be
measured. VHDL-deployed monitoring: A developer could insert logic to obtain signals of interest as we do, but the resulting code is tangled and does not make use of a system-wide facility for identifying, measuring, and forwarding counts of signals of interest.
Problem formulation: We formulate the problem we study as follows. Let S represent a (VHDL-defined) signal whose value (high or low) we wish to observe at the rising edge of a clock common to both our circuit and the circuit we are monitoring (in this paper, the processor core). Let P be a predicate (condition) that can be evaluated in combinational logic. For our purposes, P is typically a range condition imposed on the processor’s program counter, which indicates that the processor was executing code inside a method or function of interest. An event is an (S, P ) pair, and the purpose of our circuit is to count events. Each event of interest is tallied in a separate register whose width R is determined by the frequency of tally-posts off-chip and the worst-case frequency of that event’s occurrence. For the purposes of this paper, each (S, P ) pair can represent a signal (such as a cache miss) that is high at a rising clock edge, while the program counter is within a specified range. To measure instruction counts within a given program-counter range, S can be specified as constantly high. Consider a naive implementation of a circuit designed to tally events. The complexity of that logic is bounded (from below) by the total number of possible events, since each may happen in a given clock cycle. Thus, the naive implementation consumes Ω(S ×P ×R) logic. A processor core contains thousands of signals that might be of interest for monitoring, and even small programs can contain hundreds to thousands of methods. The width of R depends on how frequently the tallies are sent off-chip, but in the naive implementation, even modest values of R result in a circuit that is too complex to consider for typical FPGA devices. We have developed an improved design in which the complexity grows as Ω(S +P +n×R) where n is the maximum number of events we want to monitor
concurrently. Of course, if n = S × P then our circuit degenerates into the naive implementation; typically, developers do not want all events monitored at the same time. For the purposes of evaluation, we assume R = 32 in this paper; optimizing R is the subject of future work. Our design is presented in detail in Section 3, but the essential idea is that each of the n registers contains two multiplexors that are programmed to pick a signal of interest and an address-range of interest. The set of signals is decided at VHDL-compilationtime, but the actual signals that are monitored are chosen when the program is executed, as we describe below.
presents the hardware infrastructure upon which our work is based. Section 3 presents the design of our circuit. Section 4 shows how our circuit fits into a grander tool chain that presents a user with signals and address-ranges for monitoring and synthesizes control packets for our circuit to configure it appropriately. Section 5 analyzes the size of our circuit and compares that with a more straightforward (and more costly) implementation. Section 6 presents data we have obtained using this circuit, and Section 7 offers some conclusions and suggestions concerning future work.
Related Work
The Statistics Module was architected to be portable across a variety of hardware platforms. To date it has as been used to measure the performance of applications running on a Liquid Architecture system [7]. We therefore present the following to give an introduction to the Liquid Architecture system and its main components.
In terms of functionality, our approach resembles SnoopP [8], in that we both augment a soft-core architecture (e.g., Microblaze for SnoopP) with logic to capture information based on instruction ranges. Our contribution is a different logic design and its ability to allow users to choose from hundreds of signals and to correlate their behavior with the program counter with regard to instruction ranges. Thus, our system can be used to obtain SnoopP-level information (cycle-accurate instruction counts), but the reverse is not true. A straightforward extension to SnoopP would involve the naive design discussed above with the dire ramifications on circuit size shown in Section 5. Our design is also a generalization of [1], which developed a sophisticated counter mechanism but not the infrastructure to connect it to various events and instruction ranges. There are numerous references in literature to obtaining results at the microarchitecture level by simulation and performance modeling [2] or by binary instrumentation [6], but those have the usual disadvantages raised in this paper. VHDL design tools also allow runtime monitoring of logic signals, but these typically require recompiling the logic description, and they are not necessarily correlated with any program counter. Moreover, application runtime is rather limited because of the number of events that can be generated and the way in which counters are provisioned. Our paper is organized as follows.
2
2.1
Hardware Infrastructure
Liquid Architecture System
The purpose of the Liquid Architecture system is to create a processor-centric platform that can adapt underlying hardware resources to give an application the best possible performance (with respect to some metric such as speed, power consumption, etc.). While reconfiguration based on the output of the Statistics Module is currently achieved manually, the ultimate goal is to use this module in an automated way to act as feedback for dynamically reconfiguring hardware resources as an application’s requirements change over time.
2.2
Leon Soft-core Processor
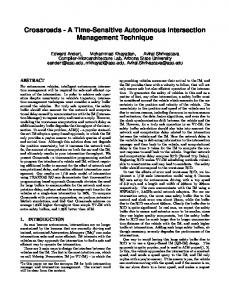
The Leon SPARC-V8 compatible soft-core processor was originally developed by Jiri Gaisler formerly with the European Space Agency, and the VHDL for the processor is now freely available from the Gaisler web site. As can be seen from Figure 1, Leon uses a typical 5-stage Integer Unit pipeline for instruction execution. It is a complete computer system with components such as instruction/data caches and Section 2 memory controllers. Because the Leon processor has
• Load configuration information into the Statistics Module • Transport statistics data sent from the Statistics Module to remote statistics collection software Finally the FPX supplies memory resources such as SRAM (4 Mbytes) and SDRAM (128 Mbytes) that are used by the Leon core for main memory.
3
Statistics Module Implementation
When we began implementing the Statistics Module, Figure 1: Top Level View of the Leon Architec- we set out with one goal primary in our mind: flexiture bility. We wanted the end user to have as much control over the functionality of the Statistics Module as many of the components found on modern proces- possible without forcing the user to write or modify sors, and because its VHDL source code is freely VHDL code. Even in cases where the VHDL must available, it a good choice for the core processor be altered, such as increasing the number or size of used by the Liquid Architecture system. At this time, statistic counters, adding new signals to be watched, the Statistics Module has been used to gather data or increasing the number of address range registers, from experiments in which the run-time, memory ac- we optimized our code so that such changes take no cesses, and data cache behavior have been monitored more effort than altering the value of a single varito evaluate application performance as architecture able. At its base, the Statistics Module implements a and micro-architecture changes have been made to configurable number of counters that increment each the Leon core. In the future, the Statistics Module time an “event” (as defined in Section 1) occurs. At will be used to measure other performance indicaruntime, a user may configure each counter indepentors. dently, associating it with any desired event combination. Subsequently, when the program counter 2.3 FPX Prototyping Platform (PC) is within the specified address range and the The Liquid Architecture system and its Statistic specified signal raises high, the counter is increModule are deployed on an FPX: a networked mented. After a fixed-length interval specified by the user, FPGA-based platform for developing pluggable network processing circuits [5]. The FPX contains a dispatch event packages the values of each of the a Virtex 2000e FPGA, called the RAD (Reconfig- counters into a UDP payload and transmits the reurable Application Device), that is used for develop- sult over the Internet to a collection server. There, ing application circuits. All the reconfigurable logic the results for the program’s run are stored and tabneeded to implement the Liquid Architecture sys- ulated, and a final sum is reported at the program’s tem (e.g. instantiate the Leon core) is supplied by termination. This occurs concurrently with the other the RAD FPGA. In addition, the FPX has a second functionality of the Statistics Module, so no informasmaller FPGA, the NID (Network Interface Device), tion is lost as a result. After the dispatch event at the that allows the Liquid Architecture system to be ac- end of each interval, every counter is reset and the cessed over a network. At this time, network connec- counting continues. This cycle of timer firing, value reporting, and counter resetting continues until the tivity is used to: program terminates. • Remotely load/run programs on the Leon proThe implementation of the Statistics Module can cessor be divided into four separate parts: Mux Control
we show the size of the Statistics Module as a function of the number of ARRs.
3.2
Figure 2: Design of the Statistics Module Registers, Address Range Registers, the Timer, and the Counters themselves. We next discuss each of those parts in detail, as well as provide a brief discussion on how the Statistics Module is configured by the user. Figure 2 shows the organization and interdependence of each of these components.
As shown in Figure 2, each counter has two MUXes associated with it: one for the signal of interest, and one for the address range of interest. The MUXes are programmed by a Mux Control Register. For a counter to operate properly, these control registers must denote the signal and the ARR that the counter uses. This information is then fed into two MUXs that select the appropriate signal and ARR comparison logic output. At every clock cycle, the counters examine the conjunction of their associated signal and ARR, and if the result is high, the counter is incremented. These control registers allow runtime configurability of the system. In this manner, the user can choose exactly which signal and address range for observation with a specific counter.
3.3 3.1
Address Range Registers
Mux Control Register
Counters
The counters are 32-bit synchronous counters that increment when their given input signal is high on a clock edge. Each is a saturating counter, so that if a counter ever reaches the hex value “FFFFFFFF”, then the counter will not increment on more events. This feature serves to warn that the timer interval is too long for the frequency of the monitored signal. The counters only increment while the program is running. Once the program has terminated, the counters will freeze on their current value and not increment any more. The number of counters that exist in the module is determined by a compile-time variable. The width of each counter can also be configured, and that width should be determined by the expected frequency of update and the length of the interval set for the dispatch timer, as discussed below.
The Address Range Registers (here on referred to as ARRs) are realized as a set of 64-bit registers divided into two 32-bit subcomponents. When configured by the user, a ARR will contain two 32-bit addresses1 that together form the lower and upper bounds of an address range. Comparison logic is attached to each ARR that compares the current value of the PC to the specified address range, and the logic outputs true when the program is executing instructions within the range. As shown in Figure 2, each ARR is logically separated from any particular counters in the module. When the Statistics Module is configured at start-up, a user-crafted UDP packet sent to the circuit specifies which ARR to associate with a counter. No more than one ARR can be associated with a counter at a time; however, multiple counters can be tied to the 3.4 Dispatch Timer same ARR. The number of ARRs that exist in the module is Counter values are transmitted and reset based on the determined by a compile-time variable. In Section 5 timer shown in Figure 2. The timer is a standard 321 Currently these are physical addresses, but we are modify- bit decrementer that decreases by 1 every clock cying our circuit to work with virtual address spaces and an MMU. cle. The initial value of the timer is configured by the
user before the program begins. Once the program has started, the timer begins to decrease from its initial value. When the timer reaches 0, it signals the beginning of a dispatch event. This event forces the Statistics Module to output its results, and it also signals to the network interface subsystem that results are now available to be packaged up and reported. At this point the Statistics Module reports the value of every counter, and it also resets the value of the counters to 0. In the case that a counter should be incremented on the same clock cycle that the counter is reset, the counter will be set to 1 as opposed to 0. When the program terminates, the timer will continue to count down until it reaches 0. It will then signal the beginning of the last packet, and the counters will report the values they gathered between the last timer cycle and program termination. Once this packet has been transmitted, the timer will reset to its programmed value and will not decrement until another program starts to run on the system.
3.5
Configuration
Aside from the pre-synthesis variable configuration that has already been mentioned, most of the configurability of the Statistics Module actually occurs at run time. At run time, the user can send configuration packets to the Statistics Module. These UDP packets specify how to program the timer, associate individual counters with signals, and set the address ranges of the predicates.
4 Use case Our web-based user interface provides a vehicle for inputting a program, selecting methods and events to evaluate, and reporting the performance results. The web interface accepts a cross-compiled C program in .bin (binary) format as well as a .map (linker output) file. We parse the .map file with a Perl script to obtain three important properties of the program:
• Names of every method The script then uses this data to construct a table for the user to select (signal, method) pairs to profile during execution. Once the target events have been selected, the web interface commences automatic hardware configuration, where our control script performs the following initialization steps: 1. Loads the bitfile 2. Copies the program binary into main memory 3. Configures each counter of the Statistics Module with UDP packets according to the target events selected by the user 4. Saves the name for each (signal, method) counter in plain English for later reporting 5. Configures the Statistics Module dispatch timer with a UDP packet Once the script configures the hardware, it signals the hardware to commence execution. The control script then instantiates a Java statistics listener that expects packets of results from the Statistics Module. These packets arrive throughout program execution, at the regular interval designated by the dispatch timer configuration step above. The listener accepts and records each packet until it receives a program termination signal from the hardware. The listener exits once we reach program termination, and our Perl control script generates a detailed program statistics report for the user. We report the per-packet data as well as the total (signal, method) occurrences for each target over program execution. The entirety of the automated configuration and reporting mechanisms (not including the program execution) complete in under a minute.
5
Size of the Circuit
• Size and location of the program’s .text seg- One important facet of our design is its scalability when compared to other possible solutions. This secment tion presents our findings in this regard. • Low and high boundary memory addresses of To measure the scalability of our device, we ran every method multiple synthesis runs, each time varying one of the
Figure 3: Graph of Module Scalability Write-Back Proposed Percent three main variables of our implementation: number Benchmark Writes Writes Saved of ARRs, number of monitored signals, and number Numeric Heapsort 233 220 5.5% of event counters. Starting with 2 of each compoBLASTN 185,548 180,203 3.0% nent, we ran three regressions (one per component), 0 0 0.0% progressively increasing the number of ARRs, sig- Towers of Hanoi nals, or event counters in each step, while holding Figure 4: Memory writes per benchmark for the other two components fixed. The result of these write-back and proposed caches regressions can be seen in Figure 3.
6 We also simulated the scalability of a naive design for comparison with our approach. By definition, the naive design would require one counter for every possible combination of ARR and monitored signal. As such, we’ve included a fourth series on the chart that represents the scalability of N Address Range Registers, N monitored signals, and N2 event counters.
In Figure 3, varying the value of N for the three experimental series yields a linear growth rate for the space consumption of the module. Comparatively, the naive implementation clearly shows a rapid and exponential growth in resource usage.
Experiments
We report on two ongoing experiments we are conducting using the Statistics Module. In the first, we are interested in measuring the effects of a proposed cache policy in terms of the number of write-backs that are saved. The results, shown in Figure 4, were obtained at full speed (on the FPGA) with no interference from the Statistics Module infrastructure on the results themselves. In another effort, we are experimenting with microarchitecture variations and measuring effects of those variations on execution time, power, and chip area. Figure 5 shows the results obtained for various instruction cache designs. Notice that the variation among runs is under 10 cycles out of hundreds of
Configuration base icachesets2 icachesets3 icachesets4 icachesetsz1 icachesetsz2 icachelinesz4 icachereplacelrr icachereplacelru
Parameter x1 x2 x3 x4 x5 x9 x10 x11
Cycles Run 1 384,334,080 384,334,065 384,334,061 384,334,061 872,955,971 384,334,061 384,334,001 384,334,061 384,334,065
Cycles Run 2 384,334,061 384,334,061 384,334,070 384,334,061 872,955,971 384,334,061 384,333,998 384,334,065 384,334,065
Figure 5: Microarchitecture variation
versity in St Louis, August 2002. Report number WUCS–02–25. [2] Kallol Bagchi. The State-of-the-art in Performance Modeling and Simulation. Gordon and Breach Publishers, 1996. [3] Susan L. Graham, Peter B. Kessler, and Marshall K. McKusick. gprof: A call graph execution profiler. ACM SIGPLAN ’82 Symposium on Compiler Construction, 17(6):120–126, June 1982. [4] SimpleScalar LLC. SimpleScalar. simplescalar.com, 2001.
www.
millions.2 [5] John W. Lockwood, Jon S. Turner, and David E. TayIn summary, we are able to use the Statistics Modlor. Field Programmable Port Extender (FPX) for ule to obtain cycle-accurate measurements at full Distributed Routing and Queueing. In FPGA 2000, platform speed (like SnoopP) but also to obtain meaMonterey, CA, USA, 2000. surements of microarchitecture phenomena. [6] Jaydeep Marathe, Frank Mueller, Tushar Mohan,
7 Conclusions and Future Work
Bronis R. de Supinski, Sally A. McKee, and Andy Yoo. METRIC: Tracking Down Inefficiencies in the Memory Hierarchy via Binary Rewriting. In CGO ’03: Proceedings of the international symposium on Code generation and optimization, pages 289–300, Washington, DC, USA, 2003. IEEE Computer Society.
While the idea of circuitry to support nonintrusive monitoring is not new, our design accommodates hundreds of possible architecture and microarchitecture signals and correlates them based on an appli- [7] Shobana Padmanabhan, Phillip Jones, David V. Schuehler, Scott J. Friedman, Praveen Krishnacation’s program counter. The circuitry reports remurthy, Huakai Zhang, Roger Chamberlain, Ron K. sults across a network so that counters can be polled Cytron, Jason Fritts, and John W. Lockwood. Extractand reset periodically, enabling the application to run ing and improving microarchitecture performance on indefinitely without overflowing the circuit’s event reconfigurable architectures. International Journal of counters. Parallel Programming, 33(2–3):115–136, June 2005. While experimentation using the Statistics Module [8] Lesley Shannon and Paul Chow. Using reconis in its early stages, we are able to learn much about figurability to achieve real-time profiling for hardan application’s behavior without recourse to samware/software codesign. In FPGA ’04: Proceedings pling or other compromises short of full-execution of the 2004 ACM/SIGDA 12th international sympoobservation. sium on Field programmable gate arrays, pages 190– 199, New York, NY, USA, 2004. ACM Press. We are in the process of deploying the circuit to allow application-specific, incremental reconfiguration and optimization of microarchitecture features, and we seek to wrap the circuitry in a common frontend control program such as gprof.
References [1] Michael Attig and John Lockwood. Usage of the statistics counter plus component in network hardware modules. Technical report, Washington Uni2
That variation is due to an imprecise start of the soft-core architecture.