the templates for eight directions on the edges. An .... We also calculated the rations of digital num- bers (DNs) of green and .... EERI Newsletter Vol. 38, No. 4.
ICOSSAR 2005, G. Augusti, G.I. Schuëller, M. Ciampoli (eds) © 2005 Millpress, Rotterdam, ISBN 90 5966 040 4
Damage detection in earthquake disasters using high-resolution satellite images F. Yamazaki & Y. Yano Department of Urban Environment Systems, Chiba University, Chiba, Japan
M. Matsuoka Earthquake Disaster Mitigation Research Center, NIED, Kobe, Japan
Keywords: high-resolution satellite, damage detection, earthquake, QuickBird, IKONOS ABSTRACT: This paper highlights the usefulness and accuracy of high-resolution satellite images in damage detection after the occurrence of natural disasters. A strong earthquake struck the city of Bam in the southeast Iran on 26 December, 2003 and it brought massive destruction to the city and its surrounding rural areas. IKONOS and QuickBird (QB), high-resolution optical satellites, captured clear images of Bam a few days after the event. The city was also observed by QB about three months before the event. First, visual damage interpretation based on the European Macroseismic Scale (EMS-98) was carried out building by building, comparing the pre-event and post-event QB images. An automated damage detection method developed by the present authors was also applied to the post-event IKONOS and QB images. The results of these damage inspections were compared with field survey data and the accuracy and limitation of visual and automated damage detections were presented.
1
INTRODUCTION
Capturing damage distribution immediately after the occurrence of natural disasters, e.g. earthquakes or floods, is quite important in emergency management. In order to examine the applicability of remote sensing technologies to emergency management after earthquakes, the present authors have performed visual damage detection using aerial video images and aerial photographs for the 1995 Kobe earthquake (Hasegawa et al. 2000). These kinds of aerial images can identify the damage status of individual buildings but they cannot cover a large area with one acquisition time. On the other hand, satellite images have an advantage to observe a large area at one time. However, the spatial resolution of conventional satellite images, e.g. Landsat, SPOT, ERS/SAR, is from 20m to 30m. Hence, it is difficult to identify the damage of individual buildings and bridges from these images. IKONOS, the first commercial high-resolution satellite with maximum spatial resolution of 1.0m, launched successfully in September, 1999. It captured a clear image of Bhuj area after the 26 January, 2001 Gujarat, India earthquake. Saito et al. (2004) performed visual damage inspection using the postevent IKONOS image, in which individual buildings
can be identified, and pre-event other satellite images. QuickBird (QB), another high-resolution commercial satellite with the maximum spatial resolution of 0.6 m, launched in October, 2001 and it has been acquiring optical images of urban areas since then. The first such image pairs (both pre-event and post-event) were taken for the 21 May, 2003 Algeria earthquake and the QB image pair were used in building damage detection (Yamazaki et al. 2004). Eight days after the 26 December, 2003 Bam, Iran earthquake, QB captured a good image of the hard-hit area as well as capturing a pre-event clear image on 30 September, 2003. Using these images, visual damage inspection for all the buildings in Bam City is carried out in this paper. Automated damage detection method (Mitomi et al. 2002) was also employed for the post-event QB and IKONOS images. The results of the visual and automated detections are compared with field survey data and the capability of high-resolution optical satellite images in disaster management is demonstrated. 2 QUICKBIRD AND IKONOS IMAGES OF THE 2003 BAM, IRAN EARTHQUAKE A strong earthquake of moment magnitude (Mw) 6.5 struck the southeastern part of Iran at 5:26:26 AM
1693
(a) QB on September 30, 2003 Figure 1. Epicenter of the Bam, Iran earthquake (Relief Web, 2004).
(local time) on 26 December, 2003 (Eshghi & Zare, 2003). The epicenter is located at 29.004°N, 58.337°E (USGS 2003), near the city of Bam in Kerman Province (Fig. 1). According to the report of Iranian authority in June 2004, 26,271 people lost their lives, mostly due to the collapse of traditional mud-brick and clay houses, 30,000 people were injured and up to 75,600 people were left homeless (Relief Web 2004). About 85 percent of the housing and infrastructure have been destroyed in Bam. The United Nations estimates that the number of people affected by the loss of economic activity and damage to property and infrastructure is counted as 200,000. Arg-e-Bam, a historical citadel made by sun-baked mud-brick, was almost completely collapsed. The citadel was designated as World Heritage in Danger after the earthquake by UNESCO. After the occurrence of the Bam earthquake, high-resolution commercial satellites observed the hard-hit areas, IKONOS on 27 December, 2003 and QB on 3 January, 2004 (Earthquake Engineering Research Institute 2004). The image of Bam area was also captured by QB on 30 September, 2003, about three months before the earthquake. The set of QB images are considered to be the second case acquired by civilian high-resolution satellites both before and after a severe earthquake disaster. The first case is the 21 May, 2003 Boumerdes, Algeria earthquake, and in this case, the images of Boumerdes City were taken about one year before, two days after and 28 days after the event, and those of Zemmouri City were obtained eight days before, two days after and 23 days after the event (Yamazaki et al. 2004). In order to observe a target area in a short time interval, QB can change the view angle of its sensors. Thus the two images of Bam have different off-nadir view angles: 10 degrees (pre-event) and 24 degrees (post-event). Hence it is not so easy to superpose these images exactly. The difference in building shadow and vegetation in the different acquisition date images gives additional difficulty in change de-
1694
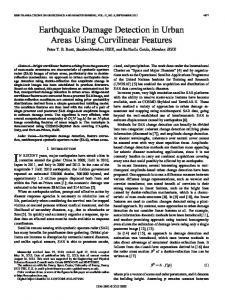
(b) QB on January 3, 2004 Figure 2. Pan-sharpened natural color QuickBird images of Bam City.
tection. Thus visual damage interpretation was performed first in this study. Pan-sharpened images with 0.6m resolution were produced by combining panchromatic images of 0.6m resolution and multi-spectral images of 2.4m resolution as shown in Figure 2. By this image enhancement, buildings, cars and debris can clearly be seen and the image pair were used in visual inspection of building damage. 3
VISUAL DAMAGE INTERPRETATION OF BUILDINGS
Using the pre-event QB image, the location of individual buildings was registered on GIS and city blocks surrounded by major roads were assigned. Then visual inspection of building damage was conducted based on the classification in the European Macroseismic Scale (European Seismological Commission 1998), shown in Figure 3. Comparing the pre- and post-event images, buildings surrounded by debris (Grade 3), partially collapsed buildings (Grade 4) and totally collapsed buildings (Grade 5) were identified.
© 2005 Millpress, Rotterdam, ISBN 90 5966 040 4
Classification of damage to masonry buildings Grade 1: Negligible to slight damage (no structural damage, slight nonstructural damage)
Hair-line cracks in very few walls. Fall of small pieces of plaster only. Fall of loose stones from upper parts of buildings in very few cases.
Grade 2: Moderate damage (slight structural damage, moderate nonstructural damage) Cracks in many walls. Fall of fairly large pieces of plaster. Partial collapse of chimneys.
Grade 3: Substantial to heavy damage (moderate structural damage, heavy nonstructural damage)
Large and extensive cracks in most walls. Roof tiles detach. Chimneys fracture at the roof line; failure of individual non-structural elements (partitions, gable walls).
Grade 4: Very heavy damage (heavy structural damage, very heavy nonstructural damage) Serious failure of walls; partial structural failure of roofs and floors.
Grade 5: Destruction (very heavy structural damage) Total or near total collapse.
Figure 3. Classification of damage to masonry buildings in EMS-98.
Pre-event
Post-event
Grade 3
Grade 4
Grade 5
Figure 4. Typical pre- and post-event QuickBird images for Grades 3, 4 and 5 houses.
In Figure 4, typical pre- and post-event QB images for houses classified as Grades 3, 4 and 5 by visual inspection are shown. Because the spatial resolution of the image is around 0.6m, it is almost impossible to detect damage equal to or less than Grade 2. It is rather easy to detect Grade 5 and in our experience, and agreement among different interpreters is good in case of Grade 5 (Yamazaki et al. 2004). The effects of shadow and vegetation in damage classification become more serious for Grade 4
Figure 5. Result of visual damage interpretation using QB images acquired on 30 September, 2003 and 3 January, 2004. Damage levels are based on EMS-98.
and damage detection becomes more difficult than that for Grade 5. Damage becomes further more difficult to detect for Grade 3, especially from nearvertical images. If some deformation is located on a roof or some debris spreads around a building, Grade 3 damage can still be identified. By this visual interpretation using the pre- and post-event images, a total 12,063 buildings were classified based on their damage grades as shown in Fig. 5. The numbers of identified damaged buildings are 1,597 (Grades 1 or 2), 3,815 (Grade 3), 1,700 (Grade 4), and 4,951 (Grade 5). In the present case, we did not carry out damage interpretation using only the post-event image because the accuracy of single image interpretation was not so high in our previous experiences for Bourmerdes and Zemmouri in the 2003 Algeria earthquake (Yamazaki et al. 2004). Especially in Bam, houses are generally small and brightness of the two images looks different due to different sunlight condition, thus damage detection was rather difficult even in the case using both the pre- and post-event QB images. To examine the accuracy of our damage detection in Bam, the field survey data by Hisada et al. (2004) was employed. They used the same EMS-98 scale to describe the damage grade of each building near eight aftershock recording stations, which were established by International Institute of Earthquake Engineering and Seismology (IIEES). Figure 6 shows the satellite image and our visual inspection result around the aftershock recording station No.1 together with the cross table between Hisada’s survey and our result. This area is located in the south of Arg-e-Bam and 16 houses were made of mud brick (adobe) and 30 houses simple masonry construction. The damage ratio for Grade 5 is 72% by Hisada’s survey while 64 % in our visual inspection. The coincidence of damage grade between the two data sets is quite high in this area.
Proceedings ICOSSAR 2005, Safety and Reliability of Engineering Systems and Structures
1695
Figure 6. Result of visual interpretation compared with field survey data by Hisada et al. (2004) around aftershock recording station No. 1, located in the south of Arg-e-Bam.
Figure 7. Result of visual interpretation compared with field survey data by Hisada et al. (2004) around aftershock recording station No. 3, located in the western part of Bam
Figure 7 shows another comparison for a lower damage area, around aftershock seismic station No.3. In the field survey, a total 45 buildings were classified either Grade 1 or 2 while in our visual interpre-
1696
Figure 8. Comparison of the result of the field survey by Hisada et al. (2004) around 6 aftershock observation sites in Bam City and that of our visual damage interpretation.
tation, 47 buildings were judged as Grades 1 and 2. It is seen that omission errors become significant for Grade 4 damage; out of 13 buildings identified by the field survey, only one building was judged as Grade 4. This may be due to the reason that the houses in this area are rather new (mostly masonry, no adobe construction) and thus the damages difficult to observe from the near-vertical image are dominant. However, the coincidence was very good for Grade 5; three buildings out of three were interpreted correctly. Figure 8 summarizes the comparison of the result of the field survey around six aftershock observation sites (421 buildings in total) in Bam City and that of our visual damage interpretation. Commission errors: judging Grade 1 or 2 damage as Grade 3, and judging Grade 3 damage as Grade 4 or 5, are seen in the cross table. But only 16 buildings were interpreted as more than one grade higher. Thus commission error can be judged as not so significant as for quick-look damage detection. Omission errors: judging Grade 4 damage as Grade 1-3, and judging Grade 5 damage as Grade 14, are also seen in the cross table. Forty-two (42) buildings were interpreted as less than one grade lower. It may be concluded that we should expect some amount of omission errors in damage detection from optical high-resolution satellite images, and thus we should consider this fact in estimating damage statistics at an early stage.
© 2005 Millpress, Rotterdam, ISBN 90 5966 040 4
(a) Visual interpretation from QuickBird image
(b) Aerial photo interpretation (USAID 2004) Figure 9. Result of our visual interpretation from QB images compared with the result of aerial photo interpretation. Colors correspond to 80-100% destruction (purple), 50-80% destruction (red), and 20-50% destruction (yellow).
Figure 9 compares the result of our visual interpretation (the ratio of Grade 5 in each city block) from QB image and the result of aerial photo interpretation (USAID 2004). Some difference is observed between the two maps due to the difference of blocks to calculate the damage ratio although overall agreement is seen to be reasonably well. In obtaining the damage ratio, we counted the number of Grade 5 buildings out of all the buildings in each block although this is very time consuming. On the contrary, the aerial photo interpretation might be conducted rather in a macroscopic manner because the map was created in a rather early period, within a week or so after the earthquake. 4
METHOD OF AUTOMATED DAMAGE DETECTION
The characteristics of collapsed buildings were examined by processing aerial television images taken after the 1995 Kobe, Japan, the 1999 Kocaeli, Turkey, the 1999 Chi-chi, Taiwan, and the 2001 Gujarat, India earthquakes (Mitomi et al. 2000, 2001). Areas with building damage were defined by color indices and edge intensities calculated from original RGB
(red, blue, green) images. However, it was difficult to apply the same threshold values used for the color indices to other images due to the differences in factors such as the amount of sunlight and local environments. Upon further examination, we proposed an area-independent technique (Mitomi et al. 2002) to estimate the areas with damaged buildings using edge information in local windows, such as edge variance and edge direction, and statistical textures derived from the co-occurrence matrix of the edge intensity. Since the edge information can be derived from a gray scale image of brightness, the proposed method can be applied to high-resolution satellite imagery with a spatial resolution of one-meter or less. Edge intensity (Ei), its variance (Ev), and the ratio of the predominant direction of the edge intensity (Ed) were derived from a Prewitt filter and used to detect density changes among neighboring pixels. The Prewitt filter has 3 � 3 matrices and can calculate edge intensities in eight directions (Takagi & Shimoda 2004). This filter was enlarged to a 7 � 7 matrix (Aoki et al. 2001) because the densities of the neighboring pixels gently slope in high-resolution images. Ei was obtained from the maximum value in the templates for eight directions on the edges. An edge direction was defined as the direction of Ei, such as 0 - 180, 45 - 225, 90 - 270, and 135 - 315 degrees. Using the Ei value, Ev was calculated as a variance in a 7�7 pixel window. The ratio of the predominant direction of the edge elements in a 7�7 pixel window, Ed, was also calculated. Statistical textures of the edge intensity were calculated from the occurrence probability value. The occurrence probability, P(k, l), is the probability that a pixel value l appears in a relative position � =(r,�) from a reference pixel whose value is k, where r and � are the relative distance and direction from a reference pixel, respectively. The occurrence probability, P(k, l), was calculated for all the combinations of pixel values (k, l) against a constant �. This matrix is called a co-occurrence matrix (Takagi & Shimoda 2004). In this study, collapsed building characteristics were investigated with the edge textures derived from the co-occurrence matrix based on the edge intensity. The angular second moment (Ta) and entropy (Te) are represented in Equations (1) and (2): m �1 m �1
Ta � �� �P �k , l �� k �0 l �0 m �1 m �1
2
Te � ��� P�k , l � log�P �k , l ��
(1) (2)
k �0 l �0
and they were calculated for the condition of r = 1, which indicates neighboring pixels around a reference pixel, and four edge directions. The maximum value for the directions was defined as a representa-
Proceedings ICOSSAR 2005, Safety and Reliability of Engineering Systems and Structures
1697
tive value of the texture. A 7�7 pixel area was used as the window size for the texture analysis. The both textures, Ta and Te, represent uniformity of the edge structure in the input panchromatic image, but have opposite trends. If P(k, l) is locally large in the matrix, which represents uniform texture, Ta and Te have large and small values, respectively. Collapsed buildings should show very strong trends of non-uniformity, i.e. a low Ta value and a high Te value. Table 1 shows the threshold values for the above-mentioned parameters. Pixels within the range of all threshold values correspond to damaged buildings. This pixel-based detection also generates a vast amount of small meaningless spots (noise), that do not correspond to collapsed buildings. Similar to a previous study (Aoki et al. 2001), the local density of detected pixels (Rpx) was employed to remove those small spots. Rpx is defined as the ratio of the detected pixels by the four threshold values versus the number of pixels in a local window that approximates one building size. The local window is proportional to the image resolution on the ground surface. A window of 31�31 pixels was used to calculate Rpx in the present example.
(a) IKONOS image taken on 12/27/2003
Table 1. Threshold values for indices of automated damage detection used in this study. Index Ev: edge variance Ed: edge direction Ta: angular second moment Te: entropy
Threshold values 2.0 - 6.8 (� 105) 0.3 - 0.6 0.75 - 6.6 (� 10-2) 3.5 - 4.2
5 RESULTS OF AUTOMATED DAMAGE DETECTION FOR BAM CITY In our automated damage method described above, a gray scale (brightness) image was prepared from the original RGB image. IKONOS and QB capture panchromatic images with very high-resolution, about 1 meter and 0.6 meter, respectively. However, these panchromatic sensors cover the visible and nearinfrared regions. Therefore, high-resolution brightness images were derived from pan-sharpened color images, which were created by combining the panchromatic band and multi-spectral bands. To create natural color images, we used linear contrast stretching, 2% for the minimum and 98% for the maximum and allocated band 1, 2, and 3 corresponded to blue, green, and red colors, respectively. Figure 10 shows the results of the damage detection method applied to the IKONOS and QB images of central Bam. Vegetated areas were removed by thresholding the NDVI (Normalized Difference Vegetation Index). According to the visual damage inspection from QB images in the previous section and the reconnaissance field survey by Hisada et al.
1698
(b) QuickBird image taken on 1/3/2004 Figure 10. Results of detected areas with damaged building for original pan-sharpened images.
(2004), more than 80% of buildings in the south of Arg-e-Bam were classified as Grade 4 or 5 in EMS98 scale. The distribution of detected damage from IKONOS is consistent with these results. However, less damage area was detected from the QB image. Spatial resolution and color distribution might be main factors that affect the results. A re-sampled, one-meter resolution QB image provided a similar result as the original QB image. Hence, spatial resolution is not the reason of the differnce. We also calculated the rations of digital numbers (DNs) of green and blue to that of red in the pan-sharpened images to examine the effects of color. The average rates of green and blue to red values were 0.97 and 0.95 for IKONOS while 1.03 and 1.14 for QB, which implies that the QB image is predominantly cyan. In fact, the original QB image does not look natural, but has a blue tint. Therefore, the color of the QB image was modified by histogram matching with the IKONOS image. Figure 11 shows the results of damage detection using the color-modified QB image and the detected result from the color-modified QB image is similar to that from the IKONOS image. Thus, the detection is mainly influenced by the color distribution among red, green, and blue channels. Comparing the automated damage detection results from the post-event
© 2005 Millpress, Rotterdam, ISBN 90 5966 040 4
Hence, the commission error by the present automated damage detection method can be judged to be small. In the present example, we could use the IKONOS image as a referemce to modify the color tone of the QB image. But this situation is not expected in the most cases. Hence, the proposed automated damage detection method still need to be enhanced to obtain more stable and reliable results in various situations. 6 (a) Extracted area corresponding to IKONOS image
(b) Whole QuickBird image Figure 11. Distribution of detected damage areas using the color-modified post-event QB image.
Figure 12. Distribution of detected damage areas using the pre-event QB image. Commission errors are rather limited.
QB and IKONS images with that from visual inspection and the field survey data, the damage distributions seem to agree reasonably well among them. The automated damage detection method was further applied to the pre-event QB image. As seen in Fig. 12, the detected building damage areas (noise) are limited to only small portions on the image.
CONCLUSIONS
Using high-resolution satellite images of Bam City acquired by QuickBird (QB) before and after the 26 December, 2004 Bam, Iran earthquake, visual interpretation of building damage was carried out. Comparing the pre-event and post-event pan-sharpened QB images, buildings surrounded by debris (Grade 3), partially collapsed buildings (Grade 4), and totally collapsed buildings (Grade 5) were identified based on the European Macroseismic Scale (EMS98). A total of 12,063 buildings were classified; 4,951 as Grade 5 and 1,700 as Grade 4. Comparing with detailed field survey data by Hisada et al. (2004), the visual damage interpretation seems to give reasonably accurate results. However some amount of omission error was observed due to the limitation of near-vertical images with 0.6m resolution. Post-event IKONOS and QB images were employed in an automated damage detection method, which uses the edge characteristics calculated from post-event gray scale images. Since the post-event QB image shows a bit unnatural color tone comparing with that of the IKONOS image, the color modification was applied to the post-event QB image before the automated damage detection. The resultant damaged areas from the IKONOS and QB images agreed reasonably well with the visual inspection results and the field survey data. The automated damage detection method was also applied to the preevent QB image, and the commission errors were found to be limited. Based on these studies, the accuracy and usefulness of the high-resolution optical satellite images in building damage detection was demonstrated. A further validation of the proposed method is required for various images from different disasters. ACKNOWLEDGEMENT QuickBird and IKONOS are owned by DigitalGlobe, Inc. and Space Imaging, Inc. respectively. QuickBird images used in this study were licensed and provided by Earthquake Engineering Research Institute (EERI), Oakland, California, USA. IKONOS
Proceedings ICOSSAR 2005, Safety and Reliability of Engineering Systems and Structures
1699
image was used in collaboration with Remote Sensing Technology Center of Japan (RESTEC). The field survey data was provided from Prof. Y. Hisada and Mr. A. Shibayama of Kogakuin University, Tokyo, Japan. REFERENCES Aoki, H., Matsuoka, M., & Yamazaki, F. 2001. Automated detection of damaged buildings due to earthquakes using aerial HDTV and photographs. Journal of the Japan Society of Photogrammetry and Remote Sensing 40 (4): 27-36 (in Japanese). Earthquake Engineering Research Institute. 2004. Preliminary Observations on the Bam, Iran, Earthquake of December 26, 2003. EERI Newsletter Vol. 38, No. 4. Eshghi, S. A& Zare, M., 2003. Bam (SE Iran) earthquake of 26 December 2003, Mw6.5: A Preliminary Reconnaissance Report, http://www.iiees.ac.ir/English/bam_report_english_ recc.html European Seismological Commission. 1998. European Macroseismic Scale 1998. Hasegawa, H., Yamazaki F., Matsuoka M. & Sekimoto I. 2000. Determination of building damage due to earthquakes using aerial television images. 12th World Conference on Earthquake Engineering CD-ROM, Paper ID 1722, 8p. Hisada, Y., Shibayama, A., & Ghayamghamian, M.R. 2004. Building damage and seismic intensity in Bam City from the 2003 Iran, Bam, Earthquake (paper in review). Mitomi, H., Yamazaki, F., & Matsuoka, M. 2000. Automated detection of building damage due to recent earthquakes using aerial television images. The 21st Asian Conference on Remote Sensing. 401-406. Mitomi, H., Saita, J., Matsuoka, M., & Yamazaki, F., 2001. Automated damage detection of buildings from aerial television images of the 2001 Gujarat, India earthquake. IEEE 2001 International Geoscience and Remote Sensing Symposium. CD-ROM. 3p. Mitomi, H., Matsuoka, M., & Yamazaki, F. 2002. Application of automated damage detection of buildings due to earthquakes by panchromatic television images. The 7th US National Conference on Earthquake Engineering CD-ROM. 10p. Relief Web, 2004. http://www.reliefweb.int/w/map.nsf/ Emergency?OpenForm&Query= Iran%3A+Earthquake+ -+Dec+ 2003 Saito, K., Spence, R.J.S., Going,C., & Markus, M. 2004. Using high-resolution satellite images for post-earthquake building damage assessment: a study following the 26 January 2001 Gujarat Earthquake. Earthquake Spectra Vol. 20, No. 1: 145–169. Takagi, M., & Shimoda, H. 2004. Handbook of Image Analysis: Revised Edition. University of Tokyo Press (in Japanese). United States Agency for International Development (USAID), 2004. http://www.usaid.gov/iran/ United States Geological Survey (USGS), 2003. http://earthquake.usgs.gov/recenteqsww/Quakes/uscvad Yamazaki, F., Kouchi, K., Matsuoka, M., Kohiyama, M., & Muraoka, N., 2004. Damage detection from high-resolution satellite images for the 2003 Boumerdes, Algeria Earthquake. 13th World Conference on Earthquake Engineering CD-ROM, Paper No. 2595, 13p.
1700
© 2005 Millpress, Rotterdam, ISBN 90 5966 040 4