INTERNATIONAL JOURNAL OF GERIATRIC PSYCHIATRY Int J Geriatr Psychiatry 2002; 17: 510–518. Published online in Wiley InterScience (www.interscience.wiley.com). DOI: 10.1002/gps.650
Data management and quality assurance for an International project: the Indo–US Cross-National Dementia Epidemiology Study Rajesh Pandav1,2, Arun Mehta3, Steven H. Belle1, Deborah E. Martin1, Vijay Chandra1,2, Hiroko H. Dodge1 and Mary Ganguli1,4* 1
Department of Epidemiology, University of Pittsburgh Graduate School of Public Health, Pittsburgh, PA, USA Centre for Ageing Research in India, New Delhi, India 3 Indata Com Pvt. Ltd., New Delhi, India 4 Division of Geriatrics and Neuropsychiatry, Department of Psychiatry, University of Pittsburgh School of Medicine, Pittsburgh, PA, USA 2
SUMMARY Background Data management and quality assurance play a vital but often neglected role in ensuring high quality research, particularly in collaborative and international studies. Objective A data management and quality assurance program was set up for a cross-national epidemiological study of Alzheimer’s disease, with centers in India and the United States. Methods The study involved (a) the development of instruments for the assessment of elderly illiterate Hindi-speaking individuals; and (b) the use of those instruments to carry out an epidemiological study in a population-based cohort of over 5000 persons. Responsibility for data management and quality assurance was shared between the two sites. A cooperative system was instituted for forms and edit development, data entry, checking, transmission, and further checking to ensure that quality data were available for timely analysis. A quality control software program (CHECKS) was written expressly for this project to ensure the highest possible level of data integrity. Conclusions This report addresses issues particularly relevant to data management and quality assurance at developing country sites, and to collaborations between sites in developed and developing countries. Copyright # 2002 John Wiley & Sons, Ltd. key words — epidemiology; quality control; India; developing countries
INTRODUCTION Data management and quality assurance play a vital but often neglected role in ensuring high quality research. Very few previous reports or guidelines address data management issues in developing country settings (Reitmayer et al., 1987; Roberts et al., * Correspondence to: Dr M. Ganguli, WPIC, 3811 O’Hara Street, Pittsburgh, PA 15213-2593, USA. Tel: 412/383-9583. Fax: 412/ 383-9587. E-mail:
[email protected] Contract/grant sponsor: National Institute on Aging, NIH, US DHHS. Contract/grant numbers: AG07562 and AG09292. Copyright # 2002 John Wiley & Sons, Ltd.
2000). This paper discusses the practical issues involved in setting up a data management system, including quality assurance procedures, for a crossnational study involving a developing country site. The Indo–US Cross-National Dementia Epidemiology Study (referred to hereafter as the Indo–US Study) was a collaborative project undertaken from 1991–1999 by the University of Pittsburgh, Pittsburgh, PA, USA, and the Centre for Ageing Research, India (CARI) in New Delhi, India, under an NIH program of funding for cross-national investigations of the epidemiology of Alzheimer’s disease and other dementias of later life. The objectives included development of instruments suitable for screening Received 5 June 2001 Accepted 2 October 2001
511
data management: indo–us study and clinical evaluation for dementia in a largely illiterate, elderly, Hindi-speaking population in Ballabgarh (India); determination of prevalence and incidence of, and risk factors for, dementia in Ballabgarh; and judicious comparisons of these data with those collected in the sister study (reference population) in the mid-Monongahela Valley (USA). We have previously reported conceptual and practical issues in studying the epidemiology of dementia in developing countries (Chandra et al., 1994, 1998a), methodology for, and norms on, the various new instruments (cognitive, functional, and depression measures) (Ganguli et al., 1995, 1996, 1999; Fillenbaum et al., 1999) as well as prevalence and incidence of, and risk factors for, dementia (Chandra et al., 1998b, 1998c, 2001; Ganguli et al., 2000a). We now describe critical aspects of data management and quality control that made the scientific work possible. BACKGROUND The study population in India consisted of 5126 subjects, age 55þ, from a rural community of 28 villages in Ballabgarh in Northern India, approximately 35 kilometers from New Delhi. The reference US study population is from the rural mid-Monongahela Valley near Pittsburgh, in southwestern Pennsylvania. A cohort drawn from this population has been involved since 1987 in an ongoing prospective community study of the epidemiology of dementia, known as the Monongahela Valley Independent Elders Survey (MoVIES Project) (Ganguli et al., 2000b). Responsibility for data management was shared between New Delhi and Pittsburgh sites: the Epidemiology Data Center at the Department of Epidemiology, Graduate School of Public Health, University of Pittsburgh, Pennsylvania, USA, and the Centre for Ageing Research (CARI) in New Delhi, India. Epidemiology Data Center, University of Pittsburgh The Epidemiology Data Center (EDC) coordinates and manages data from the MoVIES project and several multicenter epidemiological studies and clinical trials, registries, and case control studies. EDC staff include biostatisticians, applied mathematical statisticians, epidemiologists (some with clinical backgrounds), system analysts, programmers, data managers, data entry personnel, and clerical personnel. A major focus of the EDC has been the development and refinement of standard computing, data management, and statistical procedures and models. Such procedures and models enable shorter and more efficient start-up time on Copyright # 2002 John Wiley & Sons, Ltd.
new projects, and promote a high degree of ongoing quality control for research. CARI Data Management Center, New Delhi A new data management center for the Indian site was established at CARI in New Delhi. Members of the CARI data management team visited Pittsburgh to observe procedures followed at the EDC with a view to establish parallel procedures at CARI. Members of the EDC team also visited the Indian site to examine local conditions, resources, and needs. The CARI data management team (project director, project coordinator, information technology consultant, data entry specialist, and office manager) developed and underwent a program of intensive orientation and training. As data management procedures were designed, they were documented in an operations manual that was updated as necessary and reviewed periodically throughout the course of the project. Regular communication between the two data management centers was recognized as essential. It was carried out to the extent possible by electronic mail, failing which facsimile transmission was used during off-peak hours. Telephonic communication was kept to a minimum because of the high cost of long-distance calls during peak hours, and also the 10.5–11.5 hour time zone difference between the two sites. Data Management and Quality Assurance procedures Procedures were based on the principle that data management begins during the design of the data collection protocol and ends only after the final database for statistical analysis and data archiving is complete (Gassman et al., 1995). Quality assurance procedures were built into the data management system as far ‘upstream’ as possible, and carried out concurrently with other data management activities, for timely detection and resolution of errors in the data. The Indo–US Study faced some unique scientific challenges. The Indian study participants were illiterate and spoke only the local Haryanvi dialect of Hindi. Thus, substantial translation and cultural modification were required to the original Englishlanguage instruments used in the MoVIES study. The field workers who collected the data were area residents with no more than high school education themselves, and required a specialized program of intensive training in test administration and data collection. Following strict protocol, they collected the raw data on forms which were then scored and coded by appropriately qualified study personnel (medical Int J Geriatr Psychiatry 2002; 17: 510–518.
512
r. pandav et al.
officer and clinical neuropsychologist). Given the novelty of these procedures, test development—and therefore form development—went through several iterations, with analysis of data from each iteration, and repeated modification until the new instruments were deemed satisfactory for the study’s scientific purposes (Ganguli et al., 1995, 1996; Fillenbaum et al., 1999). All of these considerations had to be reflected in the design of the data collection forms and database, and in related quality control procedures. Several forms were used for data collection: a demographic/identifying information and exposure/ risk factor profile form, a cognitive screening form, a functional ability questionnaire form, a diagnostic protocol form, a diagnostic summary form, a death report form, lab studies forms, ‘off-protocol’ forms identifying participants who later dropped out due to death, relocation, etc. This study therefore involved the entry of multiple variables collected at different times on different forms for a large number of subjects. Thus, it was essential that data management begin at the time of form/questionnaire development. The steps of data management and quality assurance followed throughout the study are detailed below. DESIGN OF DATA COLLECTION FORMS Content of forms: both teams The content of all data collection forms was first determined by consensus among investigators and consultants from both sites and finalized in English. It was then translated into Hindi and independently back-translated into English to validate the translation and clarify ambiguities. Each of the above steps was carried out during four phases of pre-testing involving 30 volunteer subjects in each phase, followed by pilot testing on a age-stratified random sample of 100 subjects drawn from the Ballabgarh census database. A final field-testing of the forms was carried out in a random sample of about 350 individuals, and then the prevalence survey was carried out, using the finalized instruments, in a sample of over 5000 persons. For each phase, new or modified forms were developed and the steps below were systematically carried out.
verbatim responses to questions, and also any additional comments/observations. Since some of the data collected by field workers were not intended for entry into the database, a separate double-bordered box, along the right margin of the form, was reserved for codable values. This allowed the data entry specialist to enter values only from that demarcated box, minimizing errors and ambiguities. Once each data collection form was finalized, a detailed instruction manual was prepared for the use of field workers, and a separate coding manual prepared for the coders. These manuals included efforts to take into consideration all possible responses that might be obtained from subjects in response to a given query or test. Codes were finalized for data that might be ‘missing’ for different reasons (e.g. refused, untestable because blind) on each variable. CONFIRMATION OF FINALIZED FORMS: PITTSBURGH TEAM All the finalized scales and questionnaires, instruction manuals for the data collectors (field workers), and coding manuals for the coders (medical officer and psychologist) were then sent to the Pittsburgh team for review. Any concerns, discrepancies, additions, and deletions were discussed and sent back to India. Once these were resolved the Pittsburgh team signed off on a standardized approval form. PREPARATION OF DATA ENTRY FILES AND SELECTION OF VARIABLE NAMES: NEW DELHI TEAM EpiInfo 5, a public domain software package developed and distributed by the Centers for Disease Control (CDC) of the US Public Health Service, was selected for data entry. After final approval of the forms, data entry files were prepared using EpiInfo. Particular care was taken to design data entry screens which visually matched the data collection form, to minimize data entry errors. Variable names for each item were allocated such that they were easily recognized and matched to the corresponding questions/items on the forms, to facilitate crossverification between raw data and data entered.
Format of forms: New Delhi team Once content had been agreed upon, the data collection forms were designed at the New Delhi site with a primary emphasis on minimizing errors in data collection, coding, and entry. Sufficient space was provided for the field workers to record subjects’ Copyright # 2002 John Wiley & Sons, Ltd.
FINALIZATION AND CONFIRMATION OF DATA PROCESSING DOCUMENTS: NEW DELHI TEAM The data processing documents were prepared in New Delhi with the help of quality control software especially developed for this project (CHECKS program) Int J Geriatr Psychiatry 2002; 17: 510–518.
513
data management: indo–us study Table 1. Features of the CHECKS quality control software program (New Delhi)
i. Requires that errors be rigorously defined, and provides facilities for their definition that allows non-programmers to carry out this function. ii. Allows the definition of data to be conveyed to the computer in the form of checks. iii. Generates a .chk file, which EpiInfo uses at the time of data entry to minimize the entry of erroneous data. iv. Produces a .doc file containing a list of all checks performed by the program in plain English, which the users unfamiliar with computer language can read and discuss, to ensure that the checks they have ‘programmed’ are appropriate, and produces an .err file documenting the errors. v. Runs additional checks, over and above those in EpiInfo, as programmed by the users to ensure that the data were free of those defined errors. vi. Generates a .sum file which: a. indicates which records have passed all tests, b. generates the sum of all numeric fields of the passing records, which can be used at Pittsburgh to verify that data corruption has not occurred (at least into the numeric fields) during the course of data transmission.
by Indata Com. Private Ltd. These documents, containing all variable names and edits (range, logic, and totalling checks) were sent to the EDC. Once these files were checked and finalized, the EDC team signed off on a form documenting that all edit checks were in place. The CHECKS program, a central feature of our quality assurance system, was developed collaboratively between investigators and IT staff at both sites and incorporated the processes shown in Table 1. As
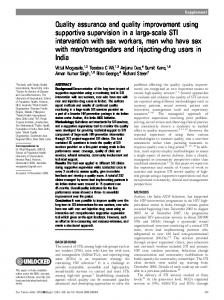
an illustration, Figure 1 shows selected pages of the cognitive screening form while Figure 2 shows selected details of the features of the corresponding CHECKS program. ASSIGNMENT OF UNIQUE ID NUMBER AND LINKAGE VARIABLES: NEW DELHI TEAM Each study participant was assigned a unique identifying number (STUDYNO1). Considering the large
Figure 1. Cognitive Screening Form—Selected Pages (see Figure 2 for the corresponding CHECKS screen) Copyright # 2002 John Wiley & Sons, Ltd.
Int J Geriatr Psychiatry 2002; 17: 510–518.
514
r. pandav et al.
Figure 2. Selections from the CHECKS screen and the documentation of checks and errors for the Cognitive Screening Form (see Figure 1)
number of forms collected on each subject, five identifying variables (STUDYNO1, Age, Sex, Caste, Village) were included on all the forms and used to link different forms containing information from the same subject. DATA COLLECTION AND CODING: NEW DELHI/BALLABGARH TEAM Data collection on each form began only after all Steps above were completed for that form. Each day, after data from a given village were collected, they were first checked for completion by the field workers themselves, and then brought to the project office at the field site in Ballabgarh where the field supervisor re-checked the forms for completeness and accuracy. Upon completion of a set, generally 60 forms (one week’s work), the field supervisor brought the forms to the CARI head office in New Delhi where they were coded by the medical officer and neuropsychologist (as applicable). This routine facilitated smooth and predictable data flow. Copyright # 2002 John Wiley & Sons, Ltd.
DATA ENTRY AND VERIFICATION: NEW DELHI TEAM Double entry of data was performed by two different key entry persons in two separate files. Using EpiInfo, these files were then compared to identify discrepancies, which were then resolved by examining the raw data forms. After a data entry file was finalized, the on-site data manager ran the CHECKS software program to detect logic, out-of-range, and totaling errors within each form (intra-form edits) (see Figure 2). The project coordinator (medical officer) examined the CHECKS error report, checked the raw data forms and corrected them if necessary, initialing and dating the correction. The correction was then made in the database and the CHECKS program was run again. If no further data inconsistencies were detected, the files were prepared for transmission to the EDC in Pittsburgh. The above process averaged one week from data entry to transmission and three weeks from data collection to transmission. Int J Geriatr Psychiatry 2002; 17: 510–518.
515
data management: indo–us study DATA TRANSMISSION TO EDC: NEW DELHI TEAM Data were transmitted on a fixed weekly schedule by electronic mail using X-mail, a software package developed by the Department of Electronics, Government of India. Several data files were transmitted at a time along with a ‘readme’ file containing the names of all the accompanying data files. When e-mail was not feasible, e.g. when telephone lines went down during the monsoons, backup data transmission occurred by means of diskettes sent by courier mail. DATA PROCESSING AND VALIDATION: PITTSBURGH TEAM Upon receipt of the data in Pittsburgh, the EDC transmitted a confirmation e-mail message to CARI listing all the files that had been received. Any discrepancy between files sent (as per the ‘readme file’) and files
received was noted, and a report sent to CARI, identifying files that required retransmission. Data validation routines were then initiated at the EDC for missing data, duplicate data, logic errors and range errors. An edit report was generated indicating the location and type of errors or inconsistencies detected. This deliberate validation/edit system redundancy also guarded against corruption of data, which may have occasioned during data transmission. Inter-form edits, run only at the EDC, also identified any errors not detected by quality control procedures at CARI. The main quality assurance procedures followed at the EDC after the data were received from CARI are shown in Tables 2 and 3. The final quality control procedures were performed at the EDC because of the collaborative cross-national nature of the project. The EDC had the responsibility for statistical analyses of the data, including comparisons of the Ballabgarh data with the Monongahela Valley data which were also managed and analyzed at the EDC.
Table 2. Quality Assurance Procedures at the Epidemiology Data Center (Pittsburgh) a. Inter form and Intra-form edits: Intra-form edits examined potential errors by checking the logic/consistency of data entered within each form. This step also served as a double-check for the intra-form edits which were already run in India. Inter-form edits examined data accuracy by checking the logic/consistency of the data across multiple forms. (See Table 3 for examples.) b. Missing data form: A ‘missing data form’ was used to distinguish pending data sets (e.g. when a given subject’s assessment had yet to be performed and the data would eventually become available) from true missing data sets (e.g. when a subject had refused to undergo the assessment and the data would never be available). If this form indicated the data were missing because the subject had died, a reminder would be generated that a ‘death form’ (date and circumstances of death) should be entered. c. Off-Protocol form: An ‘off protocol form’ was created to identify (a) those area residents who could not be reached for recruitment, thereby allowing us to explain discrepancies between the CRHSP census database and our study participant database; (b) those who initially participated but later left the study due to death, relocation, etc. d. Pending data: At the end of each study phase, EDC checked to ensure that all data had been received e.g., if a blood draw was shown as performed, the blood test results should be included in the database. e. Double entry of sample records: A random sample (10% of data transmitted that month) of records was double entered at the EDC.
Table 3. Examples of Intra-form and Inter-form edits Intra-form edits examined potential errors by checking the logical/consistency of data entered within each form. For example: All the data should be within the specified ranges, including missing values. Interview date and birth date should be within the expected date ranges. If the coding of one variable was based on the values of another variable, and a discrepancy was noted, an error report was sent to the Indian site for verification. Inconsistency in dates; e.g. The estimated age of onset of dementia had to be consistent with the duration of dementia, by taking into account age at the time of dementia diagnosis. Inter-form edits examined data accuracy by checking the logic/consistency of the data across multiple forms. For example: In the VISION AND HEARING form, we asked whether the subject has vision impairment. If this form indicated no vision impairment, but the COGNITIVE form indicated the subject states he/she was unable to see the objects during the Object Naming Test, the variable was flagged for CARI to verify.
Copyright # 2002 John Wiley & Sons, Ltd.
Int J Geriatr Psychiatry 2002; 17: 510–518.
516
r. pandav et al.
RESOLUTION OF ERROR REPORTS: NEW DELHI TEAM When quality assurance procedures at the EDC site detected a potential discrepancy, an ‘error report’ was sent to CARI. At CARI, appropriate personnel examined the raw data forms and the database to identify and resolve the problem. It was strongly emphasized that all discrepancies were not necessarily true ‘errors’ but might be due to unexpected circumstances for a given participant. However, all discrepancies had to be flagged, individually scrutinized, and either corrected or verified. Corrections to the forms were initialed, dated, and faxed to the EDC. The record file was then updated and transmitted to the EDC the following week. DUAL ENTRY OF RANDOM SAMPLE: PITTSBURGH TEAM Initially, every month the EDC sent CARI a list of randomly selected subjects (10% of the data transmitted that month) and requested photocopies of the raw data forms for these subjects to be sent by courier mail for dual entry at the EDC. As no discrepancies were noted between the data entered at CARI and EDC during the first (‘instrument development’) phase, in the second (‘prevalence’) phase only a 5% sample was sent to EDC, and the procedure was discontinued in the third (‘incidence’) phase of the study. HUMAN SUBJECTS PROTECTION We obtained informed consent according to the protocols approved by the University of Pittsburgh Institutional Review Board and the CARI Human Volunteers Protection Committee. Where there were differences in the polices of the two bodies, they were resolved by extensive discussions, emphasizing both protection of subjects and sensitivity to local culture and circumstance, including the fact that most participants were illiterate. We have previously discussed in more detail the issues involved in obtaining informed consent and avoiding coercion in populations of developing countries (Chandra et al., 1994, 1998a). DISCUSSION Our experience suggests that, despite the limitations in the work environment of a developing country, high-quality data can be obtained if practical quality assurance procedures are in place. Establishment of a regular system of data collection and checking at the Copyright # 2002 John Wiley & Sons, Ltd.
village sites, and delivery of these paper records in batches to New Delhi for coding, made possible the timely entry, computerized checking, and correction of data. Another system was established for regular transmission of data on a weekly basis to the EDC at Pittsburgh, again allowing timely validation of data and correction of errors. It is important to note here that all of the above processes were developed and standardized during the initial pre-testing and pilot phases of the study, when a relatively limited amount of data were being collected. Large field studies should have sufficient lead-time allocated for such standardization of data management procedures. The development of the specialized software program (CHECKS) to check data at the New Delhi site introduced quality control principles into the data verification process. The use of this program was initiated during the pilot phase and played a key role in minimizing data errors at the CARI site. Indeed, the numbers of errors in transmitted data were reduced considerably after its introduction. The basic principle of CHECKS program was modeled on that of zero-defect manufacturing, as applied in industry. The system allows the researcher to define, and communicate, the definition of an error, and then receive data that are free of those defined errors. Once the program had successfully passed the quality assurance procedures, it could be relied upon to check for errors as detailed in its own output; and there was no further need for the researcher to rely on the programmer (Mehta, 2000). Documentation of all data management procedures was developed concurrently with the study protocol and with subsequent protocol clarifications and modifications. This process prevented delays, protocol violations, and errors in data, which could have occurred because of, for example, turnover in data entry or management personnel during the study. The scientific objectives of the Indo–US Study required that data be collected in India, a developing country, and compared with data from the US. Besides the specific hypotheses to be tested by such cross-national comparisons, there were also logistic advantages to conducting the study in India. These included the large and cooperative study population, the relatively low cost of recruitment and retention of highly motivated and dedicated staff, and the availability of world-class information technology. There were also logistic challenges, including some particularly relevant to data management. Our experience suggests that the special needs of establishing a data management center in a developing country should be considered from the outset. For example, certain types Int J Geriatr Psychiatry 2002; 17: 510–518.
data management: indo–us study or brands of computer equipment and supplies might be more difficult and expensive to obtain and maintain than others. To the extent possible, study design should avoid the use of software that cannot run on locally available machines. At the same time, caution should be exercised to avoid the inadvertent acquisition of illegal or defective equipment and software. Other special needs might include power surge protectors to defend against unreliable power supply and frequent voltage spikes, and generators to provide backup power supply because of frequent and prolonged power outages. Further issues to consider include time zone difference between the two sites, making it difficult to communicate in real time, and frequent problems in telecommunication because of damaged telephone lines because of heavy monsoon rains. Yet another important issue related to communication between sites is the need for awareness of both sites’ work hours and schedules. For example, Saturday is a normal working day in India but not in the US, and the two countries observe different holidays. A small but potentially critical point is that the date is conventionally indicated as day/month/ year in India, as opposed to month/day/year in the US. In many ways, our experiences in India were similar to those of Roberts et al. (2000) in Nigeria. In our experience, it is important for investigators and data management personnel to be culturally sensitive towards study participants as well as co-workers at both sites, and to recognize the conditions and constraints under which researchers work in developing countries. An informal newsletter and regular site visits by personnel from both sites contributed to improved understanding of the working environments of both countries, and enhanced team spirit within and across sites. This team approach was critical to the ultimate objective of establishing a data management system, which provided high quality data for analysis in a timely fashion, and greatly enhanced the productivity of the project. ACKNOWLEDGEMENTS The work reported here was supported in part by grants # AG07562, and AG09292 from the National Institute on Aging, NIH, US DHHS. At the University of Pittsburgh (Pittsburgh, PA, USA) Dr Graham Ratcliff, Dr Christopher Ryan, and Dr Carol Baker for cognitive test development; Dr Janet Johnston for her key role in data management and analysis; Mr Thomas Meshanko, and Mr Patrick Kalcevic for data management; Ms Catherine Moran for overall project management; Mr Jack Copyright # 2002 John Wiley & Sons, Ltd.
517
Doman for his comments on the manuscript. At WHO, Geneva, Dr R. Srinivasa Murthy for comments on the manuscript. At Duke University (Durham, NC, USA), Dr Gerda Fillenbaum for leadership in development of the functional ability screening scale and for her comments on this manuscript. In New Delhi and Ballabgarh, Dr Sujatha Sharma for her role in cognitive test development and for supervision and training of field workers in cognitive screening; Dr L. M. Nath for overall guidance; Mr B. S. Nair and Mr Binu for assistance with project administration and data entry; Mr R. K. Kaushik for project coordination; Mr Roshan Lal, Mr Gajraj Singh, Mr Desh Raj, Mr Vijay Ram, Mr Suresh Kumar and Mr Mast Ram for field work and data collection. We are also grateful for the cooperation extended by Dr Suresh Kapoor, Mr Guresh Kumar, and other staff of the Comprehensive Rural Health Services Project (Centre for Community Medicine, All-India Institute of Medical Sciences, New Delhi) for access to their Ballabgarh facilities and census database. Finally, we acknowledge the cooperation of the senior citizens of Ballabgarh for their participation in the Indo–US Study. Parts of this work were previously presented at the following two scientific meetings: (1) Kalcevic P., Mehta A., Echement D., Meshanko T., Pandav R., Chandra V., Ganguli M., Belle S. Establishing a cross-national and cross-cultural information system with sites in the US and India. Poster presented at The Society for Clinical Trials, 20th Annual Meeting, Anaheim, California, USA, May 2–5, 1999. (2) Mehta A. obtaining error free data for epidemiology. In Ganguli M. and Kalyanasundaram S., ‘The Indo–US Dementia Epidemiology Study: Objectives, Methods, and Implications.’ Symposium presented at the Annual National Conference of the Indian Psychiatric Society (ANCIPS-2000), Kochi, India, 22 January 2000. Informed consent was obtained from all study participants according to procedures approved by the University of Pittsburgh Institutional Review Board, and by the Human Volunteers Protection Committee of the Centre for Ageing Research, India. REFERENCES Chandra V, Ganguli M, Ratcliff G, et al. 1994. Studies of the epidemiology of dementia: comparisons between developed and developing countries. Aging (Milano) 6: 307–321.
Int J Geriatr Psychiatry 2002; 17: 510–518.
518
r. pandav et al.
Chandra V, Ganguli M, Ratcliff G, et al. 1998a. Practical issues in cognitive screening of elderly illiterate populations in developing countries. The Indo–US Cross-National Dementia Epidemiology Study. Aging (Milano) 10: 349–357. Chandra V, Ganguli M, Pandav R, Johnston J, Belle S, DeKosky ST. 1998b. Prevalence of Alzheimer’s disease and other dementias in rural India. The Indo–US Study. Neurology 15: 1000–1008. Chandra V, DeKosky S, Pandav R, et al. 1998c. Neurological factors associated with cognitive impairment in a rural elderly population in India. The Indo–US Cross-National Epidemiology Study. J Geriartr Psychiatry Neurol 11: 11–17. Chandra V, Pandav R, Dodge HH, et al. 2001. Incidence of Alzheimer’s disease in India: the Indo–US Study. Neurology 57: 985– 989. Fillenbaum G, Chandra V, Ganguli M, et al. 1999. Development of an activities of daily living scale to screen for dementia in an illiterate rural older population in India. Age Ageing 28: 161–168. Ganguli M, Ratcliff G, Chandra V, et al. 1995. A Hindi version of the MMSE: the development of a cognitive screening instrument for a largely illiterate rural elderly population in India. Int J Geriatr Psychiatry 10: 367–377. Ganguli M, Chandra V, Ratcliff G, et al. 1996. Cognitive test performance in a community based nondemented elderly sample in rural India: the Indo–US Cross-National Dementia Epidemiology Study. Int Psychogeriatr 8: 507–524.
Copyright # 2002 John Wiley & Sons, Ltd.
Ganguli M, Dube S, Johnston J, Pandav R, Chandra V, Dodge HH. 1999. Depressive symptoms, cognitive impairment and functional impairment in a rural elderly population in India: a Hindi version of the Geriatric Depression Scale (GDS-H). Int J Geriatr Psychiatry 14: 807–820. Ganguli M, Chandra V, Kamboh MI, et al. 2000a. Apolipoprotein E polymorphism and Alzheimer disease. The Indo–US CrossNational Dementia Study. Arch Neurol 57: 824–830. Ganguli M, Dodge HH, Chen P, Belle S, DeKosky ST. 2000b. Ten year incidence of dementia in a rural elderly US community population: the MoVIES Project. Neurology 54: 1109–1116. Gassman JJ, Owen WW, Kuntz TE, Martin JP, Amoroso WW. 1995. Data Quality Assurance, Monitoring, and Reporting. Control Clin Trials 6: S104–S136. Mehta A. 2000. Obtaining error free data for epidemiology. In The Indo–US Dementia Epidemiology Study: Objectives, Methods, and Implications, Ganguli M, Kalyanasundaram S (eds). Symposium presented at the Annual National Conference of the Indian Psychiatric Society (ANCIPS-2000), Kochi, India, 22 January 2000. Reitmaier P, Dupret A, Cutting WA. 1987. Better health data with a portable microcomputer at the periphery: an anthropometric survey in Cape Verde. Bull World Health Organ 65: 651–657. Roberts RJ, Musick BS, Olley B, Hall KS, Hendrie HC, Oyediran AB. 2000. Data management in a longitudinal cross-cultural study. Stat Med 19: 1645–1649.
Int J Geriatr Psychiatry 2002; 17: 510–518.