ated using real data collected from our MavHome smart home and smart office environments. Index TermsâData mining, hierarchical Markov models, pre-.
IEEE TRANSACTIONS ON SYSTEMS, MAN, AND CYBERNETICS—PART C: APPLICATIONS AND REVIEWS, VOL. 37, NO. 4, JULY 2007
561
Data Mining for Hierarchical Model Creation G. Michael Youngblood and Diane J. Cook, Senior Member, IEEE
Abstract—In this paper, we examine the problem of learning inhabitant behavioral models in intelligent environments. We maintain that inhabitant interactions in smart environments can be automated using a data-driven approach to generate hierarchical inhabitant models and learn decision policies. To validate this hypothesis, we have designed the ProPHeT decision-learning algorithm that learns a strategy for controlling a smart environment based on sensor observation, power line control, and the generated hierarchical model. The performance of the algorithm is evaluated using real data collected from our MavHome smart home and smart office environments. Index Terms—Data mining, hierarchical Markov models, prediction, smart homes, user modeling.
I. INTRODUCTION ESIGNING systems with robust intelligence that are capable of perceiving, reasoning, learning, and interacting with their environment has been a pervasive goal of artificial intelligence researchers. Often, however, these researchers find that ideas tested on small problems or in simulation do not scale well to larger, complex, real-world problems. As an example, Markov models provide a useful representation of system behavior. When used to model larger problems, they sometimes face difficulties of accurately modeling complex interactions between components of the system. Learning algorithms built on these models also experience performance issues when scaled to large problems. Utilizing a hierarchy improves scalability, but most uses of a hierarchical model have relied upon manual construction of the hierarchy. We introduce a new method of automatically constructing hierarchical hidden Markov models (HHMMs) using the output of a sequential datamining algorithm. Repetitive behavioral actions in sensor-rich environments such as smart homes can be observed and categorized into patterns through data-mining techniques. These discoveries form the necessary abstractions for a hierarchical model of inhabitant behavior, which, then, provides a basis for learning an automation strategy. In this paper, we introduce the ProPHeT algorithm that learns a policy for controlling a smart environment based on patterns mined from inhabitant action histories. We show how a model hierarchy can be built automatically from observation data, and
D
Manuscript received February 18, 2006; revised April 27, 2006. This work was supported in part by the National Science Foundation under Grant IIS0121297 and Grant EIA-9820440. This paper was recommended by Associate Editor S. H. Rubin. This paper has supplementary downloadable material available at http://ieeexplore.ieee.org, provided by the authors. This includes two AVI video clips. This material is about 2.8 MB in size. G. M. Youngblood is with the Department of Computer Science, University of North Carolina, at Charlotte, Charlotte, NC 28223 USA (e-mail: youngbld@ uncc.edu). D. J. Cook is with the School of Electrical Engineering and Computer Science, Washington State University, Pullman, WA 99164 USA (e-mail: cook@eecs. wsu.edu). Digital Object Identifier 10.1109/TSMCC.2007.897341
demonstrate how the resulting hierarchy forms the basis of a reinforcement learning approach to learning an environment control strategy. We evaluate the performance of this learned strategy by measuring the reduction in manual control of an automated apartment. We also demonstrate the power of the data-driven approach to refining the hierarchical model based on changes in the underlying patterns or feedback from the user. We present the application and validation of our approach in our MavHome smart environments. II. HIERARCHICAL PARTIALLY OBSERVABLE MARKOV DECISION PROCESSES Markov decision processes (MDPs) are popular methods of modeling a system’s interactions with its environment. They also provide a mathematical foundation for applying reinforcement learning techniques to learn a policy for controlling an environment. Because they capture the underlying stochasticity of a domain, and can account for multiple, possibly conflicting task goals, they are an excellent model for smart environments [1]. Hidden Markov models, in which each state encapsulates possibly unseen events that are hidden from the observer, are the method of choice for applications such as speech and handwriting recognition [2], [3], language modeling [4], and computational molecular biology [5]. They also provide a foundation for learning strategies to accomplish a task in a real-world environment such as robot navigation [6]. Smart environments present unique challenges to machinelearning and decision-making algorithms. One is the curse of dimensionality [7]. The state space of an intelligent environment is quite large. For example, if we were to examine a very small environment with 10 motion sensors and 5 lights for a total of 15 binary-state objects, the model would encompass 215 = 32 768 unique states. If we can reason about each one for 0.01 s, it would take 5.46 min to make a decision. The MavHome environments contain about 2150 = 1.43 × 1045 unique states. The size of the problem space makes it difficult to develop real-time reasoning for intelligent environments. HHMMs, first introduced by Fine et al. [8], are useful for addressing this challenge. Hierarchical models can improve the performance of learning algorithms applied to the model, and facilitate the reuse of portions of the learned task for new problems. The hierarchical hidden nodes also enable better modeling of the different stochastic levels and scales of tasks that are found in smart environments. For example, if an inhabitant reads, listens to music, and watches television all in the same room with a particular light on, a generalization of these tasks may simply automate the shared light while missing desired automation of the CD player or television. The hierarchical model can group the different tasks into separate abstract states. The result more accurately reflects the inhabitant model.
1094-6977/$25.00 © 2007 IEEE
562
IEEE TRANSACTIONS ON SYSTEMS, MAN, AND CYBERNETICS—PART C: APPLICATIONS AND REVIEWS, VOL. 37, NO. 4, JULY 2007
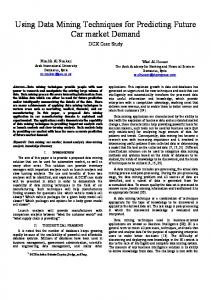
Fig. 1. MavHome Steve pattern 1 (lab entry to desk) and pattern 2 (going on break). In this visualization, sensors starting with “V” are motion or door sensors, the other sensors are X10 units.
Fig. 2.
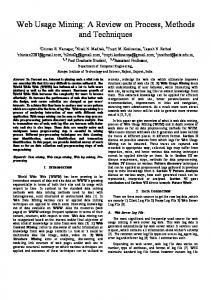
MavHome Steve HHMM structure, abstract nodes only.
MavHome Steve pattern 1 (lab entry to desk) and pattern 2 (going on break). In this visualization, sensors starting with “V” are motion or door sensors, the other sensors are powerline controllers (X10 units). Using an HHMM, a Markov chain of inhabitant activities corresponding to watching television may be grouped together in a hierarchy with similar patterns. Eventually, all activities in a house fall under the root node of the hierarchy. Consider an example following a virtual inhabitant, MavHome Steve, who works in the MavLab. MavHome Steve has a routine for his work life, which contains six unique patterns. These patterns include: 1) lab entry to desk, as shown in Fig. 1 (left), 2) going on break, as shown in Fig. 1 (right), 3) going off break, 4) go to alternate workstation, 5) return from alternate workstation, and
6) leave lab from desk.1 These patterns occur with a probability defined by the HHMM shown in Fig. 2. Each oval in this figure represents an abstract node and squares represent end nodes. Transitions are represented as solid arrows labeled with the probability of the transitions. Automatic transitions, those that are always made once the source node is reached, are shown as dashed arrow. From the time hierarchical Markov models were introduced, they have been heavily used for complex modeling and learning problems [9]–[11]. In the majority of these studies, the 1 An animation of MavHome Steve’s patterns is shown in Attachment 1. This supplementary AVI is available for download at http:/ieeexplore.ieee.org. The file is 1.77 MB.
YOUNGBLOOD AND COOK: DATA MINING FOR HIERARCHICAL MODEL CREATION
Fig. 3.
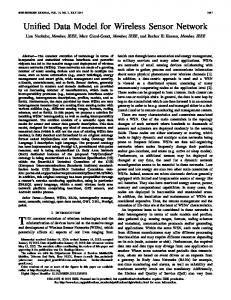
MavHome as an intelligent agent.
hierarchical structure is defined in advance [4], [6], [12]–[14]. Some notable exceptions are the work by Sun and Sessions [15], which segments sequences into a hierarchy based on reinforcement received during task execution, an approach by Hauskrecht et al. [10], which abstracts sequences into macro-actions, work of Pineau et al. [16], which groups actions together based on structure inherent in the domain, and the approach of Xie et al. [17] to split and merge states using statistical techniques. None of these approaches, however, represent a data-driven method of learning hierarchical model structure. This means that these earlier approaches assume sufficient a priori knowledge to preconstruct the HHMM. Given the size of an intelligent environment problem space and the desire to minimize model contamination from knowledge engineering, we need to seed our model with structure derived through data collected in the environment. Once we build an HHMM, we want to use this model to learn a policy for controlling the environment. In order to facilitate policy learning, we associate actions and rewards with the transitions between the states in the model. As a result, the model is best described as a hierarchical partially observable Markov decision process (HPOMDP). III. APPLICATION: THE MAVHOME SMART HOME Individuals spend a majority of their time in a home or workplace [18], and for many, these places are our sanctuaries. As such, observations made in these settings are insightful glances into our lives, and these observations may, in turn, be useful in improving the quality of the environments. Since the beginning, people have lived in places that provide shelter and basic comfort and support, but as society and technology advance, there is a growing interest in improving the intelligence of the environments in which we live and work. The MavHome (managing an adaptive versatile home) project is focused on providing smart environments. We define an intelligent environment as one that is able to acquire and apply knowledge about its inhabitants and their surroundings in order to adapt to the inhabitants and improve their experience in the environment. We treat an environment as an intelligent agent, as shown in Fig. 3, which perceives the state of the environment using sensors and acts upon the environment using device controllers (in our case, powerline controllers) in order to achieve its goals. The goals of these environments are to maximize comfort of the inhabitants, minimize the consumption of resources, and maintain the safety of the environment and its inhabitants. In this paper, we focus on one quantifiable goal: minimizing the number of manual interactions needed to control the environment.
563
As the need for automating these personal environments grows, so does the number of researchers investigating this topic. Some design interactive conference rooms, offices, kiosks, and furniture with seamless integration between heterogeneous devices and multiple user applications in order to facilitate collaborate work environments [19]–[22]. Abowd and Mynatt’s work [23] focuses on ease of interaction with a smart space, and work such as the Gator Tech Smart House [24] focuses on application of smart environments to elder care. Research on smart environments has become so popular that NIST has identified seamless integration of mobile components into smart spaces as a target area for identifying standardizations and performance measurements [25], although no performance metrics have yet been produced by the group. Mozer’s Adaptive Home [26] uses neural network and reinforcement learning to control lighting, HVAC, and water temperature to reduce operating cost. In contrast, the approach taken by the iDorm project [27] is to use a fuzzy expert system to learn rules that replicate inhabitant interactions with devices, but will not find an alternative control strategy that improves upon manual control for considerations such as energy expenditure. These projects have laid a foundation and provided useful tools for our work. Instead of designing individual supporting technologies, however, we are focusing on constructing an entire environment that acts as an intelligent agent. To do this, we offer a unique scientific contribution by letting hierarchical models created from observed inhabitant activity provide the driving force for learning automation strategies. In order to handle all the complexities of a working intelligent environment, the MavHome architecture is separated into four cooperating layers [28], as shown in Fig. 4. During perception, sensors in the physical layer monitor the environment and make readings availability through the communication layer. The database stores these data in the information layer as more useful knowledge (e.g., patterns, predictions) that is made available as needed to the decision layer. In contrast, action execution originates from the decision layer, and the selected action is stored in the information layer as well as sent through the communication layer to the physical components that execute the command. The action changes the state of the environment, and thus, triggers a new perception/action cycle. Communication between high-level components is performed using CORBA, and each component registers its presence using zero configuration (ZeroConf) technologies. Inhabitant localization is performed using passive infrared sensors that yield a 95% accurate detection rate, and a PostgreSQL database stores sensor readings, prediction and data-mining components, and logical proxy aggregators. Our MavHome implementation and evaluation is based on two real environments and simulated counterparts. The MavLab, shown in Fig. 5, is a room in the Engineering Building at the University of Texas at Arlington (UTA) that is designed to look and operate as an office environment with cubicles, a lounge, a kitchen, a dining area, and a meeting room. The MavPad, shown in Fig. 6, is an apartment on campus that has hosted three volunteer inhabitants.
564
IEEE TRANSACTIONS ON SYSTEMS, MAN, AND CYBERNETICS—PART C: APPLICATIONS AND REVIEWS, VOL. 37, NO. 4, JULY 2007
model. As a result, our emphasis in this paper is on the MavCore components shown in Fig. 4, which are found in the information and decision layers of the architecture. To automate our smart environment, we collect observations of inhabitant activities and manual interactions with the environment. We, then, mine sequential patterns from these data using a sequence mining algorithm, episode discovery (ED). Next, our Active LeZi (ALZ) algorithm predicts the inhabitant’s upcoming actions using observed historical data. Finally, ProPHeT (providing partially observable hierarchical based decision tasks) builds a hierarchical Markov model from low-level state information and ED’s high-level sequential patterns, and uses the model to learn an action policy for the environment. All selected actions are filtered through the arbitrator (Arbiter) to prevent violation of security constraints or user preferences, before being executed. Details of the MavCore algorithms are provided in the next section. IV. DATA MINING FOR MODEL CREATION Here, we describe the individual mining and learning algorithms that comprise MavCore. Through the combination of these techniques, we are able to learn a hierarchical model of inhabitant behavior, predict activities, and learn a policy for controlling the environment, all in a completely unsupervised fashion. Fig. 4.
MavHome software architecture.
MavHome data streams are defined as a four-tuple �t, z, n, l�, where t is the time of the event, z is the device/sensor zone, n is the device/sensor number, and l is the new value of the device/sensor. An example of streaming data captured by one of the MavHome sites is shown as follows.
Data are collected by means of a sensor network, and devices are controlled by powerline controllers. Because of the increased complexity and privacy issues related to video capture, we limited our data collection to this information. Attachment 2 shows a video animation of this information collected for one day in the MavPad apartment.2 As can be seen, these sensor readings provide a great deal of information. We can tell when the inhabitant is watching television, taking a shower, cooking in the kitchen, working on the computer, sleeping restfully, and stirring in his sleep. Our unique contribution to the design of intelligent environment agents lies in the data-driven hierarchical automation 2 This supplementary AVI is available for download at http:/ieeexplore. ieee.org. The file is 1 MB.
A. Mining Sequential Patterns Using ED A smart home inhabitant typically interacts with various devices as part of their routine activities. These interactions may be considered as a sequence of events, with some inherent pattern of recurrence. The role of ED in our model creation is to identify sequential patterns from time-ordered observations of inhabitant activities. Given an input stream O consisting of a time-ordered sequence of events, ED performs the steps shown as follows. 1) Partition O into maximal episodes. 2) Create candidate episode patterns from the maximal episodes. 3) Determine the compression value for each candidate. 4) Identify interesting patterns by selecting candidates with the top compression values. In an approach that is loosely modeled after the sequential mining algorithm of Srikant and Agrawal [29], we move a window in a single pass through the history of activities or events, looking for episodes (sequences) within the window that merit attention. ED accumulates the maximum number of events that occur within the window time frame into a maximal episode. A candidate episode is created to represent each unique maximal episode as well as each subset of a maximal episode. Candidate episodes are collected together with frequency information for each candidate. These candidate patterns are evaluated and the episodes with values above a minimum acceptable compression amount are reported. The size of the moving window can be specified by the user or automatically determined by ED. Given sufficient support from the databases, pattern compression should increase with the size of the pattern. As a result, ED samples window sizes from small to large and select the
YOUNGBLOOD AND COOK: DATA MINING FOR HIERARCHICAL MODEL CREATION
565
Fig. 5. MavLab workplace environment. The lab is equipped with temperature, light, and motion sensors, and can control all lights, appliances, fans, heaters, and window blinds.
current window size when the resulting pattern compression does not continue to increase. When evaluating candidate episodes, ED looks for patterns that minimize the description length of the input stream O, using the minimum description length (MDL) principle [30]. The MDL principle targets patterns that can be used to minimize the description length of a database by replacing each instance of the pattern with a pointer to the pattern definition. MDL theory is somewhat similar in nature to randomization theory [31], which Rubin and Trajkovic [32] enhance using domain-specific knowledge to find patterns in data. The description length (DL) of the input sequence O using the set of patterns Θ is, thus, defined as DL(O, Θ) = DL(O|Θ) + DL(Θ), or the description length of the input sequence compressed using Θ plus the description length of the patterns Θ. The compression of the corresponding encoding can be computed as Γ(Θ|O) = DL(O)/DL(O, Θ). Finding the model that yields the MDL of the data is, thus, equivalent to finding the patterns that provide the largest compression value, or MDL(O) = argmaxΘ {Γ(Θ|O)}. Our MDL-based evaluation measure, thus, identifies patterns that balance frequency and length. Periodicity (daily, every other day, weekly occurrence) of episodes is detected using autocorrelation and included in the episode description. If the instances of a pattern are highly periodic (occur at predictable intervals), the exact timings do not need to be encoded (just the pattern definition with periodicity information), and the resulting pattern yields even greater compression. Although event sequences
with minor deviations from the pattern definition can be included as pattern instances, the deviations need to be encoded, and the result, thus, increases the overall description length. ED reports the patterns and encodings that yield the greatest MDL value. Deviations from the pattern definition in terms of missing events, extra events, or changes in the regularity of the occurrence add to the description length because extra bits must be used to encode the change, thus lowering the value of the pattern. The larger the potential amount of description length compression a pattern provides, the more representative the pattern is of the history as a whole, and thus, the potential impact that results from automating the pattern is greater. In this way, ED identifies patterns of events that can be used to better understand the nature of inhabitant activity in the environment. Once the data are compressed using discovered results, ED can be run again to find an abstraction hierarchy of patterns within the event data. For example, given data of inhabitant actions in an automated apartment (described further in Section VI of this paper), ED finds a number of patterns including pattern with ID 103517289 (V 30 1V 30 0V 34 1V 34 0a 11 1V 25 0V 1 1V 1 0). This pattern occurs frequently but with no detected periodicity, and represents the inhabitant turning on the living room corner lamp upon entering the room. In this example, events starting with “V” are motion or door sensors, and the event starting with “a” is the action of turning on the lamp.
566
IEEE TRANSACTIONS ON SYSTEMS, MAN, AND CYBERNETICS—PART C: APPLICATIONS AND REVIEWS, VOL. 37, NO. 4, JULY 2007
Fig. 6. MavPad apartment. The apartment is equipped with motion, light, temperature, humidity, door, water leak, smoke, and CO2 sensors, and can control lights, fans, television, receiver, window blinds, HVAC, and diffusers.
Once the data are compressed using the discovered patterns, ED is run again on the compressed data, and finds abstract patterns such as 103517289 417779442 169334 577132524 341362 100100, where each event represents a pattern discovered in the first iteration of ED (103517289 is the pattern shown earlier). As the following sections show, the results can also be used to enhance performance of predictors and decision makers that automate the environment. B. Predicting Activities Using ALZ To predict inhabitant activities, we borrow ideas from text compression. Researchers have established that good compression algorithms also make good predictors. According to information theory, a predictor with an order (size of context history used) that grows at a rate approximating the entropy rate of the source is an optimal predictor. Other approaches to prediction often use a fixed context size to build the model or focus on one attribute such as motion. In an earlier work [33], we showed how our ALZ algorithm incrementally processes a string of characters, which, in our case, is a string representing the history of inhabitant actions, and stores them in a trie (a prefix tree). The algorithm parses the string x1 , x2 , . . . , xi into substrings w1 , w2 , wc(i) such that
for all j > 0, the prefix of the substring wj is equal to some wi for 1 < i < j. Thus, when parsing the sequence of symbols aaababbbbbaabccddcbaaaa, the substring a is created, followed by aa, b, ab, bb, bba, and so forth. The frequency of observed phrases is stored in the trie as well. To perform prediction, ALZ calculates the probability of each symbol (inhabitant action) occurring in the parsed sequence, and predicts the action with the highest probability. To improve predictive accuracy, we use a mixture of all possible higher order models (phrase sizes) when determining the probability estimate. Specifically, we incorporate the prediction by partial match strategy of exclusion [34] to gather information from all available context sizes in assigning the next symbol its probability value. In effect, ALZ gradually changes the order of the corresponding model that is used to predict the next symbol in the sequence. As a result, we gain a better convergence rate to optimal predictability as well as achieve greater predictive accuracy. C. ProPHeT The ProPHeT algorithm uses information supplied by ED and ALZ to construct a hierarchical model and employ reinforcement learning in generating an automation strategy. To apply reinforcement learning, the underlying system (i.e.,
YOUNGBLOOD AND COOK: DATA MINING FOR HIERARCHICAL MODEL CREATION
the house and its inhabitants) is modeled as an MDP. This can be described by a four-tuple �S, A, Pr, R�, where S is the set of system states, A is the set of available actions, and R : S → R is the reward that the learning agent receives for being in a given state. The behavior of the MDP is described by a transition function Pr : S × A × S → [0, 1] that represents the probability with which action at executed in state st leads to state st+1 . The lowest level nodes in our model represent a single event observed by ED (see Fig. 2). Next, multiple iterations of ED are run on these data until no more patterns can be identified, and the corresponding abstract patterns comprise the higher level nodes in the Markov model. The higher level task nodes point to the first event node for each permutation of the sequence that is found in the environment history. Vertical transition values are labeled with the fraction of occurrences for the corresponding pattern permutation, and horizontal transitions are seeded using the relative frequency of transitions from one event to the next in the observed history. As is summarized by the following algorithm, the multitier hierarchical model is, thus, learned directly from the collected data.
V. LEARNING AN ENVIRONMENT CONTROL POLICY FROM THE HIERARCHICAL MODEL To learn an automation strategy, the agent explores the effects of its decisions over time and uses this experience within a temporal difference reinforcement learning framework [35] to form control policies that optimize the expected future reward. Using the structure defined earlier from the observed inhabitant data, the utility value Q(s, a) is incrementally estimated for state/action pairs. This value represents the predicted future reward that will be achieved if the agent executes action a in state s. After each action, the utility is updated as Q(s, a) ←− Q(s, a) + α[r + γQ(s� , a� ) − Q(s, a)]. This formula increments the value of Q(s, a) by the reward r received for being in state s� plus a portion of the difference between the
567
Fig. 7. Example circular probability of two episodes occurring at different times of the day.
current value of Q and the discounted value of Q(s� , a� ), where a� is chosen based on the current Q policy. The current version of MavHome receives negative reinforcement (observes a negative reward) when the inhabitant immediately reverses an automation decision (e.g., turns the light back off) or an automation decision contradicts Arbiter-supplied safety and comfort constraints. A problem that is inherent in temporal models such as the one created by ProPHeT is the need to calculate a belief state, or a probability distribution over possible current states, given available evidence. Once again, our data-driven approach to model creation is useful to accomplish this task. Given the current event state and recent history, ED supplies the probability that the current state is a member of each of its identified patterns. This information is supplemented by a circular probability distribution over the times of day when the episodes normally occur. The circular probability formulas follow the work of Batschelet [36]. An example circular probability of two episodes occurring at different times of the day is shown in Fig. 7. In the case where a pair of such episodes is similar in content, the probability of the time of occurrence can narrow down which episode is currently being observed, and therefore, which is the current state. ProPHeT uses the most likely current pattern from ED, the ALZpredicted next action, the current environment description, and the recent event history to calculate its belief state. Given the most likely current state, ProPHeT can, then, select action with the highest expected utility to execute. Before an action is executed, however, it is checked against the policies in the policy engine, Arbiter (see Fig. 4). These policies contain designed safety and security knowledge and inhabitant standing rules. Through the policy engine, the system is prevented from engaging in erroneous actions that may perform actions such as turning the heater to 120 ◦ F or from violating the inhabitant’s stated wishes (e.g., a standing rule to never turn off the inhabitant’s night light). MavHome’s goal is to learn a control policy that: 1) minimizes user interactions, 2) eliminates safety and security rule violations, and 3) reduces user preference rule violations. Performance based on the first two criteria are determined internally by ProPHeT and Arbiter, while performance based on the third criteria is determined by inhabitant interaction. VI. EXPERIMENTAL RESULTS Although there are many possible goals that could be evaluated for our smart environments (e.g., maximize inhabitant
568
IEEE TRANSACTIONS ON SYSTEMS, MAN, AND CYBERNETICS—PART C: APPLICATIONS AND REVIEWS, VOL. 37, NO. 4, JULY 2007
Fig. 8. ProPHeT-generated hierarchical HPOMDP from MavLab data (only the higher levels of the model are shown). There are eight abstract tasks found in the first iteration of ED and two metatasks (nodes 65237 and 13129) found in the second iteration. Boxes represent end nodes for each task sequence.
comfort, minimize resource utilization), for our evaluation, we focused on reducing the number of manual interactions of an inhabitant in the physical environments through automation of inhabitant activities. In the first experiment, we evaluated a week in the life of an inhabitant in the MavLab. The data were restricted to just motion and lighting interactions, which account for an average of 1400 events per day. We trained ALZ and ED on real data, and then, repeated a week in our simulator to determine if the system could automate the lights throughout the day in real time. ALZ processed the data and converged to 99.99% accuracy on the training data, but only reached a peak of 56% accuracy on the streaming test data. When automation was based on ALZ predictions alone (predicted actions were automated), MavHome reduced the number of manual interactions by 9.7%, as shown in Fig. 9 (top). Next, ED processed the data. Fig. 8 shows the four-tier HPOMDP that is automatically constructed from the ED patterns. Because of space limitations, only the nodes at the higher levels of the model are shown. ED found eight interesting episodes with actions that could be automated, and further abstracted these to two metatasks. Living room patterns consisted of lab entry and exit patterns with light interactions, and the office also reflected entry and exit patterns. The other patterns occurred over the remaining eight areas, and usually, involved light interactions at desks and some equipment upkeep activity patterns. As a point of comparison, we automated the environment using a hierarchical Markov model with no abstract nodes. This flat model reduced interactions by 38.3%, and the combined learning system (the hierarchical ProPHeT-generated model bootstrapped using ED and ALZ) was able to reduce interactions by 76%, as shown in Fig. 9 (top). The improvement in performance from the hierarchical model over the flat model comes from the enhanced contextual clarity of the hierarchical model. The hierarchical model allows replication of nodes that produce the same observation (and if automatable, the same related action), where each node represents a unique context of inhabitant activity. In the flat hierarchical Markov model, there is only a single node representation for each event regardless of the context. In a flat hierarchical
Fig. 9. Inhabitant interaction reduction in the MavLab (top) and MavPad (bottom).
Markov model, we must rely solely on the probabilistic framework for event transitions to determine the most likely next event. The ALZ predictor is even more reliant upon local context alone to make this determination. Using a hierarchy, we are in effect partitioning the state space in a way that enhances context information in the abstract levels.
YOUNGBLOOD AND COOK: DATA MINING FOR HIERARCHICAL MODEL CREATION
Fig. 10.
569
ProPHeT-generated hierarchical HPOMDP from MavPad data (only the higher levels of the model are shown).
Experimentation in the MavPad using real inhabitant data yields similar results. Data for the MavPad were restricted to just motion and lighting interactions, which account for an average of 10 310 events per day (on average, 18 of these represent lighting interactions). ALZ converged to 99.99% accuracy on test data and maintained accuracy between 40% and 60% on the streaming test data. ED processed the data and found ten interesting episodes, abstracted to three hierarchical patterns. The learned HHMM for these data is shown in Fig. 10. For this experiment, ALZ alone reduced interactions from 18 to 17 interactions, the HPOMDP with no abstract nodes reduced interactions by 33.3% to 12 events, while the bootstrapped HPOMDP reduced interactions by 72.2% to 5 interactions. These results are graphed in Fig. 9 (bottom). The amount of training time that is required varies with each inhabitant. We collected 7 weeks of training data on a separate inhabitant in the MavPad, corresponding to 4 371 179 events, 2163 of which could be automated. For the automation phase Arbiter was also loaded with two safety rules and one inhabitant preference rule. In this case, ProPHeT reduced manual interactions by 60.0%. This inhabitant conducted much more varied daily activities and required longer training. As anticipated, ProPHeT was able to learn the Arbiter rules in addition to reducing the number of manual interactions. These experiments provide evidence to support our hypothesis that a hierarchical model of inhabitant behavior can be learned from observation data. Furthermore, this model was an effective basis for learning an automation policy in the MavPad setting. The last experiment also supports our claim that ProPHeT is able to learn policies for a variety of different goals, in this case, to reduce manual interactions and to minimize safety and user preference constraint violations. Armed with the success of this learned model, we automated the MavPad according to the learned policy. The inhabitant was, for the most part, satisfied with the results. There are, however, two highlighted reactions that open opportunities for continued research. One is inhabitant frustration due to powerline control delays. Although the MavPad sensed when the inhabitant entered the apartment, the living room light would typically not turn on for 2 s. This delay was significant enough to prompt the inhabitant to occasionally turn on the light through manual control.
Fig. 11. Example hierarchical Markov model based on MavHome Steve pattern 4 with added nodes.
The second observation is that on the occasions that MavPad automated the wrong action, the inhabitant did not always reverse the action. In fact, over time, we noticed that the inhabitant’s daily activities changed a bit to adapt to the automated model, rather than the reverse. These issues will be investigated in more detail in future research. VII. DATA-DRIVEN MODEL ADAPTATION If a smart environment is designed for lifelong use, it must have the ability to adapt to changes in inhabitant lifestyle. A manually constructed hierarchy will be brittle in the face of such
570
IEEE TRANSACTIONS ON SYSTEMS, MAN, AND CYBERNETICS—PART C: APPLICATIONS AND REVIEWS, VOL. 37, NO. 4, JULY 2007
Fig. 12.
MavLab virtual inhabitant automation performance.
Fig. 13.
MavLab virtual inhabitant interaction reduction during long-term experimentation.
changes. However, our data-driven approach should be able to accommodate these changes, making incremental modifications to the model when appropriate and triggering construction of a new model when needed. In order for state space reduction to occur, episodes and individual states are given a time-to-live counter that is refreshed each time a given part of the HPOMDP is traversed. Unused sections of the HPOMDP will be pruned for increased efficiency. This assists in removing unused episodes and clutter inserted from feedback learning that may have been placed without sufficient continued reinforcement. Keeping the HPOMDP as clean and dynamic as possible helps promote policy convergence. Incremental modifications of ProPHeT’s hierarchical model will occur based on inhabitant interaction. If event E is countermanded (reversed within a time threshold from the point at which it was automated) or replaced by an alternative inhabitant action (he prefers light a16 to be on instead of a14), two parallel states are added to the model. The first is a “NO ACT” state. This allows ProPHeT to leave one of the automated actions out given sufficient inhabitant feedback. The second is a state corresponding to the alternative action (in our example, a “a16 ON” state). As shown in Fig. 11, these new states connect
to all possible downstream states in the Markov chain. Through experience ProPHeT learns what the appropriate connection should be. Inhabitant behavior changes may occur in the form of drifts (slow and steady changes in patterns over time) or shifts (sudden changes in patterns). Drifts occur naturally in continually changing systems such as intelligent environments where the inhabitant grows and changes over the course of his life. Shifts occur when there is a significant departure from earlier life patterns—change of job, injury, arrival of a child, and so forth. Key indicators for detecting drifts and shifts are changes in the MDL compression of discovered patterns and changes in the performance of the smart environment. Many of the drifts are accommodated by the automated changes to ProPHeT’s model described earlier and by the continual refinement of expected utility values as calculated by the reinforcement learner. Dramatic changes in compression but a steady system performance is an indicator of drift. If compression remains consistent, and performance begins to drop significantly, this is an indicator of shift—actions are not being automated correctly, so the model is incorrect. If this drops continues over a period of time, ProPHeT initiates learning of a new
YOUNGBLOOD AND COOK: DATA MINING FOR HIERARCHICAL MODEL CREATION
model from recent data. A system reboot is initiated in order to relearn a new model. To test the ability of the MavHome model-building software to adapt to changes, we designed a virtual inhabitant that executed the MavHome Steve scenarios in a simulated environment. The scenarios are encapsulations of patterns discovered from observing a real inhabitant working in the MavLab. By scripting them, we could let them continue for a longer period of time. The virtual inhabitant used one safety rule preventing the operation of a particular object and one user preference rule that initiates an additional object activation when a target object is activated. For this experiment, the virtual inhabitant generated data over one year. At the six-month point, the model shifts by replacing two episodes with completely new patterns. A 4% performance change threshold over a one-week period was established as the indicator requiring a system reboot. Figs. 12 and 13 reflect the impact of the shift and the reboot. Fig. 12 shows the 4.5% reduction in performance over a one-week period that triggered the reboot. After the reboot, the system required five weeks to retrain, then returned to its normal acceptable performance. ED found 10 episodes in the first model and 11 in the second model. ProPHeT initially reduced interactions by 69.9%, as shown in Fig. 13, then dropped to a 64.2% reduction after the reboot because the new episodes represented more varied and complex patterns. The Arbiter safety rule that prevents turning on a light in one of the episodes was quickly learned after six rule firings using the model adaptation and temporal difference learning methods described earlier. The user preference pattern was also learned after six rule firings. VIII. CONCLUSION In this paper, we introduced a data-driven approach for building a hierarchical model of inhabitant activities in an intelligent environment. We demonstrated that data-mining techniques provide a useful mechanism for generating abstract nodes in the hierarchy, and reinforcement learning can be applied to the model in order to learn a policy to control the environment. By using this approach, we were able to automate two physical environments, reducing the need for manual control in each case over a flat model alone. We also demonstrated that the model structure can adapt in response to user feedback or changes in the system. The biggest challenges in this research project have consistently been factors outside the purview of this paper. Sensor network failure, power outages, slow and unreliable X10 behavior, and other chaotic occurrences forced a lot of effort toward improving the physical layers of MavHome. However, from this study, a number of issues came to light that provide interesting avenues for further study. We would like to investigate other classes of applications for which a data-driven approach can be used to model and control the system. We would also like to extend our intelligent environment application to the more complex case of modeling multiple inhabitants in an environment. We are currently investigating applications of this work to resource conservation and health monitoring in intelligent environments.
571
REFERENCES [1] J. Boger, P. Poupart, J. Hoey, C. Boutilier, G. Fernie, and A. Mihailadis, “A planning system based on Markov decision processes to guide people with dementia through activities of daily living,” IEEE Trans. Inf. Technol. Biomed., vol. 10, no. 2, pp. 323–333, Apr. 2006. [2] K. Pulasinghe, K. Watanabe, K. Izumi, and K. Kiguchi, “Modular fuzzyneuro controller driven by spoken language commands,” IEEE Trans. Syst., Man, Cybern. B, vol. 34, no. 1, pp. 293–302, Feb. 2004. [3] L. Rabiner and B. Juang, “An introduction to hidden Markov models,” IEEE ASSP Mag., vol. 3, no. 1, pp. 4–16, Jan. 1986. [4] M. Skounakis, M. Craven, and S. Ray, “Hierarchical hidden Markov models for information extraction,” in Proc. Int. Joint Conf. Artif. Intell., 2003, pp. 427–433. [5] J. Bockhorst and M. Craven, “Markov networks for detecting overlapping elements in sequence data,” in Advances in Neural Information Processing Systems. Cambridge, MA: MIT Press, 2005, pp. 193–200. [6] G. Theocharous and S. Mahadevan, “Approximate planning with hierarchical partially observable Markov decision process models for robot navigation,” in Proc. IEEE Int. Conf. Robot. Autom., May 2002, pp. 1347– 1352. [7] L. P. Kaelbling, M. L. Littman, and A. R. Cassandra, “Planning and acting in partially observable stochastic domains,” Artif. Intell., vol. 101, pp. 99– 134, 1998. [8] S. Fine, Y. Singer, and N. Tishby, “The hierarchical hidden Markov model: Analysis and applications,” Mach. Learn., vol. 32, no. 1, pp. 41–62, 1998. [9] A. G. Barto and S. Mahadevan, “Recent advances in hierarchical reinforcement learning,” in Discrete Event Systems. Norwell, MA: Kluwer, 2003, pp. 343–379. [10] M. Hauskrecht, N. Meuleau, L. P. Kaelbling, T. Dean, and C. Boutilier, “Hierarchical solution of Markov decision processes using macroactions,” in Proc. Conf. Uncertainty Artif. Intell., 1998, pp. 220–229. [11] S. Singh, “Reinforcement learning with a hierarchy of abstract models,” in Proc. Nat. Conf. Artif. Intell., 1992, pp. 202–207. [12] Y.-H. Chang and L. P. Kaelbling, “Hedged learning: Regret-minimization with learning experts,” presented at the Int. Conf. Mach. Learn., Bonn, Germany, 2005. [13] C. Demonceaux and D. Kachi-Akkouche, “Motion detection using wavelet analysis and hierarchical Markov models,” in Proc. Workshop Spec. Coherence Vis. Motion Anal., 2004, pp. 64–75. [14] T. Mori, Y. Segawa, M. Shimosaka, and T. Sato, “Hierarchical recognition of daily human actions based on continuous hidden Markov models,” in Proc. IEEE Int. Conf. Autom. Face Gesture Recog., 2004, pp. 779–784. [15] R. Sun and C. Sessions, “Self-segmentation of sequences,” in Proc. IEEE Int. Joint Conf. Neural Netw., 1999, pp. 2253–2258. [16] J. Pineau, N. Roy, and S. Thrun, “A hierarchical approach to POMDP planning and execution,” presented at the Workshop Hierarchy Memory Reinforcement Learn. (ICML), Williams College, MA, 2001. [17] L. Xie, S.-F. Chang, A. Divakaran, and H. Sun, “Unsupervised mining of statistical temporal structures in video,” in Video Mining, A. Rosenfeld, D. Doermann, and and D. Dementhon, Eds. Norwell, MA: Kluwer, 2003. [18] Bureau of Labor Statistics. (2006). [Online]. Available: www.bls.gov/oco/ [19] AIRE Group. (2004, Jan.). MIT project AIRE—About us. [Online]. Available: http://www.ai.mit.edu/projects/aire [20] A. Fox, B. Johanson, P. Hanrahan, and T. Winograd, “Integrating information appliances into an interactive space,” IEEE Comput. Graph. Appl., vol. 20, no. 3, pp. 54–65, May/Jun. 2000. [21] M. Roman, C. K. Hess, R. Cerqueira, A. Ranganathan, R. H. Campbell, and K. Nahrstedt, “Gaia: A middleware infrastructure to enable active spaces,” IEEE Pervasive Comput., vol. 1, no. 4, pp. 74–83, Oct.–Dec. 2002. [22] N. A. Streitz, J. Geiler, T. Holmer, S. Konomi, C. Mller-Tomfelde, W. Reischl, P. Rexroth, P. Seitz, and R. Steinmetz, “i-LAND: An interactive landscape for creativity and innovation,” in Proc. CHI, 1999, pp. 120–127. [23] G. D. Abowd and E. D. Mynatt, “Designing for the human experience in smart environments,” in Smart Environments: Technology, Protocols, and Applications, D. J. Cook and S. K. Das, Eds. New York: Wiley, 2005, pp. 153–174. [24] A. Helal, W. Mann, H. El-Zabadani, J. King, Y. Kaddoura, and E. Jansen, “The Gator Tech smart house: A programmable pervasive space,” IEEE Comput., vol. 38, no. 3, pp. 50–60, Mar. 2005. [25] NIST. (2006). Smart space NIST laboratory, [Online]. Available: http://www.nist.gov/smartspace/
572
IEEE TRANSACTIONS ON SYSTEMS, MAN, AND CYBERNETICS—PART C: APPLICATIONS AND REVIEWS, VOL. 37, NO. 4, JULY 2007
[26] M. C. Mozer, “Lessons from an adaptive home,” in Smart Environments: Technology, Protocols, and Applications, D. J. Cook and S. K. Das, Eds. New York: Wiley, 2005, pp. 273–298. [27] H. Hagras, V. Callaghan, M. Colley, G. Clarke, A. Pounds-Cornish, and H. Duman, “Creating an ambient-intelligence environment using embedded agents,” IEEE Intell. Syst., vol. 19, no. 6, pp. 12–20, Nov./Dec. 2004. [28] G. M. Youngblood, D. J. Cook, and L. B. Holder, “Managing adaptive versatile environments,” J. Pervasive Mobile Comput., vol. 1, no. 4, pp. 373–403, 2005. [29] R. Srikant and R. Agrawal, “Mining sequential patterns: Generalizations and performance improvements,” in Proc. 5th Int. Conf. Extending Database Technol., 1996, pp. 3–17. [30] J. Rissanen, Stochastic Complexity in Statistical inquiry. Singapore: World Scientific, 1989. [31] G. J. Chaitin, “Randomness and mathematical proof,” Sci. Amer., vol. 232, no. 5, pp. 47–52, 1975. [32] S. Rubin and L. Trajkovic, “On the role of randomization in software engineering,” presented at the Int. Conf. Comput. Ind. Eng., Cocoa Beach, FL, 2001. [33] K. Gopalratnam and D. J. Cook, “Online sequential prediction via incremental parsing: The Active LeZi algorithm,” IEEE Intell. Syst., vol. 22, no. 1, pp. 52–58, Jan./Feb. 2007. [34] T. C. Bell, J. G. Cleary, and I. H. Witten, Text Compression. Englewood Cliffs, NJ: Prentice-Hall, 1990. [35] R. S. Sutton and A. G. Barto, Reinforcement Learning: An Introduction. Cambridge, MA: MIT Press, 1998. [36] E. Batschelet, Circular Statistics in Biology. New York: Academic, 1981.
G. Michael Youngblood was born in Bishop, TX. He received the Ph.D. degree in computer science and engineering from the University of Texas at Arlington (UTA), Arlington, in 2005. From 1999 to 2002, he was a Software Engineer in Dallas/Fort Worth, TX, where he was engaged in the fields of defense and telecommunication. From 2002 to 2006, he was a Research Associate at UTA. He is currently an Assistant Professor at the University of North Carolina, Charlotte. His current research interests include innovative applications of artificial intelligence, machine learning, entertainment computing, and simulation. Dr. Youngblood is a Member of the Association for the Advancement of Artificial Intelligence, Association for Computing Machinery, the IEEE Computer Society, Tau Beta Pi, and Sigma Xi. He was the Chair of the Dallas-Fort Worth Professional Chapter of ACM SIGGRAPH.
Diane J. Cook (SM’03) was born in Valparaiso, IN, in 1963. She received the B.S. degree in math/computer science from Wheaton College, Wheaton, IL, in 1985, and the M.S. and Ph.D. degrees in computer science from the University of Illinois, Urbana-Champaign, in 1987 and 1990, respectively. During 1991–1992, she was a Faculty Member at the University of South Florida. She is currently a Professor in the Department of Computer Science and Engineering, University of Texas at Arlington, Arlington. Her current research interests include artificial intelligence, machine learning, graph-based relational data mining, smart environments, and robotics.