Data Processing Effects on the Interpretation of Microarray Gene Expression Experiments Katrin Fundela , Robert K¨uffnera, Thomas Aignerb, and Ralf Zimmera a Institut f¨ur Informatik, Ludwig-Maximilians-Universit¨at M¨unchen, Amalienstrasse 17, 80333 M¨unchen, Germany b Lehrstuhl f¨ur Pathologie, Universit¨at Erlangen-N¨urnberg, Krankenhausstr. 8-10, 91054 Erlangen, Germany {fundel,kueffner,zimmer}@bio.ifi.lmu.de,
[email protected] Abstract: Motivation: Microarray gene expression data is collected at an increasing pace and numerous methods and tools exist for analyzing this kind of data. The aim of this study is to evaluate the effect of the basic statistical processing steps of microarray data on the final outcome for gene expression analysis; these effects are most problematic for one-channel cDNA measurements, but also affect other types of microarrays, especially when dealing with grouped samples. It is crucial to determine an appropriate combination of individual processing steps for a given dataset in order to improve the validity and reliability of expression data analysis. Results: We analyzed a large gene expression data set obtained from a one-channel cDNA microarray experiment conducted on 83 human samples that have been classified into four Osteoarthritis related groups. We compared different normalization methods regarding the effect on the identification of differentially expressed genes. Furthermore, we compared different methods for combining spot p-values into gene p-values, and propose Stouffer’s method for this purpose. We developed several quality and robustness measures which allow to estimate the amount of errors made in the statistical data preparation. Conclusion: The apparently straight forward steps of gene expression data analysis, i.e. normalization and identification of differentially expressed genes, can be accomplished by numerous different methods. We analyzed multiple combinations of a number of methods to demonstrate the possible effects and therefore the importance of the single decisions taken during data processing. An overview of these effects is essential for the biological interpretation of gene expression measurements. We give guidelines and tools for evaluating methods for normalization, spot combination and detection of differentially regulated genes.
1 Introduction Today, numerous methods and tools exist for analyzing gene expression data. New normalization techniques are presented, e.g. [Edw03, FC04, WBHW03, ZLS05], so are methods for detecting differentially expressed genes, e.g. [CNGGC04, CC03, CHQ + 05, TTC01, YDFQ05]. Tools aim at analyzing microarray data in a largely automated way, e.g. [CKP+ 04, HZZL02, HVAS+ 04, KWSPF03, PGM04], many of them even integrate
gene expression data with further information obtained from e.g. ontologies, pathway databases or text mining. Yet, comparisons between different normalization methods were focussed mainly on Affymetrix and two-channel cDNA microarrays [BIAS03, PYK+ 03], and do not consider sample groups. Generally, existing literature offers little guidance on how to decide which method to use, how to compare different methods and their outcomes, especially for one channel cDNA data, and how to check the correspondance of possible outcomes to a biologists expectation and downstream interpretation. The aim of the study presented here is to demonstrate that the ’higher-level’ outcome, i.e. a list of differentially regulated genes, of any microarray experiment is closely related to the ’low-level’ details of data processing, that individual microarray data processing steps can not be considered as independent and that it is crucial to be careful in every decision taken during microarray data processing in order to obtain reliable results. More precisely, our goal is to investigate the importance of cDNA microarray data normalization and processing for the identification of differentially expressed genes. Therefore we apply different normalization techniques and evaluate the differences in the final result. We also compare different methods for combining spot p-values to gene p-values, that is another neglected problem. Finally, the large number of samples allows us to perform a stability analysis on the significantly regulated genes. Recently, it has been shown [MKH05] that in numerous published large studies on differential gene expression differentially expressed genes are highly unstable for subsets of the analyzed samples. Thus, we propose a procedure which estimates the errors and quantifies their amount via a robustness analysis, because a gold standard is not available. We present a study conducted on one-channel cDNA microarray data analysis. The analyzed dataset represents 83 samples of human joint cartilage classified into four diseaserelated groups of osteoarthritis (OA), for reviews on osteoarthritis see [ABZZ02, AD03, ABSZ04]. Given the difficulty of obtaining human joint samples this represents a large data set. On the other hand, groups of about 20 samples allow for statistical robustness and quality analysis. The data was collected to identify differentially regulated genes which are of potential interest for understanding disease mechanisms, diagnosis and medical therapy. The full dataset used for this study and its biological interpretation is going to be published in the near future. The study presented here is not intended to focus on the intrinsic content of the underlying data.
2 Dataset The data analyzed in the present study was obtained from a custom designed cDNA microarray. The microarrays were produced and measured by GPC-Biotech AG (Martinsried, Germany). A part of the spotted cDNA had been preselected for OA-relevant genes. Scanning of the radiolabeled arrays was done by phosphorimaging. Each microarray contains 7467 spots, 5517 spots represent 3648 genes, there are 1 to 74 spots per gene on the array, and 1062 genes are represented by more than one spot. The fact that the number of spots
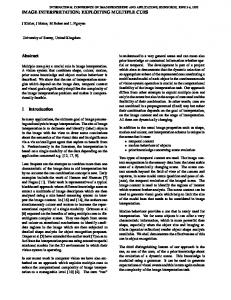
per gene varies complicates data analysis as the information obtained from several spots needs to be combined for obtaining information for a gene, which is needed for biological interpretation; yet this applies to most cDNA and oligonucleotide microarrays and therefore represents a common problem. Primary data analysis, i.e. local background correction and removal of outlier spots, was also done by GPC-Biotech with proprietary software. The data set is described in the following as: X = Xks = {xks |k = 1...83, s = 1...7467}, where s: spots, k: samples. 83 samples of human cartilage were analyzed. The samples were classified based on histological criteria into four groups: normal (n), early degenerative cartilage (e), peripheral (p) and central (c) Osteoarthritis. Furthermore the class ’late OA’ (l) was defined as the combined set of peripheral and central OA, this represents all samples of patients severely affected by Osteoarthritis. It is known that n and e as well as p and c are very similar from a physiological point of view, whereas n is very different from p and c and, consequently, also from l. One of the main goals of the experiment was to identify differentially regulated genes for the group pairs ne, np, nc, ep, ec, pc, nl, el. The expression value distribution (figure 1) shows most data concentrated in a very small range (75% of the values are 93% in the relaxed analysis. The comparison of p-values between normal and early degenerative cartilage shows the least robustness; one reason for this is the small number of significantly regulated genes in this comparison (only 8 genes have a p-value ≤10−5 , 38 genes have a p-value ≤10−3 ), and this also reflects the relatively high similarity of normal and early degenerative cartilage samples. Overall, this confirms, that the applied methods for normalization and p-value combination yields robust p-values and, thus, the genes selected on the basis of these p-values or the corresponding q-values can be assumed to be appropriate for further biological investigation. An error of about 10% of the significantly differentially regulated genes has to be expected. Subset Sampling For estimating the robustness of the most significantly regulated genes for a given group comparison we additionally performed a subset sampling analysis. For each group pair, we generated 50 random subsets of the samples (m=10...18 samples used for each of the groups to be compared) and calculated p-values based on these subsets. Next, we analyzed the top p-value genes; we used the t top genes obtained from the entire sample set as standard of truth and determined the fraction of these top candidates, that are also among the t top candidates of at least s% of the subset p-value sets. For t we used 50, 75, 100; for s we used 100, 80, 50. The result for the MAD scale normalized dataset, with the Stouffer method for combining p-values, and for t=50 (t=75 and t=100 yielded very similar results) is shown in figure 7.
50 top−candidates, 80% of subsets
50 top−candidates, 50% of subsets 1
0.8
0.8
0.8
0.6
0.6
0.6
0.4
0.2
0 10
% genes
1
% genes
% genes
50 top−candidates, all subsets 1
0.4
0.2
12
14 subset size
16
18
0 10
ne np nc ep ec pc nl el
0.4
0.2
12
14 subset size
16
18
0 10
12
14 subset size
16
18
Figure 7: Robustness Analysis of p-value calculation: Subset sampling. Fraction of the 50 top pvalue candidates in the overall p-value calculation that are also among the 50 top candidates in at least s% of the subset-based p-values. Left: all subset p-values (s = 100); middle: s = 80; right: s = 50. For details see section 4.4.
The figure shows that the p-values are of varying stability. Generally, the fraction of stable genes raises when the number of samples in the subset (m) increases. The genes for the group comparisons ne and pc are significantly less robust than the other comparisons. The other group comparisons show higher stability; for a subset sample size of 10, about 50% of the top-candidates are present in all subset p-value top-candidates; about 90% of the top-candidates are present in half of the subset top-candidates. For these group comparisons, the fraction of stable genes also rises with increasing subset size, but this increase is rather modest compared to ne and pc. In any case, the analysis yields an overview of the error to be expected within the respective group comparison and the involved differentially regulated genes.
5 Conclusions The study presented here shows that microarray data normalization and processing has an important effect on the final outcome especially for the identification of differentially expressed genes. It presents the group-level plot as an helpful means for visual inspection of normalization effects on data from classified samples. Furthermore, we compared different methods for combining spot p-values into gene p-values, an important task when dealing with data that bares large inter-spot expression value differences, but neglected so far in our opinion. We found Stouffer’s method to work best, which has not been described before for this task. Finally, we believe that this study shows on exemplary data that it is of vital importance to check every individual step of gene expression data analysis for its appropriateness. Certainly, gene expression data analysis has to fit statistical requirements, but it also needs to account for experimental and biological background knowledge. For most individual processing steps numerous alternatives exist and therefore it is important to test different possibilities and analyze the effects of the decision with appropriate tools. The use of global robustness and quality measures for analyzing individual outcomes can help in estimating the reliability of final microarray study results.
6 Acknowledgement The authors wish to thank Dr. Eckart Bartnik and Dr. Joachim Saas for helpful discussions. This work is partially funded by projects BEX (Sanofi-Aventis, Frankfurt) and BOA (German ministry for research and education, grant 01GG9824).
References [ABSZ04]
T. Aigner, E. Bartnik, F. Sohler, and R. Zimmer. Functional genomics of osteoarthritis: on the way to evaluate disease hypotheses. Clin Orthop Relat Res, 1(427 Suppl):S138– 43, 2004.
[ABZZ02]
T. Aigner, E. Bartnik, A. Zien, and R. Zimmer. Functional genomics of osteoarthritis. Pharmacogenomics, 3(5):635–50, 2002.
[AD03]
T. Aigner and J. Dudhia. 15(5):634–40, 2003.
[BGOT04]
K. V. Ballman, D. E. Grill, A. L. Oberg, and T. M. Therneau. Faster cyclic loess: normalizing RNA arrays via linear models. Bioinformatics, 20(16):2778–86, 2004.
[BIAS03]
B.M. Bolstad, R.A Irizarry, M. Astrand, and T.P. Speed. A comparison of normalization methods for high density oligonucleotide array data based on variance and bias. Bioinformatics, 19(2):185–193, 2003.
[CC03]
X. Cui and G. A. Churchill. Statistical tests for differential expression in cDNA microarray experiments. Genome Biol, 4(4):210, 2003.
[CHQ+ 05]
X. Cui, J. T. Hwang, J. Qiu, N. J. Blades, and G. A. Churchill. Improved statistical tests for differential gene expression by shrinking variance components estimates. Biostatistics, 6(1):59–75, 2005.
[CKP+ 04]
H. J. Chung, M. Kim, C. H. Park, J. Kim, and J. H. Kim. ArrayXPath: mapping and visualizing microarray gene-expression data with integrated biological pathway resources using Scalable Vector Graphics. Nucleic Acids Res, 32(Web Server issue):W460–4, 2004.
Genomics of osteoarthritis.
Curr Opin Rheumatol,
[CNGGC04] J. Comander, S. Natarajan, Jr. Gimbrone, M. A., and G. Garcia-Cardena. Improving the statistical detection of regulated genes from microarray data using intensity-based variance estimation. BMC Genomics, 5(1):17, 2004. [Edw03]
D. Edwards. Non-linear normalization and background correction in one-channel cDNA microarray studies. Bioinformatics, 19(7):825–33, 2003.
[FC04]
M. Futschik and T. Crompton. Model selection and efficiency testing for normalization of cDNA microarray data. Genome Biol, 5(8):R60, 2004.
[Fis32]
R. Fisher. Statistical methods for research workers. Oliver and Boyd, London, 4th edition edition, 1932.
[HVAS+ 04] J. Herrero, J. M. Vaquerizas, F. Al-Shahrour, L. Conde, A. Mateos, J. S. Diaz-Uriarte, and J. Dopazo. New challenges in gene expression data analysis and the extended GEPAS. Nucleic Acids Res, 32(Web Server issue):W485–91, 2004.
[HvHS+ 02] W. Huber, A. von Heydebreck, H. Sultmann, A. Poustka, and M. Vingron. Variance stabilization applied to microarray data calibration and to the quantification of differential expression. Bioinformatics, 18 Suppl 1:S96–104, 2002. [HZZL02]
D. Hanisch, A. Zien, R. Zimmer, and T. Lengauer. Co-clustering of biological networks and gene expression data. Bioinformatics, 18 Suppl 1:S145–54, 2002.
[KWSPF03] S. Knudsen, C. Workman, T. Sicheritz-Ponten, and C. Friis. GenePublisher: Automated analysis of DNA microarray data. Nucleic Acids Res, 31(13):3471–6, 2003. [MKH05]
S. Michiels, S. Koscielny, and C. Hill. Prediction of cancer outcome with microarrays: a multiple random validation strategy. Lancet, 365(9458):488–92, 2005.
[PGM04]
R. Pandey, R. K. Guru, and D. W. Mount. Pathway Miner: extracting gene association networks from molecular pathways for predicting the biological significance of gene expression microarray data. Bioinformatics, 20(13):2156–8, 2004.
[PYK+ 03]
T. Park, S. G. Yi, S. H. Kang, S. Lee, Y. S. Lee, and R. Simon. Evaluation of normalization methods for microarray data. BMC Bioinformatics, 4(1):33, 2003.
[Ros84]
R. Rosenthal. Meta-analytic procedures for social sciences. Beverly Hills, CA: Sage Publications., 1984.
[SS03]
G. K. Smyth and T. Speed. Normalization of cDNA microarray data. Methods, 31(4):265–73, 2003.
[ST03]
J. D. Storey and R. Tibshirani. Statistical significance for genomewide studies. Proc Natl Acad Sci U S A, 100(16):9440–5, 2003.
[TTC01]
V. G. Tusher, R. Tibshirani, and G. Chu. Significance analysis of microarrays applied to the ionizing radiation response. Proc Natl Acad Sci U S A, 98(9):5116–21, 2001.
[WBHW03] D. L. Wilson, M. J. Buckley, C. A. Helliwell, and I. W. Wilson. New normalization methods for cDNA microarray data. Bioinformatics, 19(11):1325–32, 2003. [YDFQ05]
X. Yan, M. Deng, W. K. Fung, and M. Qian. Detecting differentially expressed genes by relative entropy. J Theor Biol, 234(3):395–402, 2005.
[YDL+ 02]
Y. H. Yang, S. Dudoit, P. Luu, D. M. Lin, V. Peng, J. Ngai, and T. P. Speed. Normalization for cDNA microarray data: a robust composite method addressing single and multiple slide systematic variation. Nucleic Acids Res, 30(4):e15, 2002.
[ZAZL01]
A. Zien, T. Aigner, R. Zimmer, and T. Lengauer. Centralization: a new method for the normalization of gene expression data. Bioinformatics, 17 Suppl 1:S323–31, 2001.
[ZLS05]
Y. Zhao, M. C. Li, and R. Simon. An adaptive method for cDNA microarray normalization. BMC Bioinformatics, 6(1):28, 2005.