Abstract. An automated data processing and quality management system for profiling floats of the. ARGO project has been constructed. The system automatically ...
Construction of the Automated Data Processing and Delayed-Mode Quality Control System for Profiling Floats Yasushi TAKATSUKI 1 , Yasuko ICHIKAWA 2 , Taiyo KOBAYASHI 2 , Keisuke MIZUNO 1 , Kensuke TAKEUCHI 2 1: Ocean Observation and Research Department, Japan Marine Science and Technology Center 2: Climate Variations Observational Research Program, Frontier Observational Research System for Global Change Abstract. An automated data processing and quality management system for profiling floats of the ARGO project has been constructed. The system automatically process profiling float data after about 20 hours from its descent, and store data in the database system. The float data is publicized through World Wide Web. For the quality control of float data, we prepared historical database such as WOA98 and HydroBase, and gather neighboring ocean data in geographical/time on GTS via NEAR-GOOS Regional Real-Time Data Base. The system enable us to quality management using such as overlay plot of the float data and historical/neighboring data and so on. Keywords: ARGO project, Automated data processing, quality control, database, WWW
1 Introduction
nium project (Mizuno, 2000). This project is unique to Japan, but it is also actual contribution to the international Argo project. The Ocean Observation and Research Department of the Japan Marine Science and Technology Center and the Frontier Observational Research System for Global Change (JAMSTEC/FORSGC) will be in charge of constructing an observational data-processing and management system for this project, which will consist of storing the data from deployed floats, performing delayedmode quality control, and conducting data distribution through the “database system.” Here, we will describe a summary of the automated data-processing and quality control system implemented in FY 2000, which is part of the “database system”.
An international project was launched in 2000 for the construction of a new ocean observation system through the worldwide deployment of subsurface floats (profiling floats) that measure vertical profiles of water temperature and salinity from the sea surface down to a depth of 2,000 m. The floats that will be used in this project feature the same design as ALACE (Davis et al., 1992). A float drift at the preset depth (normally 2,000 m) and resurface at specified intervals (normally 10 days). During its ascent to the surface, a float measures vertical profiles of temperature and salinity, and transmits the data at the surface via satellite. The Argo project will collect 100,000 temperature/salinity profiles annually by deploying approximately 3,000 floats in oceans worldwide (Roemmich and Owens, 2000). The Argo project is part of the Global Ocean Observing System (GOOS) and will contribute to the Climate Variability and Predictability Study (CLIVAR) and the Global Ocean Data Assimilation Experiment (GODAE). The project is supported by the World Meteorological Organization (WMO) and the Intergovernmental Oceanographic Commission (IOC) of UNESCO. In Japan, the 5-year project, “Construction of the Advanced Ocean Monitoring System (ARGO project),” was launched in 2000 as part of the millen-
2 System Overview Data quality control in the Argo project is performed in two steps: the automated quality control performed within 1 to 2 days after data acquisition, and delayedmode quality control is performed within 3 months after data acquisition. The system carries out both realtime data processing, which performs data acquisition including automated quality control on a server, and the delayed-mode quality-control processing, which compares the acquired data with historical data and/or 1
POP3(E-mail) telnet ftp JAMSTEC Firewall
Database Server Decoding ARGOS messages Insert/update database Float meta-data Profile/positon data Oceanographical data for quality control [WOA98, HydroBase, GTS data (from NEAR-GOOS RRTDB)]
Web Server
Internet
> Japan ARGO Delayed-mode Data Base (http://www.jamstec.go.jp/ARGO/) > Japan ARGO project (http://www.jamstec.go.jp/J-ARGO/) http
Automatic generation of web pages provide http service http > Float meta-data management system (http://floatdb2.hq.jamstec.go.jp:28080/)
Query/updated with SQL
Quality-control PC Compare float data with Historical/neighboring data Update data quality flags Correct data
System management PC Insert/update float meta-data Console for server management
Figure 1: Conceptual drawing of the data processing system for profiling floats.
ten primarily in Perl, a scripting language, for easy maintenance, and IDL was used as the graphics tool.
in-situ data using a quality control program on a PC, and also performs quality flag assignment and data correction. Figure 1 shows the conceptual design of the system. The system is operated on local network in JAMSTEC, so data retrieval from the Internet must be conducted by e-mail through a mail server of JAMSTEC and by the use of telnet/ftp through the firewall. Due to security problems, data distribution to the Internet at the present time will be performed using the HTTP protocol on the World Wide Web. The data will be managed by the database system and manupulated by SQL.
3.1 Improving the Availability of the System Figure 2 shows the hardware components of the server part. To prevent an interruption in service due to hardware failure, two server machines with identical components are provided, and clustering software (VERITAS Cluster Server) is installed on both machines. The clustering software monitors the operational status of the each other machine through a direct Ethernet connection and periodically monitors the operational status of the softwares it manages. Each service managed by the clustering software is assigned a virtual host name (“floatdb1” for the database server function and “floatdb2” for the Web server function) and an IP address. By accessing the virtual host, the user may access a service without having to know which server machine actually performs the service. Normally, the database server (floatdb1) runs on the machine float1adm, and the Web server (floatdb2) runs on the machine float2adm. However, in the event of a functional failure in one of the servers, the service of the failed machine is terminated and the
3 System Design The following points were taken into consideration in the system construction. First, all processing, from float data reception to automated quality control to distribution via the Web, will basically be performed automatically. Even in the event of a system failure, services will continue whenever possible. Second, the quality-control procedures for the system should require minimal knowledge of the database system management and the like. The programs were writ2
Internal Network of JAMSTEC float1adm Database Server function (floatdb1)
System console (CRT, Keyboard)
Web Server function (floatdb2)
SUN StorEdge L280 DLT tape autoloader (Drive:1, Slot:8)
SUN Enterprise 220R 2CPU, 2GB RAM 18GB HD x 2 (RAID 1)
Monitor System Operation
SUN Enterprise 220R 2CPU, 2GB RAM 18GB HD x 2 (RAID 1) float2adm
SUN StorEdge A1000 36GB HD x 6 (RAID 5) RAID 1 (mirroring)
Internal Network of JAMSTEC : Normal Operation : when Hardware or Software fails
SUN StorEdge A1000 36GB HD x 6 (RAID 5)
UltraWide SCSI Ethernet
Figure 2: Hardware components of Database server and Web server.
other machine takes over the service.
3.2.1
To enable data recovery in the event of a failure in the database file, a backup of the database is made daily by the automatic backup software (VERITAS Netbackup) and the DLT tape changer. Currently, the backup data is set to be stored on tape for at least 7 days.
A float transmits data using the ARGOS system. The ARGOS system currently (July 2001) has five polar orbiting satellites. These satellites have sunsynchronous polar orbits with orbiting altitudes of 850 km. It takes about 102 minutes to complete one revolution around the Earth, and shift its orbit 25 degrees westerly per revolution. Two satellites pass over a certain region 6 to 7 times per day at the equatorial regions, and roughly 28 times per day at the polar regions. Transmitting data is possible for 8-15 minutes each time it passes over a float (CLS/Argos, 1996). The ARGOS system normally delivers only the data received by two satellites, but use of the multi-satellite service makes it possible to acquire all available data received by satellites in operation. The maximum data volume that can be transmitted using the ARGOS system is limited to 32 bytes. The size of data transmitted by a float in a single resurfacing (float internal information and the pressure, temperature and salinity data measured for approximately 60 layers) is approximately 400 bytes. Therefore, the float divides the data into 12 to 14 message blocks and transmits them in sequence. Due to the restrictions of the ARGOS system, the transmission repetition period of the ARGOS Platform Transmitter Terminal
To protect the entire system from unexpected power failures, it is connected to an uninterruptible power supply (UPS) unit. The entire system is shut down if the power failure lasts longer than 10 minutes. After power is restored, the system restarts automatically.
3.2 Automated Data Processing The system automatically processes float data at constant time intervals. The flow of the automated processing is shown in Fig. 3. The details of each step are provided in the following sections. The data processing functions described in Sections 3.2.1 to 3.2.4 are performed on the database server, and those in Section 3.2.5 are performed on the Web server. 3
Retrieve and Classify Data
1. Data acquisition and classification telnet [every 6 hours] ARGOS Data retrieve System by telnet JAMSTEC Data retrieve by POP3 POP Server E-mail(POP3)[every 1 hour]
2. Data decoding Decode program Check duplicated data CRC code check Find most frequent pattern Decode profile data and float internal information
by ARGOS ID, and is then stored in the respective work files for each ARGOS ID to process later. During the classification process, data not in the ARGOS format is rejected as invalid. Figure 4 shows the histogram distribution of the time required to deliver data by e-mail. The time required for a satellite to move to a position above a ground station is included in this time. Over 40% of the data is delivered within 1 hour after data transmission, and over 98% of the data is delivered within 12 hours. The longest elapsed time has been 22 hours. The current system begins the decoding process when no new data has been added by e-mail nor telnet within the past 12 hours, since (1) the flyover interval of a satellite is 2 to 3 hours, (2) more than 20 hours may be required for the satellite to deliver the received data, and (3) the ARGOS system may recalculate the positioning data. As parallel acquisition of data is made by e-mail and telnet, there have yet to be any cases in which new data was acquired after the decoding processing during normal operations. In rare cases in which new data is acquired, it is handled as a duplicate data error by the database when insert data if the data contains profile-number information. However, if the profile-number information is lacked, the data will be inserted to database as new data and must be confirmed and deleted manually from the database. Therefore, all steps in the processing are recorded in the job report, and we need to check the decoded data against the float schedule.
Data Classification
append data to files classified with ARGOS ID
Working file for each ID (temporary)
Begin decoding 12 hour after last updated of working file
3. Automated QC Automated QC program Range check Depth inversion check Gradient check Spike check Location data check
4. Insert/update DB Insert/update DB program Update float data statistics Insert/update float data
Database for Floats data
5. Update web contents Preparing web contents program Update basin-wide map Update every 3 hours Update 12-degs square map Update float trajectory map Create/update float profiles Create/update T-S diagram of each profile Create/update T-S diagram of each float Create/update time-depth sections Create/update data files
Figure 3: Flowchart of automatic float data processing. 3.2.2
Decoding Data
The received data may contain errors occured during transmission. Therefore, the first byte of the 32 bytes of transmission data is assigned to the 8-bits Cyclic Redundancy Check (CRC) code calculated from the remaining 31 bytes. The CRC effectively detects burst errors (successive bit errors) and has revealed that nearly 20% of the received data contains errors (Nakajima et al., 2001). An average of 120 pieces of data are received every time a float resurfaces, so if data containing CRC errors is removed, an average of 90 pieces of data are obtained. As a single float datum contains 12 to 14 message blocks, the entire datum cannot be decoded unless all of the blocks are received. It can be seen from the number of messages received up to July 2001 (Fig. 5) that approximately 1% of the message blocks were not received at all. The probability means that one incomplete profile will occur per resurfacing of 10 floats. Fortunately,
(PTT) onboard the floats that have been deployed thus far has been either 44 or 90 seconds. It is therefore difficult to transmit all of the data during single satellite pass over the float. Furthermore, as the position of the float on the surface is determined by the ARGOS system, all of the float data obtained while it is on the surface should also be collected. The data received by the ARGOS satellite is delivered by e-mail via ground stations. With the current e-mail delivery settings, all received data should be delivered. However, compared to the data delivered by floppy disk once per month, the data sent by e-mail is sometimes lack some data blocks. To prevent problems in the e-mail delivery, the system also access to the Service ARGOS host by telnet every 6 hours in order to retrieve data. The data acquired by e-mail or telnet is classified 4
50
is rejected in the actual processing based on most frequently data pattern. If there is no difference in the pattern frequency or there is only one piece of data for the corresponding block, there is a possibility that the block contains an error. Therefore, these blocks are recorded in the job report.
100
Frequency (%)
40 30
80 2001/ 4/ 1 - 2001/ 6/29 N= 1776
70 60 50
20
40
Receive Ratio (%)
90
3.2.3
Automated Quality Control
For the Argo project, common automated qualitycontrol processing has been adopted internationally. 10 20 Currently, discussions are underway regarding the ac10 tual processing method, and a decision should be 0 0 made at the Argo Data Management Team Meeting 0 5 10 15 20 25 scheduled for September 2001. As soon as the contents of the automated quality-control processing are Delivery time after transmission (hour) decided, quality control at JAMSTEC/FORSGC will Figure 4: Histogram and cumulative receive rate as a be conducted in accordance with the decided procedure. Meanwhile, some form of automated quality function of the elapsed time after transmission. control should be performed to prevent erroneous data from being distributed on the WWW. Therefore, we perform the automated quality-control procedure ref25 erenced to the Real-time Quality Control Manual of N: 3135 the Global Temperature and Salinity Pilot Program Average: 5.4 20 (IOC, 1990). The current automated quality-control Median: 5 procedures are described below. 15 1. Positioning Check: The position of a float is calculated from the Doppler effect of the signal received by the ARGOS satellite. On average, 10 10 positions are determined in this manner while a float is on the surface. The routine confirms that 5 the float’s drifting velocity calculated from these positions and time does not exceed 5 kt, and also that the drifting velocity does not exceed the av0 erage drifting velocity during the surfacing by a 0 5 10 15 factor greater than 2.5.
Frequency (%)
30
Number of Recieve Message
2. Global Range Check of Temperature, Salinity, and Depth: The routine confirms that the data values fall within the range of −2 to 35 ◦ C for temperature, 0 to 40 for salinity, and 0 to 10,000 km for depth, which are values normally observed in the open sea.
Figure 5: Histogram of duplicate number for each data message block.
the non-received block tends to be found in a specific profile, so of the 235 profiles obtained thus far, only 10 were incomplete (less than 5%). For the 8-bits CRC, a bit error cannot be detected with a probability of 1/28 . Several cases were found in which the data sent from the floats contained errors that could not be detected by the CRC (Fig. 6). However, as the probability of the same errors occur for different transmission is very low, erroneous data
3. Depth Check: The depth data, ETOPO5 (NOAA, 1988) for a point nearest the resurfacing point of the float and the maximum depth recorded in the float data is compared to confirm that the seafloor depth is deeper. 4. Pressure Inversion Check: Confirms that the pressure value increases in the proper sequence. 5
Example of error data which passed CRC check ARGOS PROGRAM# 02147, ID:28935
Transferred data by ARGOS 32bytes(=256bits)
Satellite ID and Received Date/Time
8D04125FA9ED2320 131BA96A222913BA A916213014DBA867 20311530A8650FB4,H,2001-05-31,11:49:52 8D04125FA9ED2320 131BA96A222913BA A916213014DBA867 20311530A8651F3C,K,2001-05-31,23:51:21 8D04125FA9ED2320 131BA96A222913BA A916213014DBA867 20311530A8651F3C,H,2001-06-01,00:10:51 CRC check byte 0FB4 = 00001111 10110100 1F3C = 00011111 00111100
Figure 6: Example of error data that passed CRC check.
5. Range Check by Depth: Confirms that the tem- If the data applies to any of the check items above, the perature and salinity values by depth do not fall data flag is set to 3, that means “possibly erroneous value”. outside the range specified in Table 1. 6. Freezing Point Check: Confirms that the water temperature is not lower than the freezing point calculated by the following equation (UNESCO, 3.2.4 1983): T
= −0.0575S + 1.710523 × 10⁻³ S 2
Data Insert to the Database
3
The number of messages received by the ARGOS satellite, and the time and date of the last update is inserted to the database along with the pressure, temperature, salinity, and float internal information obtained through decoding; all positioning information from the ARGOS system; and the data flag following quality control processing. If the observation values are corrected or a change is made to the data flag in later quality control processing, the entire revision history and the values prior to revision are also recorded in the database.
−2.154996 × 10⁻⁴ S 2 − 7.53 × 10⁻⁴ P Here, S is the practical salinity and P is the pressure (dbar). 7. Spike Check: Confirms that the value calculated for the vertical profile of temperature and salinity using the following equation has no spike higher than the threshold value (water temperature of 2.0 ◦ C and salinity of 0.3): Vtest = |V2 − (V3 + V1 )/2| − |V1 − V3 |/2
Here, V2 is the value of the layer to be tested, and V1 and V3 are the values of the layers directly Table 1: Range check value of temperature and salinabove and below the tested layer, respectively. ity for each depth range used for automatic quality 8. Slope Check: Confirms that the value calcu- control. lated using the following equation for the vertical Depth Range Temperature Salinity profile of temperature and salinity has no slope (meters) (degree C) (PSS78) steeper than the threshold value (temperature of 0 to 25 −2.0 to 37 0 to 40 10 ◦ C and salinity of 5.0): >25 to 50 −2.0 to 36 0 to 40 >50 to 100 −2.0 to 36 1 to 40 Vtest = |V2 − (V3 + V1 )/2| >100 to 150 −2.0 to 34 3 to 40 Here, V2 is the value of the layer to be tested, and >150 to 200 −2.0 to 33 3 to 40 V1 and V3 are the values of the layers directly >200 to 300 −2.0 to 29 3 to 40 above and below the tested layer, respectively. >300 to 4100 −2.0 to 27 3 to 40 >400 to 1000 −2.0 to 27 10 to 40 9. Density Inversion Check: Confirms that there are >1000 to 3000 −1.5 to 18 22 to 38 no inversions in the density calculated from the temperature and salinity values. 6
/
J_ARGOj.html (Top page in Japanese) J_ARGOe.html (Top page in English) images/ (image files such as 'button') WHATs_ARGO/ (Explanation of ARGO project) search.html,search-e.html argo/ search-nj.html,search-e-nj.html image/ java/ (JAVA class files) map/ (basin-wide and 12-degs square map) float/ 29032/ 29033/
(Float data for each WMO ID)
Figure 8: Top page of the “Float information management system”.
29054/ map/(trajectory map) profile/(profiles) t-s/(T-S diagrams) danmen/(Time-depth sections) data/(data files)
are currently under development, but it is also important to control the quality of data acquired by floats that have already been deployed. In the past, some studies have been made by Freeland (1997) and Bacon et al. (2001) to correct salinity data obtained by the floats using historical data or temporally/spatially neighboring data. At JAMSTEC as well, qualitycontrol methods are being examined in the ARGO project (Kobayashi et al., 2001). The developed system enables a comparison between the float data and the historical data (Fig. 9), a comparison of pieces of float data, and comparison of the float data to temporally/spatially neighboring data on a PC. The system also makes it possible to change the flag on the screen and to update the database according to the above comparison. The World Ocean Atlas 1998 (NOAA, 1999), published by the National Oceanographic Data Center of the National Oceanic and Atmospheric Administration, and HydroBase (Macdonald et al., 2001) data are prepared in the database as historical data for quality control. For temporally/spatially neighboring data, the global subsurface temperature and salinity data obtained through the GTS managed by the Regional Real-Time Database (RRTDB) of the North East Asian Regional GOOS (Yoshida and Toyoshima, 2001) is automatically retrieved every day by ftp and inserted to the database for comparison.
: Contents which created or updated automatically.
Figure 7: World Wide Web Site structure of the ”Japan ARGO Delayed-mode Data base” (http://www.jamstec.go.jp/ARGO/).
3.2.5
Automated Update of the Webpages
The webpages currently has the structure shown in Fig. 7. The system checks the database for new or updated data every 3 hours, and generate/update the pages for the corresponding float data. All pages are updated once every 24 hours.
3.3 Float Information Management Metadata such as the float type, serial number, float deployment information, and settings for the drift/resurface time is inserted to the database, as with float observation data. Insertion to or updating of the database is made using a Web browser for the sake of convenience (Fig. 8). These pages are only accessible from the internal network, and another http server is dedicated to float information management.
3.4 Quality Control of Float Data The Argo project aims to achieve a accuracy of 0.005 ◦ C in temperature and 0.01 in practical salinity. However, conductivity sensors are greatly affected by slight physical deformations and/or impurities on the sensor surface and likely to suffer large deviations in accuracy. It is therefore extremely difficult to maintain high accuracy during long-term operations. Conductivity sensors with long-term stability
4 System Improvement The data has been publicized on the WWW by the present system since April 1, 2001. On one occasion, the database server went down due to a file system full caused by inappropriate script settings, but otherwise there have been no major problems in the automated 7
50
100 90
Frequency (%)
40
80 N: 152 Average: 19.7 Median: 19.3 32.2 Max: Min: 12.3
30 20
70 60 50 40 30
10
20 10
0
Ratio of Processed profile (%)
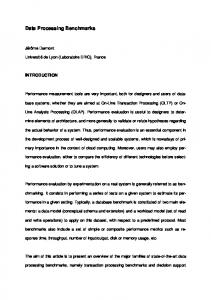
data processing. The following items are being exam- of float data, it is necessary to reduce the time reined as themes for the future with the progress of the quired for data acquisition, the most time-consuming process. It is also required to examine the suitable Argo project. standby time before the decoding processing is performed, which is currently uniformly set at 12 hours. 4.1 Full adaption to All Argo Floats Adopting a satellite communication system other than The present system is designed to handle only data the ARGOS system may also reduce the time required from the profiling floats deployed by JAMSTEC. for data acquisition. At the International Argo Data Management Group workshop held in October 2000, it was agreed that all 4.3 Reconstruction of Error Data float data should have a common format, and that all data should be exchanged through two global centers. As previously mentioned in Section 3.2.2, the present The common format is to be decided at the Argo Data communication system has a high error rate, and CRC Management Team Meeting scheduled for September errors may even be detected in all data for certain data 2001. When the format has been finalized and the block. In the performance test on the ARGOS sysglobal centers begin operations, the system at JAM- tem conducted by Sherman (1992), no difference was STEC will be revised so that the database will be able found in the characteristics of errors for the two patto handle all float data and that JAMSTEC will be able terns of a repetition of 1 and an alternation of 1 and 0, and it was therefore concluded that errors in the ARto provide global Argo float data. GOS system result not from simple bit loss, but rather from a noise burst that causes errors in several succes4.2 Time Required for Real-time Processing sive bits. Figure 11 shows an example of data block with At present, 12 to 32 hours are required after a float CRC errors. There are some portions in which many ends transmission and descends for the completion of all real-time processing in automated data processing bits have been inverted, and other portions in which (Fig. 10). The average processing time is approx- only a few bits have been inverted. However, even if imately 20 hours, and data processing is complete all the data received for certain message data block within 24 hours for 90% of the data. To achieve the contain errors, it may be possible to reconstruct the goal of the millennium project, which is to improve most likely data sequence by comparing each bit in the precision of long-term prediction, the real-time the received blocks and calculating the CRC. Figure data should quickly be assimilated into the model. To 12 shows an example of such reconstruction for the reduce the time required for the real-time processing
0 10
15
20
25
30
35
Decode delay time after float descent (hour)
Figure 9: Sample screen shot of the “Float data quality control program.” Comparison graph of Float data Figure 10: Histogram of the elapsed time from the float descent to decoding data. and historical data (WOA98).
8
20
40
60
80
100
120
140
160
180
200
220
240
Error#
#1
8
#2
7
#3
92
#4
1
#5
96 Good
Error
Figure 11: Example of bit error in ARGOS message.
data in Fig. 11. It is preferable to reconstruct data by examining the results of decoding and following this method. We are therefore examining convenient methods for the reconstruction of error data on the quality-control PC.
Temperature (deg-C) 0
5
10
15
20
25
0
500
4.4 Efficient Delayed-Mode Quality Control Pressure (dbar)
Delayed-mode quality control at JAMSTEC is basically performed for data acquired by floats deployed by JAMSTEC. With the progress of the Argo project, the number of floats collecting data for quality control will increase significantly, and it will therefore be necessary periodically to execute a data quality-control program that supports the quality-control jobs, and to efficiently perform quality control using the report produced by the program. We must examine what type of information the report should contain to advance the quality-control jobs and incorporate it into the system.
1000
1500
2000 34.0
34.5 35.0 Salinity (PSS78)
5 Conclusions 23
A system for automated data-processing and quality control of float data was constructed as a database system to store data from deployed floats, perform delayed-mode quality control, and publicize data, for the processing and management of observation data collected by the project, “Construction of the Advanced Ocean Monitoring System (ARGO Project),” which is part of the Millennium Project. The system has two main functions: automated real-time data-processing of float data, and delayed-mode advanced quality control. The automated real-time data processing can distribute observation data on the
24
25 σt
26
27
28
(kg/m3)
Figure 12: Example of recovery data from bit error shown in Fig. 11.
WWW within one to two days after the float’s resurfacing. For quality-control purposes, historical data (WOA98, HydroBase) and the temporally/spatially neighboring data are provided to enable on-screen 9
comparison with the float data. In 2001, the system will be revised for compatibility with data from all Argo floats, to enable reconstruction of error data, and to perform efficient delayed-mode quality control.
Acknowledgements
8. UNESCO, “Argorithms for Computation of Fundamental Properties of Seawater.” UNESCO Technical Papers in marine science, 44 (1983). 9. Freeland, H., “Calibration of the Conductivity Cells on P-ALACE Floats” 1997 U.S. WOCE Report, 37-38, (1997).
10. Bacon, S., L. R. Centurioni and W. J. Gould, D. Swift of the University of Washington provided the “The Evaluation of Salinity measurements from informations on the data processing system for the PALACE Floats”, J. Atm. and Oceanic Technol., profiling floats operated at the University of Wash18 (7), 1258-1266 (2001). ington. Dr. R. Molinari and the staff members at the GOOS Center of the Atlantic Oceanographic and 11. Kobayashi, T., Y. Ichikawa, Y. Takatsuki, T. Meteorological Laboratory (AOML) of the National Suga, N. Iwasaka, K. Ando, K. Mizuno, N. Oceanic and Atmospheric Administration (NOAA) Shikama, and K. Takeuchi, “Quality control of provided the informations on the quality control proArgo data based on high quality climatological cessing conducted at the GOOS Center. We would data set (HydroBase) I” (in Japanese with Enlike to express our deep appreciation to all of these glish abstract), JAMSTECR, 44, 101-114 (2001). individuals. 12. NOAA, World Ocean Atlas 1998 (WOA98), (NOAA, National Oceanographic Data Center, References Ocean Climate Laboratory, April 1999). 1. Davis, R.E., D. C. Webb, L. A. Regier, and J. Dufour, “The Autonomous Lagrangian Circulation Explorer (ALACE)”, J. Atm. and Oceanic Technol., 9 (3), 264-285 (1992).
13. Macdonald, A. M., T. Suga and R. G. Curry, “An isopycnally averaged North Pacific climatology”, J. Atm. and Oceanic Technol., 18 (3), 394-420 (2001).
2. Roemmich, D. and W. B. Owens, “The Argo project: global ocean observations for understanding and prediction of climate variablity”, Oceanography, 13, 45-50 (2000).
14. Yoshida, T. and S. Toyoshima, “Present status and future view of data management in NEARGOOS” (in Japanese), Kaiyo Monthly, 33 (5), 311-316 (2001).
3. Mizuno, K., “A plan of the establishment of Advanced Ocean Observation System (Japan ARGO)” (in Japanese), Techno Marine, 854, 485-490 (2000).
15. Sherman, J., “Observations of Argos Performance”, J. Atm. and Oceanic Technol., 9 (6), 323-328 (1992).
4. CLS/Service Argos, Users Manual (CLS/Service Argos, Inc., January 1996).
1.0.
5. Nakajima, H., Y. Takatsuki, K. Mizuno, K. Takeuchi, and N. Shikama, “Data communication status of the ARGO floats” (in Japanese with English abstract), JAMSTECR, 44, 153-161 (2001). 6. IOC, Manuals and Guides #22 “GTSPP Realtime Quality control manual” (1990). 7. NOAA, Data Announcement 88-MGG-02, Degital relief of the Surface of the Earth. (NOAA, National Geophysical Data Center, Boulder, Colorado, 1988). 10
Appendix. Data Format of the Profiling Float The floats that have been deployed to date by the Japan Marine Science and Technology Center and the Frontier Observational Research System for Global Change (JAMSTEC/FORSGC) use the ARGOS system for data transmission. The data is transmitted in blocks of 32 bytes in hexadecimal notation (Fig. A1). There are currently two types of data formats, which are presented in Fig. A2. The conversion to water temperature (T), salinity (S), and pressure (P) is performed using the equations shown below. Here, BH and BL are the values of the higher byte and lower byte, respectively (both have the range 0x00 - 0xFF [0-255 in decimal notation]).
02147 28935 13 8 H 1 2001-06-28 12:19:14 2001-06-28 12:13:59 1 660A44CC BF6A088F 2001-06-28 12:16:59 1 940C5711 A7E000C3 2001-06-28 12:18:29 1 16010A01 4E382D 2001-06-28 12:19:59 1 80020D83 266F880A 2001-06-28 12:21:29 1 3F031003 A5EC2517 2001-06-28 12:24:29 1 D90517DA A3331C1B 02147 28935 7 8 J 2001-06-28 18:09:29 1 FA072B64 AD251447 2001-06-28 18:12:29 1 1C093EA9 B9A20C7B 2001-06-28 18:13:59 1 660A44CC BB0A088F
(◦ C) T = (B H × 256 + BL )/1000 S = (BH × 256 + BL )/10000 + 30 (in PSS78) (dbar) P = (B H × 256 + BL )/10 [Type A2] = (B H × 256 + BL )/1000 (◦ C; for 0 ≤ (BH × 256 + BL ) ≤ 62536) T = (B H × 256 + BL − 65536)/1000 (◦ C; for (BH × 256 + BL ) > 62536) (in PSS78) S = (BH × 256 + BL )/1000 (dbar) P = (B H × 256 + BL )/10 T
Furthermore, the power supply voltage (V), the internal pressure of the float (p), and the piston motor drive time (t) are calculated using the following equations. Here, B is the value of the corresponding byte and BH and BL are the values of the higher and lower bytes, respectively.
AAAA15DB 3100AECF B7C60E0B 433DBA1D BA670A1F 4745BB22
2DE0AC4B 13803312 40F7B94F BB34432 454ABA84 7C647C0
15102EDA B01D12BC D45419F BA4E0AEA 95B4643 BB240703
401647472
Program number transmitter ID number number of lines of results in satellite pass number of sensors name of satelite location class date of data collection time code of data collection in UTC transmitter latitude in degrees and thousandths of a degree. transmitter longitude in degrees and thousandths of a degree. transmitter altitude in km, used in location calculation. calculated transmit frequency
2001-06-28 12:13:59 1
date of data collection time code of data collection in UTC number of identical messages received
02147 28935 13 8 H 1 2001-06-28 12:19:14 33.940
[Type A1]
33.940 141.626 0.000 401647472 BA2ABE1F 475A4684 95B4643 47440BCF 46B1A7C0 BB240702 B31D0254 5C7CB03F 18B63B0 64B9A478 6364B7 A487004A 5A0F3908 F80A67B0 123A6A83 B68AEF0 36A90CE2 AE0D32C0 AD9830C9 E0AAD15 2ED92EC6 AEB75551 54D1403 D7F721B0 A6DF2708 1058A683 261110D0 127AA62A 241D142E A627231F A2241DA8 192CA261 1CE41B48 1C7AA2AE 1B4E1D6F A2D71A8A
141.626 0.000
Figure A1: Sample messages from ARGOS system.
V = B/10 + 0.6 (V) p = −0.376 × B + 29.15 (inHg) Table A1: Data table of “Profile termination flag byte” t = (BH × 256 + BL ) × 2 (sec, only for type A2) in hexadecimal notation. In addition, note that 5 dbars are added to the “pressure at the surface immediately before the last descent” in the encoding, so it will be necessary to subtract 5 dbars from the value converted using the equation above. All other items take the value of the corresponding byte.
Value 00 02 04 08 10
11
Meaning Pressure reached surface pressure (Normaly terminated) Pressure reached zero. Pressure unchanged for 25 minutes. (Does not terminate profile) Piston fully extended before surface. UP time expired before surface and UP time was reset. (only for type A1)
Figure A2: Data format arrangement of profiling floats in operation. (a) First message of type A1 (b) First message of type A2 (c) Other messages
12
*1 *2 *3 *4 *5 *6
0x83/10+0.6=13.7 (V) (0x00 × 256+0x4E)/10-5=2.8 (dbar) 0x38 × -0.376+29.15=8.09 (inHg) (0x0B × 256+0x68)/1000=2.920 (deg-C) (0xAE × 256+0xF0)/10000+30=34.4784 (0x36 × 256+0xA9)/10=1399.3 (dbar)
*1 *2 *3 *4 *5
(0x02 × 256+0x2A) × 2=1108 (sec) 0x7F/10+0.6=13.3 (V) (0x08 × 256+0x42)/1000=2.114 (deg-C) (0x87 × 256+0x13)/1000=34.579 (0x4A × 256+0x32)/10=1899.4 (dbar)
* n=(m-1) × 5+3 [Type A1] n=(m-1) × 5+2 [Type A2]
(a) First Message [Type A1] (b) First Message [Type A2] (c) message number 2 and higher Byte Byte Byte 1 1 1 16 80 CRC CRC CRC 35 2 2 2 02 01 Message number (=1) Message number(=1) Message number (m) 01 3 3 3 0D 0A Message block number Message block number 19 Temperature (n) 4 4 4 83 01 02 Serial number of control board Serial number of control board 5 5 5 AD 5A 00 Salinity (n) 6 6 6 98 0E 0F Profile number Profile number 7 7 7 30 3D 39 Profile length Profile length Pressure (n) 8 8 C9 00 08 Profile termination flag byte (Table A1) 8 Profile termination flag byte (Table A1) 9 9 9 0E DA Piston Position Piston Position F8 Temperature (n+1) 10 10 10 0A 02 0A Pump Motor time *1 Bottom temperature 11 11 11 AD 2A 67 Salinity (n+1) 12 12 12 15 7F Battery Voltage *2 B0 Bottom salinity 13 13 13 2E FF 12 Profile Piston Position Pressure (n+1) 14 14 14 D9 F3 3A Surface Piston Position Bottom pressure 15 15 15 0E 58 6A Air bladder pressure Temperature (n+2) Battery Voltage *1 16 16 16 C6 07 83 Bottom temperature 17 17 17 AC F1 00 Surface pressure *2 Salinity (n+2) 18 18 18 6F 87 4E Bottom salinity 19 19 19 2C 21 Internal vacuum *3 38 Pressure (n+2) 20 20 20 E7 4D Bottom piston position 2D Bottom pressure 21 21 21 0F DA 0B Temperature (n+3) Temperature (1) *4 Battery Voltage(unloaded) 22 22 22 A7 89 68 23 23 23 AB 00 AE Surface pressure Salinity (n+3) Salinity (1) *5 D9 24 24 24 54 F0 Internal vacuum 2A 25 25 25 38 36 Pressure (n+3) Pressure (1) *6 Bottom piston position F7 26 26 26 1B A9 10 27 27 27 08 0C Temperature (n+4) Temperature (1) *3 Temperature (2) C1 28 28 28 42 E2 AA 87 29 29 29 AE Salinity (n+4) Salinity (1) *4 Salinity (2) 82 13 30 30 30 0D 28 4A 31 31 31 32 Pressure (n+4) Pressure (1) *5 Pressure (2) FD 32 32 32 32 C0