Sep 1, 2012 - method using data of the house ledger excluding the attributes,. i.e., only shapes. Figure 6. House ledger. When a house ledger is used, unlike ...
International Archives of the Photogrammetry, Remote Sensing and Spatial Information Sciences, Volume XXXIX-B4, 2012 XXII ISPRS Congress, 25 August – 01 September 2012, Melbourne, Australia
DATA UPDATING METHODS FOR SPATIAL DATA INFRASTRUCTURE THAT MAINTAIN INFRASTRUCTURE QUALITY AND ENABLE ITS SUSTAINABLE OPERATION Saya Murakami *, Takashi Takemoto, Yutaka Ito Kokusai Kogyo Co., Ltd, 2-24-1 Harumi-cho, Fuchu-shi, Tokyo, 183-0057 JAPAN – (saya_murakami, takashi_takemoto, yutaka_ito)@kk-grp.jp Commission IV, WG IV / 1
KEY WORDS: Spatial Information Sciences, Spatial Infrastructures, Framework Data, Sustainable, GIS, Reliability
ABSTRACT: The Japanese government, local governments and businesses are working closely together to establish spatial data infrastructures in accordance with the Basic Act on the Advancement of Utilizing Geospatial Information (NSDI Act established in August 2007). Spatial data infrastructures are urgently required not only to accelerate computerization of the public administration, but also to help restoration and reconstruction of the areas struck by the East Japan Great Earthquake and future disaster prevention and reduction. For construction of a spatial data infrastructure, various guidelines have been formulated. But after an infrastructure is constructed, there is a problem of maintaining it. In one case, an organization updates its spatial data only once every several years because of budget problems. Departments and sections update the data on their own without careful consideration. That upsets the quality control of the entire data system and the system loses integrity, which is crucial to a spatial data infrastructure. To ensure quality, ideally, it is desirable to update data of the entire area every year. But, that is virtually impossible, considering the recent budget crunch. The method we suggest is to update spatial data items of higher importance only in order to maintain quality, not updating all the items across the board. We have explored a method of partially updating the data of these two geographical features while ensuring the accuracy of locations. Using this method, data on roads and buildings that greatly change with time can be updated almost in real time or at least within a year. The method will help increase the availability of a spatial data infrastructure. We have conducted an experiment on the spatial data infrastructure of a municipality using those data. As a result, we have found that it is possible to update data of both features almost in real time.
1.
INTRODUCTION This study focuses on the fact that planimetric features vary in requirements in their uses on a map. We have explored updating methods that will enable sustainable operation of spatial data infrastructures by partially updating the data on features that are highly important and change substantially over time, and improving the freshness of data while maintaining its accuracy.
Japan suffered massive damage in the Great East Japan Earthquake that struck on March 11, 2011. In hard-hit areas, local governments were brought to a standstill. Documents, including maps and registers, were carried away by the ensuing tsunami. To share information in the disaster areas, people set up an earthquake information site using OpenStreetMap, sinsai.info, and provided information on water supply station. These incidents highlighted the importance of spatial data infrastructure, which links various information with locations.
2. EXAMINATION PROCEDURE As shown in Figure 1, we studied the methods according to the following procedures: (1) we classified planimetric features according to requirements from the perspective of use on a topographical map; (2) we developed updating methods for high-demand planimetric feature data and to required quality based on category; (3) we conducted a field study in Mie Prefecture to verify those methods; and (4) we evaluated the methods.
In Japan, advanced municipalities use spatial data infrastructures. In principle, data on planimetric features excluding roads are updated every five to more than 10 years with data acquired by aerial photogrammetry on a scale of 1:2500 (a horizontal standard deviation of approximately 1.75 m). Municipalities update data on roads every year by field survey to a scale of at least 1:1000 (a horizontal standard deviation of approximately 0.70 m). In reality, different departments update data with different frequencies and to different scales, as the required quality (accuracy and freshness) varies depending on the purpose of spatial data infrastructure. This reality reduces the quality of spatial data infrastructures.
Mie Prefecture is an area of Japan that is prone to disasters, such as tidal waves and landslides. Having a better awareness than other prefectures of the effectiveness of maps, Mie Prefecture was an early adopter of spatial data infrastructure that integrates cities, towns and villages in the area. Mie Prefecture also has a problem with maintaining infrastructure quality. For these reasons, we chose this prefecture for the field study.
It would be desirable to update all data on planimetric features frequently and with consistent accuracy, but achieving this is difficult. Most governments are hard-pressed financially and cannot afford to update all the data each year by using aerial photogrammetry and field surveys.
29
International Archives of the Photogrammetry, Remote Sensing and Spatial Information Sciences, Volume XXXIX-B4, 2012 XXII ISPRS Congress, 25 August – 01 September 2012, Melbourne, Australia
(1) Classify requirements Freshness
(2) Develop methods Building
Location accuracy
(3) Verify (4) Evaluate Figure 1. Examination procedure
Freshness Road
3. CLASSIFICATION OF REQUIREMENTS We asked the municipalities, who are the main users of the spatial data infrastructure, about the need for planimetric feature data. In total, we asked 19 departments of five municipalities in Mie Prefecture in four fields: urban planning, water supply, sewerage and fixed assets.
Location accuracy
High
Importance
Benchmark
Road construction causes roads to change in shape. With the exception of expressways and private roads, these are managed by governments. Governments, therefore, are the first to know about the changes. In Japan, an as-built drawing is created upon completion of a road construction work. This drawing is a topographical map of the site drawn after the work. The map together with a report is delivered to the client (see the diagram below).
Note
Railway District
Vegetation
Wall or fence
Small object
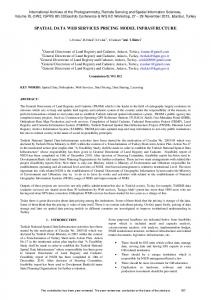
Figure 2. Distribution of planimetric features by importance and frequency of change in data Among the features high in importance were natural or intangible features: administrative boundaries, shore lines and contour lines. These are subject to change due to disasters or large-scale development but do not change greatly with time.
Topographical map (1/1000)
Draw a detailed map with intersections, constructions and other information, if necessary.
(1/1000 or more)
As-built drawing
(1/1000 or more) Topographical map (1/500 or more)
Road pre-design
Work blueprint
Detailed design
(1/500 to 1/1000)
Road management diagram
Order
Create an as-built drawing based on the ordered design (blueprint).
Maintenance/ Maintenance/ management
Frequency of change in data
High
Draw a topographical map of the construction site.
Construction
Research, plan and design
Low Low
Standard deviation of 0.75 m is desirable for the management of facilities for utilities.
4.1 Partial updating of road data
Road
Contour line
Up-to-date data is needed for use in car navigation systems and logistics.
4. DEVELOPMENT OF UPDATING METHODS
Building
Shore line
Private sector Up-to-date data is needed for marketing and customer data management. Location accuracy is not important.
Table 1. Required quality of building and road data from the perspectives of governments and the private sector
The chart below depicts information on the level of importance and the frequency of change that we obtained from the municipalities. The importance of a planimetric feature represents the percentage of departments that need the feature data for their operations.
Administrative boundary
Governments Up-to-date data is needed to support of people in need of help in the event of disaster. Standard deviation of 1.75 m is desirable for urban planning. Up-to-date data is needed for disaster prevention, restoration and reconstruction following a disaster, as well as for daily management of facilities for utilities. Standard deviation of 0.75 m is desirable for road management.
Create a road management diagram by field survey.
Figure 3. Flow of road construction The government has been encouraging use of the CALS/EC system since 2000 and has established guidelines on delivery of electronic document. More and more documents for public works are being delivered electronically. As-built drawings now have to be delivered as CAD data when the work is ordered by the national government. Increasingly, drawings for prefectures and municipalities also are being delivered as CAD data. This data constitutes the latest information on changes in roads and is useful in updating road data.
Roads and buildings are artificial constructions. They change on a day-to-day basis as the result of construction work. The frequency of change is high for this data. Partial updating is most effective in maintaining the quality of a spatial data infrastructure when it is performed on features that are high both in level of importance and frequency of change. Partially updating data on buildings and roads would lead to the sustainable operation of a spatial data infrastructure. Regarding these two types of planimetric features, we classified required freshness of data and location accuracy from the perspectives of governments, which are the subject of our field study, and the private sector, which does business based on the data, as shown in the table below. In the following sections, we propose updating methods to meet these requirements.
30
International Archives of the Photogrammetry, Remote Sensing and Spatial Information Sciences, Volume XXXIX-B4, 2012 XXII ISPRS Congress, 25 August – 01 September 2012, Melbourne, Australia
documents have to be rasterized and digitized. Even a suburban municipality has several thousand buildings to update each year. The updating method above is impractical from the standpoint of working efficiency. In Japan, most municipalities have a house ledger to assess fixed assets. The house ledgers often do not show roads or other planimetric features but only the shapes and attributes of buildings. House ledgers are updated every year by fixed asset departments and therefore they provide very up-to-date information on houses. It would be ideal for the house ledgers to be integrated with the building database contained in spatial data infrastructure. But in reality, this is rarely the case because of the protection of personal data and due to many other problems.
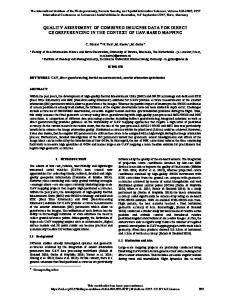
Figure 4. Top view of completed roads We have developed a data updating method for roads using as-built drawing CAD data (see the diagram below). The corresponding part is cut out from the road database of the spatial data infrastructure and provided to the construction contractor. The contractor modifies the data with the changes made by the construction and submits the modified electronic data. The road database can be updated simply by incorporating the submitted data into it.
To avoid these problems, we have developed an updating method using data of the house ledger excluding the attributes, i.e., only shapes.
If this can be achieved, road databases can be updated while maintaining quality. GIS data Government
Cutting out the construction area
Updated囲 新範 更area
Update
Spatial data infrastructure
接合 Join
Spatialdata infrastructure
接合 Join
Cutout and provision of the construction area
Figure 6. House ledger
Delivery of electronic document
CAD data Contractor Construction 工事区間 area
Construction 工事区間 area
Edit on CAD
Edited area 編集範囲
Figure 5. Partial updating cycle of road data 4.2 Partial updating of building data
When a house ledger is used, unlike the as-built drawing or the written application for building certification, changes over time need to be identified. The most efficient way to identify them is to label each shape with its age and identify changes from their ages. However, few municipalities include time information for each shape in the ledger. Furthermore, it is difficult to share such information because of issues with the protection of personal data. In our study, we decided to use the shapes in house ledgers over two years to identify changes over time. Following is the updating method we have developed.
Changes in building data are occur for three primary reasons: new construction, loss and alteration. In the event of loss, a building can simply be deleted from the registration database. However, accurate shapes and locations are needed to add new construction and make alterations.
(1) Identify changes over time using house ledgers for two years. (2) Identify the area to update in the old data. (3) Conduct visual examination. (4) Update data.
One of the earliest-stage documents indicating these changes is a written application for building certification. This application is submitted to the municipality when a building is to be built in a city planning area. The submission of the application is required by law. By using the vicinity map and drawing attached to the application, data on individual buildings can be updated every time changes are made. These documents, however, do not have geodetic coordinates. Updating the data involves three stages: finding a ballpark location from the address provided on the application; identifying the location of the building from its relative position to the surrounding roads and neighbors on the vicinity map; and then drawing the shape from the dimensions provided on the attached drawing. In order to update data while maintaining location accuracy, this method is desirable as it provides such information as distances from roads and the position on the premises.
Applying this method provides very up-to-date data that is better than the data provided with a conventional updating frequency of once ever several years and is constantly available.
5. VERIFICATION 5.1 Updating of road data We conducted a field study on Mie Prefecture to verify the problems and effects of the updating methods we developed. As different road management entities are very likely to create their as-built drawings in different ways, we obtained the data from the national government, prefecture and municipalities and verified location accuracy and other quality to see whether they could be used for updating.
In reality, digitization of this data is not required by law, so
31
International Archives of the Photogrammetry, Remote Sensing and Spatial Information Sciences, Volume XXXIX-B4, 2012 XXII ISPRS Congress, 25 August – 01 September 2012, Melbourne, Australia
The data from these entities had the following characteristics. Management entity Nation
Prefecture
City
Characteristics � Complies with national standards and has geodetic coordinates. � Specific features are expressed with polygons. � Has geodetic coordinates. � All the features are expressed with lines. � Some data is rasterized. � Has geodetic coordinates. � All the features are expressed with lines. � Some data is rasterized.
New data Original data
Figure 7. Difference in road boundaries 5.2 Updating of building data
Table 2. Characteristics of as-built drawings by road management entity
To update building data, we also conducted a field study on Mie Prefecture.
Not all the as-built drawings of the prefecture and municipalities were available as vector data. We excluded rasterized data for the verification.
We asked the fixed asset departments of three municipalities how they created their house ledgers. We found that they paid little attention to absolute location accuracy. To use the house ledgers, it bears keeping in mind that the ledgers vary in location accuracy from municipality to municipality depending on the updating method that is applied. In some municipalities, the staff draws building shapes by hand.
Regarding the three types of as-built drawings above, we examined whether they had adequate location accuracy to be used for road data updating. The drawings of the prefectural and city roads did not have geodetic coordinates. We performed the orientation of the drawings and compared the coordinates on the drawings with those measured by field survey. As the table below shows, the drawings had location accuracy equivalent to or better than their scales.
Co-1
Number of verified points 6
1:1000
0.422
Co-2
9
1:1000
0.566
Co-3
6
1:1000
0.635
P-1
4
1:1000
0.87
P-2
6
1:500
0.553
P-3
4
1:500
0.231
Ct-1
5
1:300
0.064
Ct-2
7
1:500
0.076
Ct-3
4
1:500
0.057
Verified drawing
Nation
Prefecture
Municipality
Scale
House ledgers are increasingly digitized. These ledgers can be used to update building data without affecting efficiency. Scale: 1:500 or 1:1000 (location accuracy unknown) Scope: Flat land (area in which houses stand) Number of houses updated each year: 1% to 2% of the total Updating frequency: Every year
♦ ♦ ♦
RMSE
♦
We verified the location accuracy of the house ledgers. We identified the locations of the houses on the GIS, compared them with those measured by field survey and calculated RMSE. The result shows that no data has location accuracy as high as the scales of the house ledgers. However, their accuracy is equivalent to a scale of 1:2500, which is good enough to be used for the updating. City
Table 3. Evaluation result of location accuracy of as-built drawings
City A City B City C
Using the data above, we updated road data of a spatial data infrastructure and found the following. ♦ There were no problems with data updating from the perspective of location accuracy. ♦ The procedures for drawing road shapes were not standardized and the original data and updated data sometimes differed in the positions of road boundaries. In suburbs in particular, some road boundaries were not clear. Some standards needed to be established. ♦ Data created by prefectures and municipalities did not have absolute positional coordinates. From the viewpoint of working efficiency, it would be helpful if reference information for identifying the area to be updated were available in advance.
Number of verified points 36 42 30
Scale 1:1000 1:1000 1:500
RMSE 1.074 0.824 1.086
Table 4. Verification result of location accuracy of house ledgers As we performed the updating, we discovered the following with regard to the method of partially updating building data. ♦
♦
♦
32
Identifying the area to be updated in the old data required that all newly constructed, lost or altered houses be located by comparing the house ledgers for two years and then all the buildings on the old data that were overlapped by houses in those locations had to be selected to avoid omissions. When we checked the data selected in identifying the area to be updated, we found that excess data was included because of subtle differences in shape, as shown below. Visual checks always needed to be conducted to remove that excess data. When building data is integrated with road data, some
International Archives of the Photogrammetry, Remote Sensing and Spatial Information Sciences, Volume XXXIX-B4, 2012 XXII ISPRS Congress, 25 August – 01 September 2012, Melbourne, Australia
routines.
houses overlap roads, because of differences in location accuracy. Road data must be of higher accuracy than building data. The data had to be edited based on road shapes.
Acknowledgements We are deeply grateful to support by union of local governments of Mie Prefecture.
Excess data New data
Original data
Excess data
To be deleted
Figure 8. Example of excess data
6. EVALUATION AND PROBLEMS 6.1 Evaluation The partial updating methods for road and building data nearly meet the requirements described in Section 3 in terms of data freshness and location accuracy. Partial updating enhances the freshness more effectively than updating all the data. Item
Requirement
Total updating
Every 5 to more than 10 years Within a standard Within a standard Location deviation of deviation of accuracy 1.75 m 1.75 m
Road
Building
Freshness Latest
Partial updating Every year
Within a standard deviation of 1.75 m All construction Freshness Latest Every year work Within a standard Within a standard Within a standard Location deviation of deviation of deviation of accuracy 0.70 m 0.70 m 0.70 m
Table 5. Evaluation result 6.2 Problems to be solved Focusing on road and building data, for which demand and quality requirements are high, we developed partial and frequent updating methods in order to achieve the sustainable operation of a spatial data infrastructure while maintaining the quality of the infrastructure. When building data is updated, its location accuracy is not necessarily ensured, as the data used for updating is not standardized. To develop universal methods, institutional solutions are needed, such as standardizing the house ledgers and digitizing the drawings for building certification. House ledgers are used to calculate fixed asset taxes, and disclosure conditions need to be clarified to protect personal data. As location-based services grow more prevalent, demand for spatial information infrastructures is expected to increase. It is therefore necessary to explore updating methods for planimetric features that we did not include in this study because of their lower importance. Methods must not increase officials’ workloads but by employable as part of their daily
33