Address with DDoS attack access. KeywordsâDistributed Denial of Service (DdoS); Gaussian. Naive Bayes; Numeric. I. INTRODUCTION. Distributed Denial of ...
(IJACSA) International Journal of Advanced Computer Science and Applications, Vol. 8, No. 8, 2017
DDoS Attacks Classification using Numeric Attribute-based Gaussian Naive Bayes Abdul Fadlil Department of Electrical Engineering Ahmad Dahlan University Yogyakarta, Indonesia
Imam Riadi
Sukma Aji
Department of Information System Ahmad Dahlan University Ahmad Dahlan University Yogyakarta, Indonesia
Department of Information Technology Ahmad Dahlan University Yogyakarta Indonesia
Abstract—Cyber attacks by sending large data packets that deplete computer network service resources by using multiple computers when attacking are called Distributed Denial of Service (DDoS) attacks. Total Data Packet and important information in the form of log files sent by the attacker can be observed and captured through the port mirroring of the computer network service. The classification system is required to distinguish network traffic into two conditions, first normal condition, and second attack condition. The Gaussian Naive Bayes classification is one of the methods that can be used to process numeric attribute as input and determine two decisions of access that occur on the computer network service that is “normal” access or access under “attack” by DDoS as output. This research was conducted in Ahmad Dahlan University Networking Laboratory (ADUNL) for 60 minutes with the result of classification of 8 IP Address with normal access and 6 IP Address with DDoS attack access. Keywords—Distributed Denial of Service (DdoS); Gaussian Naive Bayes; Numeric
I.
INTRODUCTION
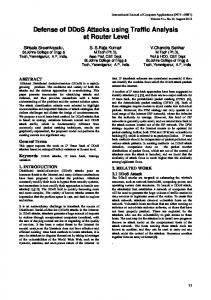
Distributed Denial of Service (DDoS) attacks still top the list of Cyber Attacks. In Open Source Intelligence by month January reported an unusually low number of Attack Techniques shows 34% of the cases, the reason was not specified. Where as DDoS leads the chart of the known techniques with 22,3%, ahead Hijacks (13,8%), and Defacements (10%). Targeted attacks are immediately behind with a remarkable 7,4%. Fig. 1 shows attacks technique until January 2016. Data shows that DDoS attacks are still always very interesting to be the object of the research.1 DDoS attacks through computer networks, especially Local Area Network (LAN) are detected using a multiclassification technique, that is, by combining data mining method to get better accuracy. In pre-processing data, before loading data sets into data mining software, relevant attributes are selected to get accurate and unused classification omitted because it will add noise that affect accuracy [1].
1
Fig. 1.
Top 9 of Attack Techniques January 2016.
In research [2] the Comparative Analysis of Different DDoS Detection Techniques used Statistical Method, Intrusion Detection System (IDS), IDS based Dempster-Shafer Theory, Host Based IDS, Network IDS, and Real Time IDS of Throughput, Fault Tolerance, Performance, Overheads, Response Time, and Detection Rate. Gülay Ōke [3] used Multiple Bayesian Classifier and Random Neural Network to detect Denial of Service attacks. Naive Bayes Classifier makes a decision by collecting offline input features. The input feature is bit rate, an increase in bit rate, entropy value of the incoming bit rate, Hurst parameter, delay, and Delay rate. Bharti Nagpal [4] comparing 5 DDoS attack tools Trinity, Low Orbit Ion Cannon (LOIC), Tribal Flood Network, Mstream, and Trinoo as Architecture used, Type of Flooding used for attacking, Type of DDoS method used, Possible damage caused, Channel encryption. Gnanapriya [5] research Software-Defined Networking (SDN) shows that SDN provides a new opportunity to defeat DDoS attacks in cloud computing environments, and summarizes the excellent SDN features to defeat DDoS attacks. Then review the study of the launch of DDoS attacks on SDN and methods against DDoS attacks on the SDN.
http://www.hackmageddon.com
42 | P a g e www.ijacsa.thesai.org
(IJACSA) International Journal of Advanced Computer Science and Applications, Vol. 8, No. 8, 2017
B. Naive Bayes Method Bayes method is used to calculate the probability of occurrence of an event based on the observed effects of observation. Naive Bayes method is simple probabilistic-based prediction technique based on Bayes’s method application with strong independence assumptions [10]. Naive Bayes method is: (
)
(
) ( ) ( )
(4)
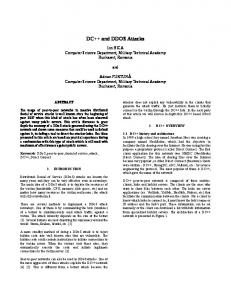
Where, P(A|B) is the posterior of class (target) given predictor (attribute). Fig. 2.
TCP SYN flood attack.
Normal TCP connections usually start transmitting from the user by sending SYN to the router, and the router will allocate the buffer to the user and respond with SYN and ACK packets. This stage, the connection is in a half open state, waiting for an ACK response from the user to complete the connection settings. When the connection is completed, this is called 3-way linkage and TCP SYN Flood attacks manipulate this 3-way linkage by making the router busy with SYN request [6]. TCP SYN Flood is a common form of Denial of Service attack. Fig. 2 shows the TCP SYN Flood happened. TCP SYN Flood can be observed with a Packet Capture application by using a port mirroring to observe a copy of router activity. TCP SYN flood features are often the emergence of one of the IP Address to the router. The source IP Address that always appears to the router is calculated within a specified time range and used as feature extraction as a DDoS attack [7]. Based on earlier research regarding packet classification with Naive Bayes, in this paper, we provide a detailed understanding of how to process numerical attributes on a network traffic activity based on the Gaussian Naive Bayes method. II.
BASIC THEORY
P(B|A) is the likelihood which is the probability of predictor given class. P(A) is the prior probability of class. P(B) is the prior probability of predictor. C. Accuracy The accuracy of a classification system is described as the data output level compared to the desired value. Accuracy in classification is calculated from: Normal access data in a normal class (True Positives (TP)). Normal access data outside the normal class (False Positives (FP)). Attacks access data outside the attack class (False Negatives (FN)). Attack access data in the attack class (True Negatives (TN)) [9]. (5) III.
RESEARCH METHODOLOGY
A. Topology
A. Gaussian Method The Gaussian method is one of the common and important methods in probability and statistics, introduced by Gauss in his study of error theory. Gauss uses it to describe errors. Experience shows that many random variables, the height of adult males, and reaction time in psychological experiments, all of which can be solved by the Gaussian Method [8], [9]. The Gaussian method is: (
( )
)
(1)
√
Where, µ is average and δ is standard deviation, to calculate µ and δ values for numerical attributes using formula ∑ ∑
(2) (
)
(3)
Fig. 3.
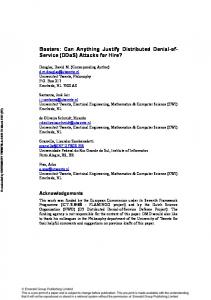
Research laboratory of master informatics engineering topology.
43 | P a g e www.ijacsa.thesai.org
(IJACSA) International Journal of Advanced Computer Science and Applications, Vol. 8, No. 8, 2017
Computer Network of ADUNL topology shown in Fig. 3 is distributed, the development of star topology. Router with IP Address 172.10.64.250 and 192.168.10.254 become the network service center and access divider of each user within the scope of ADUNL. B. Attacks Scenario IP address 192.168.10.64.2; 192.168.10.64.3; 192.168.10.64.4; 192.168.10.64.5; 192.168.10.64.6; 192.168.10.64.7; 192.168.10.64.8; and 192.168.10.64.9 (user) perform normal activities by accessing the site www.detik.com and www.youtube.com and run the function in the site by pressing play movie button. The attack is done from outside ADUNL to victim router with IP address 172.10.64.250 by an attacker with IP address 172.10.64.199; 172.10.85.151; 172.10.71.29; 172.10.71.49; 172.10.201.5; and 172.10.201.19 using DDoS attack tool Low Orbit Ion Canon (LOIC).
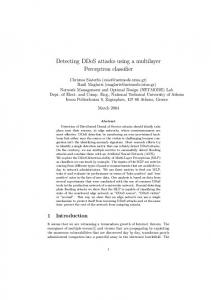
Apply Gaussian Naive Bayes, at this stage Gaussian Naive Bayes classification method, is used to process data that already has input parameters. Prediction, at this step Gaussian Naive Bayes method, determines the data that has been processed into two decisions that are normal access or under attack. IV.
RESULT AND ANALYSIS
Object research result capture network traffic at ADUNL. The methodological step is carried out coherently to produce maximum research. A. Captured IP Packet Result Log file of captured network traffic for 60 minutes divide within 3 minutes each time access through port mirroring ADUNL by the investigator using Wireshark packet capture in .pcap format. Fig. 5 shows capture result in .pcap format.
Investigator use port mirroring access with IP address 192.168.30.1. To retrieve log data of network traffic from within and to ADUNL. C. Methodology
Fig. 5.
Capture result in .pcap format.
B. Analyzing IP and data packet IP address that accesses ADUNL and estimates how many packets of data transmitted by and from the IP address that is doing the activity calculated based on log files that have been obtained. Fig. 6 shows the IP address accessing ADUNL.
Fig. 4.
Methodology of DDoS attacks classification.
DDoS attacks classification step of the methodology is shown in Fig. 4. Captured IP packet is used to retrieve data in the form of log file network traffic with port mirroring access in .pcap format. Analyzing IP and data packet, in this step is to analyze the IP address who is doing the attack and how long the packet is sent. Extraction, in this stage log files with the .pcap format, is converted into spreadsheet files so they can be processed using Gaussian Naive Bayes method. Pre-processing, at this step the making of input parameters can be used in the classification method.
Fig. 6.
IP address accessing in ADUNL.
C. Extraction Capture results of network traffic log files in .pcap format can not be processed into columns and rows required in the classification process. To be processed into columns and rows of .pcap format are extracted into the .csv format and then extracted into xlsx format. Fig. 7 shows extracting .pcap format into .csv format. D. Pre-processing At this stage, it is processing the results of network traffic extraction into the main parameters that can identify normal access or attack. The main parameters used as input parameters shown in Table 1. In this research, two input parameters taken are:
44 | P a g e www.ijacsa.thesai.org
(IJACSA) International Journal of Advanced Computer Science and Applications, Vol. 8, No. 8, 2017
Incoming of IP address (IIP) within specified time range (2nd column is x attribute). Packet length (PL) within a specified time range (3rd column is y attribute).
Average of packet length (µ) normal = 186510 Standard deviation of packet length (δ)normal = 114045 Average of incoming IP (µ) attack = 9082 Standard deviation of incoming (δ) attack = 3606 Average of packet length (µ) attack = 1932401 Standard deviation of packet length (δ) attack = 582331 Formula (1) is used to calculate the likelihood of Incoming IP address (IIP) normal and attack. (
Fig. 7. TABLE I.
Extracting .pcap format into .csv format. INPUT PARAMETERS IN TIME RANGE 0-3 MINUTES
)
(
)√
( 0,0001566 (
(
(
)
(
)
(
)
(
)
(
)
(
)
IP address
Access
Time range (minutes)
192.168.10.2
81
16134
Normal
0-3
(
192.168.10.3
2939
405244
Normal
0-3
(
)
192.168.10.4
803
118889
Normal
0-3
(
)
192.168.10.5
1173
165510
Normal
0-3
(
)
192.168.10.6
1074
154472
Normal
0-3
192.168.10.7
1566
207772
Normal
0-3
(
)
192.168.10.8
1105
155560
Normal
0-3
192.168.10.9
1963
268497
Normal
0-3
172.10.64.199
3386
1088676
Attack
0-3
172.10.85.151
14323
2432059
Attack
0-3
172.10.201.5
10787
2282970
Attack
0-3
172.10.201.19
7658
1831513
Attack
0-3
172.10.71.29
8899
2525711
Attack
172.10.71.49
9437
1433478
Attack
) )
)
(
(
)√
( (
)) )
(
(
(
0-3
(
0-3
(
)
(
)
(
)
(
)
(
)
(
(
Standard deviation of incoming IP (δ) normal = 847
=
)
Packet length (PL) in time range (y attribute)
Average of incoming IP (µ) normal = 1338
)
√
Incoming IP (IIP) in time range (x attribute)
E. Apply Gaussian Naive Bayes method Average (µ) and Standard deviation (δ) are calculated for every normal access and attack on x and y attributes used (2) and (3).
)) )
(
)
(
( (
(
)
)
√
) )
) )
45 | P a g e www.ijacsa.thesai.org
(IJACSA) International Journal of Advanced Computer Science and Applications, Vol. 8, No. 8, 2017
(
)
(
)
(
)
(
)
Formula (1) also used to calculate the likehood of Packet Length (PL) normal and attack. (
)
(
(
(
)√
(
))
(
)
) (
(
)
(
)
(
(
(
)
(
)
) )
Probabilities for the nominal attributes are then calculated based on Table 1.
)
√
(
)
(
)
(
)
(
)
(
)
(
)
(
)
(
(
)
(
)
(
)
Formula (4) is used to calculate P(normal|IP) and P(attack|IP) (
)
(
(
(
(
)
(
)
(
)
(
) )
(
(
) (
) ( (
(
)
) (
) ( (
) )
)
)
) )
)
P(normal|192.168.10.3) = 3,51E-10 P(attack|192.168.10.3) = 3,421E-12 P(normal|192.168.10.4) = 9,057E-09
(
)
(
(
(
(
)√
(
)
P(attack|192.168.10.4) = 2,554E-13 P(normal|192.168.10.5) = 1,272E-08
) (
))
P(attack|192.168.10.5) = 4,112E-13
)
P(normal|192.168.10.6) = 1,207E-08
√
(
)
(
)
(
)
(
)
(
)
(
)
(
)
P(attack|192.168.10.6) = 3,654E-13 P(normal|192.168.10.7) = 1,249E-08 P(attack|192.168.10.7) = 6,454E-13 P(normal|192.168.10.8) = 1,223E-08 P(attack|192.168.10.8) = 3,745E13 P(normal|192.168.10.9) = 7,753E-09 P(attack|192.168.10.9) = 1,093E-12 P(normal|172.10.64.199) = 1,827E-23
46 | P a g e www.ijacsa.thesai.org
(IJACSA) International Journal of Advanced Computer Science and Applications, Vol. 8, No. 8, 2017
P(normal|172.10.71.49) < P(attack|172.10.71.49), then IP address 172.10.71.49 categorized in attack class.
P(attack|172.10.64.199) = 4,572E-11 P(normal|172.10.85.151) = 7,892E-144
G. Visualization of Classification Two-dimensional images can be used to display the classification results, so it can detect the level of accuracy. Matlab is the right tool to display the result of the classification.
P(attack|172.10.85.151) = 1,094E-10 P(normal|172.10.201.5) = 5,198E-109 P(attack|172.10.201.5) = 3,393E-10 P(normal|172.10.201.19) = 7,099E-66 P(attack|172.10.201.19) = 4,144E-10 P(normal|172.10.71.29) =2,884E-117 P(attack|172.10.71.29) = 2,703E-10 P(normal|172.10.71.49) = 2,02E-54 P(attack|172.10.71.49) = 3,135E-10 F. Prediction Decisions are predicted by comparison P(normal|IP) and P(attack|IP). If P(normal|IP) > P(attack|IP) then the decision is normal, and if P(normal|IP) < P(attack|IP) then the decission is under attack. P(normal|192.168.10.2) > P(attack|192.168.10.2), then IP address 192.168.10.2 categorized in a normal class. P(normal|192.168.10.3) > P(attack|192.168.10.3), then IP address 192.168.10.3 categorized in a normal class.
Create set with average (µ) + Standard Deviation (δ) in Matlab.
Fig. 8.
Fig. 8 shows how to create a set based on average (µ) + standard deviation (δ) in Matlab; x1, y1 is the set of normal access (green), whereas x2, y2 is the set of attack (red).
P(normal|192.168.10.4) > P(attack|192.168.10.4), then IP address 192.168.10.4 categorized in a normal class. P(normal|192.168.10.5) > P(attack|192.168.10.5), then IP address 192.168.10.5 categorized in a normal class. P(normal|192.168.10.6) > P(attack|192.168.10.6), then IP address 192.168.10.6 categorized in a normal class. P(normal|192.168.10.7) > P(attack|192.168.10.7), then IP address 192.168.10.7 categorized in a normal class. P(normal|192.168.10.8) > P(attack|192.168.10.8), then IP address 192.168.10.8 categorized in a normal class. P(normal|192.168.10.9) > P(attack|192.168.10.9), then IP address 192.168.10.9 categorized in a normal class. P(normal|172.10.64.199) < P(attack|172.10.64.199), then IP address 172.10.64.199 categorized in attack class. P(normal|172.10.85.151) < P(attack|172.10.85.151), then IP address 172.10.85.151 categorized in attack class. P(normal|172.10.201.5) < P(attack|172.10.201.5), then IP address 172.10.201.5 categorized in attack class. P(normal|172.10.201.19) < P(attack|172.10.201.19), then IP address 172.10.201.19 categorized in attack class. P(normal|172.10.71.29) < P(attack|172.10.71.29), then IP address 172.10.71.29 categorized in attack class.
Fig. 9.
Network traffic classification with class area µ+δ.
Fig. 9 shows a visualization of ADUNL network traffic classification in 3 minutes time range with an area of class µ+δ using Matlab. The normal class area and the attack with µ+δ based on Fig. 9 have not precisely shaded the members of the set. The accuracy obtained using the formula (5) is 57,14%, then searched again the value of δ to get the broad class that can shelter its members.
47 | P a g e www.ijacsa.thesai.org
(IJACSA) International Journal of Advanced Computer Science and Applications, Vol. 8, No. 8, 2017
searched again the value of δ to get the broad class that can shelter its members.
Fig. 10. Network traffic classification with class area µ+(1,5δ)
The normal class area and the attack with µ+(1,5δ) based on Fig. 10 still have not precisely shaded the members of the set. The accuracy obtained using the formula (5) is 71,43%, then searched again the value of δ to get the broad class that can shelter its members.
Fig. 12. Network traffic classification with class area µ+(2,5δ).
The normal class area with µ+(2,5δ) based on Fig. 12 has not precisely overshadowed the set members, while the attack class is right to cover the set members. The accuracy obtained using the formula (5) is 92,86%, then searched again the value of δ from the normal class to obtain the extent of class that can shelter its members.
Fig. 11. Network traffic classification with class area µ+(2δ).
The normal class area and the attack with µ+(2δ) based on Fig. 11 still have not precisely shaded the members of the set. The accuracy obtained using the formula (5) is 78,57%, then
Fig. 13. Network traffic classification with class normal area µ+(3δ) and class attack area µ+(2,5δ).
48 | P a g e www.ijacsa.thesai.org
(IJACSA) International Journal of Advanced Computer Science and Applications, Vol. 8, No. 8, 2017 TABLE II.
CLASSIFICATION WITH NEW STANDARD DEVIATION IN TIME RANGE 0-3 MINUTES
No
IP Address
Incoming IP (IIP) in time range (x attribute)
Packet length (PL) in time range (y attribute)
Access
P(normal|IP)
>
1.859E-11
NORMAL
2
192.168.10.3
2939
405244
NORMAL
9.789E-10
>
3.328E-11
NORMAL
3
192.168.10.4
803
118889
NORMAL
1.405E-09
>
2.197E-11
NORMAL
4
192.168.10.5
1173
165510
NORMAL
1.459E-09
>
2.371E-11
NORMAL
5
192.168.10.6
1074
154472
NORMAL
1.45E-09
>
2.326E-11
NORMAL
6
192.168.10.7
1566
207772
NORMAL
1.456E-09
>
2.548E-11
NORMAL
7
192.168.10.8
1105
155560
NORMAL
1.452E-09
>
2.336E-11
NORMAL
8
192.168.10.9
1963
268497
NORMAL
1.381E-09
>
2.772E-11
NORMAL
9
172.10.64.199
3386
1088676
ATTACK
3.272E-11