Duel [24], Dalek [48], and. ACID [66] are examples of debuggers in which the debugging language has been extended with constructs aimed at providing ...
DEBUGGER GENERATION IN A COMPILER GENERATION SYSTEM by BASIM MARKUS KADHIM B. S., University of Colorado, 1990 M. S., University of Colorado, 1993
A thesis submitted to the Faculty of the Graduate School of the University of Colorado in partial fulfillment of the requirements for the degree of Doctor of Philosophy Department of Computer Science 1998
ii Kadhim, Basim Markus (Ph. D., Computer Science) Debugger Generation in a Compiler Generation System Thesis directed by Professor William M. Waite Compiler generation systems have contributed significantly to our ability to quickly and reliably develop translators for languages that include small domain-specific languages, preprocessor extensions to existing languages, and full blown compilers. With these new translators and languages comes a need for programming support tools, such as debuggers. This thesis describes and demonstrates a framework for generating debuggers quickly and reliably from specifications, including the ability to modify translators in support of debugging. The framework consists of a number of adaptations and additions to a compiler generation system to support the construction of debuggers. The adapations and additions facilitate the generation of debuggers using the same set of tools as are used in generating translators. Using the same tools allows for significant reuse of specifications.
iii
ACKNOWLEDGEMENTS I would like to thank my advisor, Bill Waite, for sparking my interest in compiler construction and being my mentor for more than just this dissertation. I also owe a great debt to all of the members of the Eli research group, including Tony Sloane, Uwe Kastens, Peter Pfahler, and Matthias Jung. Their ongoing work contributed in no small measure to the success of this work. The members of my committee, and in particular Ben Zorn, have earned my gratitude through their careful reading of my thesis particularly at a busy time for all. I cannot thank my wife, Sarah, enough for standing by me and always having the confidence that I would finish.
CONTENTS CHAPTER 1 INTRODUCTION . . . . . . . . . . . . . . . . . . . . . . . . . . . . . 1.1 Eli Compiler Construction System . . . . . . . . . . . . . . . . . 1.2 The Framework . . . . . . . . . . . . . . . . . . . . . . . . . . . 1.2.1 Debugger Shell . . . . . . . . . . . . . . . . . . . . . . . 1.2.2 Information Store . . . . . . . . . . . . . . . . . . . . . . 1.2.3 Run-Time Library . . . . . . . . . . . . . . . . . . . . . . 1.2.4 Query Processing . . . . . . . . . . . . . . . . . . . . . . 1.3 Related Work . . . . . . . . . . . . . . . . . . . . . . . . . . . . 1.4 Outline . . . . . . . . . . . . . . . . . . . . . . . . . . . . . . . . 2 PERSISTENCE OF DEBUGGING INFORMATION . . . . . . . . . 2.1 General-Purpose Mechanism for Persistence . . . . . . . . . . . 2.1.1 SOS Usage . . . . . . . . . . . . . . . . . . . . . . . . . . 2.1.2 SOS Implementation . . . . . . . . . . . . . . . . . . . . 2.1.3 Dealing with Static Data . . . . . . . . . . . . . . . . . . 2.2 Application of SOS to Compiler Data Structures . . . . . . . . . 2.2.1 Persistence of a Definition Table . . . . . . . . . . . . . . 2.2.2 Persistence of the String and Identifier Tables . . . . . . 2.3 Related Work . . . . . . . . . . . . . . . . . . . . . . . . . . . . 3 DEBUGGER QUERY PROCESSING . . . . . . . . . . . . . . . . . . 3.1 Leveraging Translator Specifications . . . . . . . . . . . . . . . . 3.1.1 Lexical Analysis . . . . . . . . . . . . . . . . . . . . . . . 3.1.2 Syntactic Analysis . . . . . . . . . . . . . . . . . . . . . . 3.1.3 Semantic Analysis . . . . . . . . . . . . . . . . . . . . . . 3.1.4 Interpretation and Evaluation . . . . . . . . . . . . . . . 3.2 Compiler Generation System Support for Interactive Processing 3.3 User Input Issues . . . . . . . . . . . . . . . . . . . . . . . . . . 3.4 Related Work . . . . . . . . . . . . . . . . . . . . . . . . . . . . 4 PROVIDING DEBUGGING FUNCTIONALITY . . . . . . . . . . . 4.1 Using Expect . . . . . . . . . . . . . . . . . . . . . . . . . . . . 4.2 Specific Debugging Functionality . . . . . . . . . . . . . . . . . . 4.2.1 Mapping Between Source and Target Coordinates . . . . 4.2.2 Mapping Source Coordinates to Scopes . . . . . . . . . . 4.2.3 Trace Execution and Breakpoints . . . . . . . . . . . . . 4.3 Backend Query Processing . . . . . . . . . . . . . . . . . . . . . 4.4 Related Work . . . . . . . . . . . . . . . . . . . . . . . . . . . . 5 COMPILER ADAPTATIONS FOR DEBUGGING . . . . . . . . . . 5.1 Persistent Information . . . . . . . . . . . . . . . . . . . . . . . 5.2 Generating Target Code Directives . . . . . . . . . . . . . . . .
. . . . . . . . . . . . . . . . . . . . . . . . . . . . . . . . . . . . . .
. . . . . . . . . . . . . . . . . . . . . . . . . . . . . . . . . . . . . .
. . . . . . . . . . . . . . . . . . . . . . . . . . . . . . . . . . . . . .
. . . . . . . . . . . . . . . . . . . . . . . . . . . . . . . . . . . . . .
1 3 5 5 6 7 7 8 9 10 11 12 18 19 20 20 24 25 27 29 29 30 30 32 33 34 35 36 37 39 39 40 41 43 45 47 48 52
v 5.2.1 Inserting C Preprocessor Line Directives 5.2.2 Inserting Assembly Code Line Directives 6 THE CONSTRUCTION OF A DEBUGGER . . . . . 6.1 Restoring Saved Debugging Information . . . . 6.2 Processing the Query Language . . . . . . . . . 6.2.1 Commands with Location Information . 6.2.2 Commands Requiring Little Translation 6.2.3 Processing Source Language Expressions 6.3 Using Gdb to Provide Debugging Functionality 6.3.1 Initialization and Finalization . . . . . . 6.3.2 Run-Time Execution Control . . . . . . 6.3.3 Querying Values in Memory . . . . . . . 6.3.4 Miscellaneous Commands . . . . . . . . . 6.4 Using Backend Query Processing . . . . . . . . 7 CONCLUSION AND FUTURE WORK . . . . . . . BIBLIOGRAPHY . . . . . . . . . . . . . . . . . . . . . . . .
. . . . . . . . . . . . . . . .
. . . . . . . . . . . . . . . .
. . . . . . . . . . . . . . . .
. . . . . . . . . . . . . . . .
. . . . . . . . . . . . . . . .
. . . . . . . . . . . . . . . .
. . . . . . . . . . . . . . . .
. . . . . . . . . . . . . . . .
. . . . . . . . . . . . . . . .
. . . . . . . . . . . . . . . .
. . . . . . . . . . . . . . . .
. . . . . . . . . . . . . . . .
. . . . . . . . . . . . . . . .
53 55 57 57 57 59 61 61 65 67 68 70 70 70 73 75
vi
FIGURES FIGURE 1.1 2.1 2.2 2.3 2.4 2.5 2.6 2.7 2.8 2.9 2.10 2.11 2.12 2.13 3.1 5.1 5.2 5.3 5.4 5.5 5.6 5.7 6.1 6.2 6.3 6.4 6.5 6.6 6.7 6.8 6.9 6.10 6.11 6.12 6.13 6.14 6.15
Translator and Debugger High-Level Architecture . . . . . . . . . Linked List Data Structure . . . . . . . . . . . . . . . . . . . . . . Persistent Linked List Data Structure . . . . . . . . . . . . . . . . SOS Function Prototypes . . . . . . . . . . . . . . . . . . . . . . . Code to Make ListEntry Persistent . . . . . . . . . . . . . . . . . Input to the SOS processor . . . . . . . . . . . . . . . . . . . . . . Output from the SOS processor . . . . . . . . . . . . . . . . . . . Creating and Writing to a Persistent Store . . . . . . . . . . . . . Reading from a Persistent Store . . . . . . . . . . . . . . . . . . . Class for Integer-Typed Properties . . . . . . . . . . . . . . . . . Definition Table Generic Accessor Function . . . . . . . . . . . . . Macros for PDL Property Types . . . . . . . . . . . . . . . . . . . Statically Initialized Keys in PDL . . . . . . . . . . . . . . . . . . Restoration of the String and Identifier Tables . . . . . . . . . . . Decomposition of the Query Processor . . . . . . . . . . . . . . . Specifications for Making Debug Information Persistent . . . . . . List of Compiler Specification Files . . . . . . . . . . . . . . . . . Abstract Machine Instructions for A := 16 . . . . . . . . . . . . . Abstract Machine Instructions with Line Directives for A := 16 . The LineMarker Function . . . . . . . . . . . . . . . . . . . . . . PTG Output Pattern for Assignment Statements . . . . . . . . . Statement Marker Node in the Target Tree . . . . . . . . . . . . . Debugger Specifications File . . . . . . . . . . . . . . . . . . . . . SaveFile Implementation . . . . . . . . . . . . . . . . . . . . . . Query Language Syntax . . . . . . . . . . . . . . . . . . . . . . . Looking Up a Procedure Name in the Environment . . . . . . . . Generating Assembly Code to Traverse Static Link . . . . . . . . Debugger Code to Traverse Static Link . . . . . . . . . . . . . . . Constant Value Extraction for Constant Folding . . . . . . . . . . Getting the Value of a Variable in the Debugger . . . . . . . . . . Interface Functions for Gdb . . . . . . . . . . . . . . . . . . . . . Script for Gdb Initialization . . . . . . . . . . . . . . . . . . . . . Gdb Interaction Following a Resumption of the Program . . . . . Definition of the gdb next Function . . . . . . . . . . . . . . . . . Reading a Value from the Stack . . . . . . . . . . . . . . . . . . . Specification Characterizing Output from Gdb’s where Command Grafting an Abstract Tree Fragment . . . . . . . . . . . . . . . .
. . . . . . . . . . . . . . . . . . . . . . . . . . . . . . . . . . . . .
. . . . . . . . . . . . . . . . . . . . . . . . . . . . . . . . . . . . .
. . . . . . . . . . . . . . . . . . . . . . . . . . . . . . . . . . . . .
. . . . . . . . . . . . . . . . . . . . . . . . . . . . . . . . . . . . .
. . . . . . . . . . . . . . . . . . . . . . . . . . . . . . . . . . . . .
5 12 12 13 13 16 17 17 18 21 22 22 24 25 28 49 50 53 54 54 55 55 58 58 60 60 63 64 65 66 66 67 69 69 70 71 72
vii
TABLES TABLE 6.1 List of Debugging Commands . . . . . . . . . . . . . . . . . . . . . . . . .
58
CHAPTER 1 INTRODUCTION Compiler generation systems provide significant leverage in the creation of textual translators for languages, including small domain-specific languages, preprocessor extensions to existing languages, and full blown compilers. In each of these cases, compiler generation systems are capable of providing many components integrated in such a way that very little must be specified at the interfaces between those components. Components provided by such a system include library modules and modules generated from high-level specifications. These specifications can be supplemented with code for parts that are most easily described operationally. Toolsets of this kind radically simplify the work of a programmer in constructing translators for new as well as existing languages. Using high-level specifications to specify components of the translator also results in more reliable and maintainable implementations without necessarily compromising performance [57]. These advantages, coupled with the proliferation of new languages and language extensions, have led to an increasing reliance on compiler generation tools, and this trend shows signs of continuing. Recent workshops and conferences devoted to the discussion of special-purpose languages and the infrastructure for implementing translators for them provide evidence of this [10, 34]. If we look beyond the construction of the translator to its use, we find that we do not yet have the programming support tools we are accustomed to using in conjunction with other compilers. These include tools such as symbolic debuggers and profilers. Among programming support tools, debuggers are arguably the most heavily used. This observation stems very simply from the fact that it is virtually impossible to write a large body of code by hand without errors and that correctness almost always takes a front seat to other concerns such as performance. Another important reason for the heavy use of symbolic debuggers stems from weaknesses in other methods for debugging. One of the simplest forms of debugging is for programmers to instrument their source code with statements that print information about the dynamic execution of the program. Perhaps the biggest advantage to this approach is that it does not require users to learn any new debugging tools or languages. There are a number of weaknesses to this approach, however. Users must recompile their program each time they want to show new information about the program and are unable to control or modify the run-time behavior of the program. Furthermore, the run-time environment may not provide convenient methods for displaying such information, resulting in the need for additional code to be written solely for the purpose of displaying debugging information. Other approaches to debugging are event-based, in which the existing code is instrumented to generate events [56, 59]. Support can be provided for processing events for the purposes of visualization and execution control. The main drawback is the need to
2 instrument the source code with event generation code, consequently requiring recompilation when the user is interested in new information from the debugged program. These approaches do play an important role for certain kinds of debugging. Programs whose behavior is timing-critical and might be perturbed by the program interruptions required to query for information in a conventional debugger are better served by event-based debugging approaches that can more carefully control the overhead of event generation. Event-based approaches also have advantages in cases where the interface to a well defined component is to be debugged rather than its internals, because they are able to show information about the component at the level of the interface, rather than information specific to the implementation. Implementation specific information is irrelevant and obscures the information of interest. In contrast, symbolic debuggers typically give complete control over the dynamic execution of the program and allow users to query information about the run-time state. Many debuggers also give users the possibility to dynamically change the flow of control or state of the program, allowing users to test the effect of a change to the source program without actually making the change. While symbolic debuggers do not require the instrumentation of the source program, they do require information that can be automatically supplied by the compiler. While this requirement often requires recompilation of the source in preparation for debugging, it does not require that a recompilation take place every time the user is interested in asking a new question about the program. The necessity for this additional information from the compiler arises from the desire to present information in the debugging session at the level of the user’s source code, rather than at the level of machine instructions. This abstraction is an important one as it is possible for users to write and read programs in a high-level source language without having even the slightest knowledge of the underlying machine code required to implement it. For such users, debugging at the level of machine code is not even an option. A similar necessity exists for textual translators whose target language is also a highlevel source language. Such translators range from preprocessors to full blown translators from one high-level language to another. The desire to avoid breaking the abstraction of the original source language while debugging remains. While users may be more likely to have a greater understanding of the target language (particularly in the case of a preprocessor), the use of the abstraction provided by the source language suggests that the details of its implementation are irrelevant to debugging. This class of translators is one for which compiler generation tools are particularly popular, primarily because such translation tasks focus on the best understood aspects of compiler construction. Scanning and parsing are well understood tasks for which a wide variety of tools exist, while automated and portable machine code generation is not as well understood and is still the subject of considerable research [20, 53]. Existing techniques for the generation of programming support tools focus primarily on tools to generate interpreters. Examples of such systems are PSG [7] and Centaur [9]. Both use high-level specifications to generate interpreters and debuggers for the languages specified. Because these systems are based on interpreted environments, the use of the generated tools is tied very closely to the environment in which they are generated. These approaches have greater control over the run-time behavior of the system, but are unsuitable
3 for applications where a translator rather than an interpreter is desired. By contrast, the approach described here is based on an environment for generating translators. The generated translators can translate to any target language, including object code. The execution of the translated code need have no dependence on the environment used in generating the translator. The disadvantage is that users must supply more information about the run-time behavior of the generated code in order for a debugger to be built. Considerable leverage can be obtained, however, by using existing debugging engines for the target language. This thesis will show how to provide leverage for the construction of debuggers for translators that have been created using a compiler generation system. The focus will be on compilers for imperative languages, including those languages that translate into an existing imperative language. As noted before, the latter is of particular significance with respect to the use of compiler generation tools. There is also little existing support for constructing debuggers for translators that translate from one high-level language to another. This thesis will result in several important contributions: (1) The definition of a framework for constructing a debugger. This framework utilizes and extends a number of the components of a typical compiler generation system in order to gain leverage from the components and specifications already provided by the user in implementing the translator. (2) Analysis of the requirements placed on compiler generation tools in support of generating debuggers, including requirements that may already be met by some instances of a class of compiler generation tool. This analysis also addresses the extensions required solely for the purpose of supporting generation of debuggers (or potentially other programming support tools). (3) Analysis of the kinds of information that must be provided by the compiler for use by the debugger. The transfer of this information from the translator to the debugger is supported by extensions to the tools. (4) A demonstration of the framework with two examples, which includes the necessary modifications to the translators as well as the implementation of the debuggers using the framework. The two examples both translate the same source language (Pascal– as defined by Per Brinch Hansen [11]), but translate to different target languages. The first target language is code for an abstract stack-oriented machine and the second is Digital Alpha assembly language code. The framework described here allows users to generate one debugger that can be used in conjunction with the first translation and another one for use with the second translation with only modest effort. Prior to this work, no such debuggers for Pascal– existed. The test bed for the work described in this thesis is the Eli Compiler Construction System [26]. While many of the techniques described are not specific to Eli, a number of Eli’s features significantly contribute to the success of this research. It is also necessary to have a frame of reference from which to describe implementation aspects of the framework. 1.1
Eli Compiler Construction System Virtually every compiler generation system includes a scanner and parser generator. Beyond this, compiler generation systems vary significantly in the kinds of tools they provide
4 as well as the level of integration between the various components. Beyond scanner and parser generation, the framework I describe in this thesis assumes support for computations over abstract syntax trees and some uniform representation for definition table information.1 Eli includes a scanner generator called GLA [25] and two parser generators: COLA and PGS. Computations over trees in Eli are supported by the Liga attribute grammar evaluation system [38] and the interface to the definition table is described by a property definition language, called PDL. Eli also provides specification languages to describe command line processing, operator identification, and output generation, as well as a large collection of modules for many common translation tasks including name and type analysis. These modules have well-defined interfaces that may be instantiated. The implementation of modules may consist of any Eli specification fragments, including operational ones (C or C++ code). Eli’s goal is to provide specification languages and modules that can be selectively chosen for a particular translation task. Integration of these components is done in such a way as to avoid overspecification: users are not forced into supplying information that can be deduced by the system. For example, code to construct an abstract syntax tree does not need to be provided by the user as it can be provided automatically based on an analysis of the concrete and abstract syntaxes [33]. Integration is also done with an eye towards extensibility: users are given the possibility of overriding default behaviors of the system as well as introducing their own components. This capacity for extending the system also makes it much easier to make the adaptations and additions needed to support the framework developed in this research. One of the central themes of the framework is the ability to reuse existing specifications and compose them with new ones. Eli has a number of features that support this kind of reuse. For example, parts of a specification for a single translator can be spread across numerous files. This allows the specifications to be grouped by their functional properties as modules rather than by the type of specification language. When specifications are split up according to their functional properties, there are some declarations that are tied to more than one module. Eli permits redundant declarations to appear in more than one module so that each module can be used independently. The interface to the integrated set of components that make up Eli is a derived object manager called Odin [13]. Odin operates on the basis of a derivation graph that specifies derivation steps and dependencies required to construct derived objects from source objects provided by a user. Use of Odin requires supplying a derivation graph in conjunction with the necessary scripts, executables, and data files to execute the derivation steps described by the derivation graph. All of this is organized as a set of packages. Eli is a set of Odin packages that provides tools for textual translation. Use of Eli involves making derivation requests which consist of a root object and the derivation or sequence of derivations to apply to that object. The root object is a user specification that is typically a listing of source specifications and derivations that make up the complete specification. An example of a derivation request might be to request an executable for the translator described by the set of specifications listed in the root object. 1 We use the term definition table, rather than the frequently used term symbol table, to emphasize the fact that information is not always appropriately associated with a symbol in the input.
5
Translator
Debugger
lexical analysis
debugger shell
syntactic analysis
query processor
semantic analysis
information store
information store
run-time library
code generation
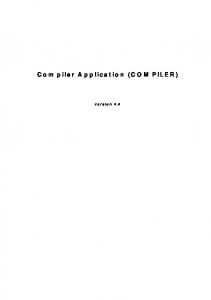
Figure 1.1: Translator and Debugger High-Level Architecture If the name of the root object is translate.specs, then such a request would look like: translate.specs :exe The extensions described in this thesis are modifications and additions to the existing set of Eli packages. These modifications and additions follow the same goals for integration as the existing set of Eli packages and are made in such a way as not to interfere with the current operation of the system. Users that do not use the extensions should not see differences in the behavior of the system. 1.2
The Framework Figure 1.1 graphically depicts a simplified decomposition of a translator as well as the major components of the framework for generating a debugger for that translator. The debugger is subdivided into four components. The debugger shell is the user interface responsible for accepting user debugging requests and passing them to the query processor, the engine of the debugger. The query processor uses information stored in the information store as well as calls to the run-time library to evaluate the debugging requests. 1.2.1 Debugger Shell The task of the debugger shell is to provide an interface to users for entering commands and displaying the results of debugging. The simplest form of this is a command-line interface, which reads a line typed by the user and provides a method for displaying lines of output. Considerable research has recently been devoted to the exploration of more user friendly interfaces to debugging [5, 28, 43, 68]. This particular avenue of research, however, is beyond the scope of this thesis. Many of the approaches to providing more complex user interfaces for debugging demonstrate the viability of either building a wrapper around or instrumenting an existing line mode debugger. The framework presented in this thesis will assume a very simple line mode interface to the debugger with the understanding that more complex interfaces can
6 be constructed. Chapter 3 will discuss some embellishments that can be made to input processing to support features commonly found in line mode interfaces. 1.2.2 Information Store Different phases of textual translation create and store different kinds of information. For example, the lexical analysis phase will typically construct string and/or identifier tables. The name analysis phase of semantic analysis will typically construct an abstract data type to represent the scoping of identifiers. Eli has such an abstract data type, called the environment module, which is described in [40]. In addition to these, Eli provides a generic property storage module that facilitates the creation and manipulation of objects with a set of arbitrary properties of arbitrary types. Collectively, we can refer to these different kinds of information as the information store. Much of this information is not only useful in constructing the translator, but is necessary in constructing a source-level debugger. The kind of information required by the debugger is dependent on the translation, but much of the required information is computed by the translator regardless of any debugging needs. However, it is typically necessary to compute additional information in the translator specifically for use by a debugger. Most of the additional information usually has to do with the storage of coordinate mapping information, which allows the debugger to map between coordinates in the target text and coordinates in the source. Figure 1.1 shows a link between the information store in the translator and the one in the debugger. This link denotes the fact that the information store is made persistent for use by the debugger. The box representing the information store in the debugger is dashed to indicate that it is a subset of the information computed in the translator, since not all information is required by the debugger. Using a persistent storage mechanism to transfer information between the translator and debugger makes for an easy-to-use interface for both the translator and debugger. It is not necessary to invest the substantial effort required to write and read a standardized format for debugging information. The author of the debugger can also code to the same interface for data structures that the compiler uses. The common existing solution to the task of transferring information from translator to debugger is to use standardized debugging information formats, such as stabs [22] and DWARF [4]. The advantage that such standards have is that it is easier for a large number of debuggers to use the same standardized interface to debug code generated from translators that conform to the interface. Conformance comes at a price, however: authors of translators and debuggers must write substantial code to convert between their internal data structures and the standardized format. The ability to read the debugging information is also of little help if the debugger does not understand the semantics of the language being debugged. The goal of this research is to create debuggers for translators generated by a compiler generation system. Translators constructed in this manner are often for languages or language extensions for which debugging support is not readily available, i.e., existing debuggers would not properly deal with the semantics of the language even if they were able to read debugging information in a standardized format. Translators for existing languages may apply unique translation techniques or optimizations that are difficult to encode in
7 standardized debugging formats. Consequently, a majority of translators written using compiler generation systems would not benefit from the advantages of standardized debugging formats. The approach to persistence described here removes the cost associated with their use. 1.2.3 Run-Time Library The run-time library deals with the run-time state of the program being debugged, which includes extracting information about a program while it is running, modifying its state, and controlling the flow of execution. Since this task is unique to debuggers (as opposed to translators), it is the task for which little leverage is available from existing translator specifications. There are tools, however, to facilitate the construction of this component. Since we are interested in supporting translations to existing high-level source languages, it is reasonable to consider existing debuggers for those target languages as good candidates for providing debugging functionality. In this way, we avoid the necessity to map between the object code and the target language when debugging. We need only be concerned with the mapping required due to the translation performed by our own translator. Even in the case of a translation from a source language to object code, we can benefit from the use of an existing debugger. An existing debugger already provides capabilities for program tracing, examination of registers and memory, and signal handling. When more functionality is provided by the existing debugger, less must be implemented by hand. To utilize this existing functionality, it is necessary to construct an appropriate interface to an existing debugger, which can be accomplished with a combination of existing compiler generation tools and new tools. This thesis will discuss the use of a tool, called Expect [45], that can be used to devise a suitable interface to the functionality provided by any existing line mode debugger. 1.2.4 Query Processing The query processing component of the debugger is responsible for taking input from the debugger shell and performing the appropriate debugging function. Once again, the goal of this research is to leverage from specifications already provided in the translator. Most often, we are interested in providing a debugging language that does not differ greatly from the source language being debugged. Retaining the likeness between the debugging language and the source language minimizes the effort required by the debugger user in learning a new interface. In order to leverage existing translator specifications, one must examine what adaptations and requirements are necessary to use the existing compiler generation tools in an interactive environment. Once this is done, specifications for processing language elements that are part of the debugging language can be taken directly from the translator’s specifications. Specifications of lexical elements, syntax, and semantic analysis can all be reused, which not only simplifies development but also ensures uniform processing between the translator and debugger. Some specifications of the debugging language and its processing cannot be extracted from the translator’s specifications. For example, language features must often be added so that users can make reference to symbols in a particular scope, rather than only those visible at the current point of execution. Code generation in the translator must be substituted by calls to the run-time library. Specifications for the debugger are done in the
8 same high-level languages available for constructing the translator. 1.3
Related Work
Much of the related work for this thesis can be closely tied to a particular component of the framework. Related work that falls into these categories will be discussed in the chapter of the thesis that focuses on that component. This section talks about work related to the complete task of generating a debugger. In 1978, Mark Johnson first suggested the notion of a debugger generation system [31], which ... given a language definition, produces a language-dependent debugger for programs written in that language. [30, page 65]. As indicated before, most research efforts to date in generating debuggers, and programming support tools in general, have focused on providing tools in interpreted environments rather than providing tools for compiled code. For example, the PSG system [7] generates interactive environments that include a language-sensitive structure editor and interpreter from a set of specifications. The Synthesizer Generator [54, 60] and Centaur [9] both generate similar kinds of tools, but differ in the mechanisms used to produce these tools. One of the primary areas in which they differ is in the specification of dynamic semantics. PSG uses denotational semantics, the Synthesizer Generator uses attribute grammars, and Centaur uses what it calls “Natural Semantics”. The Gandalf project [27] produced another tool to generate language-sensitive structure editors. Ambriola and Montangero [1] developed a tool in conjunction with Gandalf that allowed automatic generation of execution tools, such as interpreters and debuggers. Dynamic semantics in their tool were specified using denotational semantics. Despite their differences, a central theme is the use of abstract syntax trees to describe semantic structure. The interpreters are based on execution of dynamic semantics related to particular abstract syntax tree contexts. Extensions for debugging in these systems then focus on controlling the execution of the dynamic semantics. The typical approach is to allow breakpoints to be set at specific nodes of the abstract syntax tree that correspond to source language constructs. Bahlke, Moritz, and Snelting [6] outline how this is done for PSG. A system called Maygen [61] provides a very different kind of support for generating debuggers. Maygen assumes the existence of components that implement a source language interface and a machine architecture interface. Using these components, Maygen manages a protocol between the two interfaces that results in a debugger. The advantage derived by Maygen is that different source language interfaces can be coupled with different machine architecture interfaces to yield debuggers that can operate on a variety of machine architectures. Because significant effort is required in providing the components for Maygen’s interfaces, it is not clear how much leverage is achieved. One other relevant area is that of debuggers for source to source translations. One of the few examples of such a debugger is described by Heymann [29]. This debugger debugs a translation from a simulation language called SIMSCRIPT II.5 to C.
9 1.4
Outline The next three chapters will focus on the major components of the framework: persistence of debugging information, query processing, and debugging functionality provided by the run-time library. The debugger shell is omitted, because exploration of complex user interface design for debugging is beyond the scope of this research. The simple command-line approach used in the remainder of this thesis was described in Section 1.2.1. Chapters 5 and 6 focus on application of the framework. The first of these chapters discusses modifications required to compilers for debugging purposes and the second discusses the actual construction of the debugger. The last chapter will make some concluding remarks as well as describe some avenues for possible future research.
CHAPTER 2 PERSISTENCE OF DEBUGGING INFORMATION In order to debug a program based on its original source code (as opposed to the generated target code), a debugger needs information about the translation of a particular input to its target code representation. The information is required to map backwards from particular target code constructs to the source code that created them. While the information required could be computed by the debugger from the original source program, doing so would result in a significant duplication of effort. The information required by the debugger is in large part information that the translator must compute anyway. Because information is required from the translator, we cannot consider the construction of a debugger in isolation. We must also consider how a translator can communicate information it has computed to the debugger. Our solution to this problem is to make the information and data structures of the translator persistent, so that they can be read by a debugger. The standard method for making compilation data persistent is to translate the information into a standardized format that can be stored as part of compiled object code. DWARF [4] and stabs [22] are two examples of such debugging information formats. This kind of standardization is useful for compilers that wish to be usable with a large number of debuggers. In a prototype compiler developed using a compiler generation system, having to convert information into this format and then read it from within a debugger brings about significant added effort. The representations of data used in a compiler generation system may be very different from the representations expected by a standard debugging format. Using a standard format is useless if there are no existing debuggers capable of debugging the source language in a meaningful way. In addition, translators whose target language is not object code cannot take advantage of standardized debugging formats. The goal of this thesis is to simplify the construction of debuggers in part by facilitating the reuse of translator specifications. To reuse these specifications, it is advantageous for the interface to the translator’s computed data structures to be the same for the debugger as they are for the translator. Using an approach to persistence that provides transparency of the interface to the data allows one to avoid complex conversions from internal data structures to standardized formats. The data structures computed by a translator and required by the debugger may be arbitrarily complex. They include data structures that are defined by the compiler generation system as well as those defined by the author of a particular translator. To accommodate this arbitrary collection of data types, a general-purpose mechanism for providing persistence in the translator’s implementation language is required. Such a mechanism is described in section 2.1. Use of the mechanism requires very few changes to translators and virtually no effort in making the information usable to the debugger. Application of the mechanism to the data structures found in a compiler generation system, and Eli in particular, is discussed
11 in section 2.2. 2.1
General-Purpose Mechanism for Persistence
Because we are interested in providing a persistence mechanism for arbitrary types, application of these techniques can be thought of in a much broader context. Instead of focusing only on their use for translators and debuggers, we can think of them as being applicable to any scenario in which we have a producer application storing information that is to be resurrected from the persistent store for use in a consumer application. This scenario is in contrast to many existing techniques that are designed for situations in which the producer and consumer are the same application. This difference is explored in section 2.3. There are a number of requirements that constrain the choice of the mechanism for persistence. The most important is the programming language used and generated. Some languages and language extensions provide direct support for persistence. PS-Algol is an example of such a language [3]. In Java, classes of objects can be made eligible for persistence by marking them as “Serializable” [2]. In general, implementing persistence for strongly typed languages is a great deal easier than for weakly typed languages, since it is possible to automatically determine the types of the objects being stored. The Eli System generates code that can be compiled both by C and C++ compilers.1 The ability to cast between pointer types and other typing loopholes make C and C++ challenging languages for which to provide persistence. The work described here for providing persistence has the following goals: • A portable solution to the problem of persistence, i.e., a solution that is not tied to a particular compiler or development environment. The primary focus is on persistence for C++ with the assumption that C code can be made to compile under C++ without too much difficulty. • The ability to selectively store information. The basic mechanism for determining persistent objects should be by reachability analysis from specified objects rather than persistence by class. This goal is not only to save space by reducing the information being stored, but also to filter out information that should not be exported. Determination of objects to be stored is done when reachability analysis is performed, not at object allocation time. • The flexibility to handle statically untyped data structures. In C and C++, it is possible to allocate chunks of storage and to use pointers to manipulate the contents of those chunks. Type information about the contents of a chunk may, in effect, be embodied by the semantics of the program. Since making data persistent requires some knowledge about the type of object being stored (in particular, the location of pointers), the mechanism chosen cannot be entirely automatic. The user must have a way to specify the type information that may be embedded in the semantics of the program. • An object naming strategy that allows any object to be named and resurrected given that name. • The ability to handle references to static data (or easily recreatable data) without 1 This is accomplished primarily by using the C preprocessor to provide code conditionally compiled depending on the compiler being used.
12 struct ListEntry { char *str; int encoding; ListEntry *next; }; Figure 2.1: Linked List Data Structure having to store that data in the persistent store. Note that there is no requirement in this application for distributed objects or transaction control. These are features often found in conjunction with persistence mechanisms, but they introduce unnecessary overhead and complexity to the problem presented here. The solution described here is a C++ library and headers called SOS (for Simple Object Storage). The original version of SOS was written by John Doppke [18]. This version provided class-based persistence, i.e., the decision about which objects to be made persistent was decided statically according to class. I modified the system to change this static policy to a dynamic one based on reachability analysis. I also made the additions to handle references to static data. 2.1.1 SOS Usage The user must provide additional code specific to SOS for each class of object that may be made persistent. Not all objects of such classes will necessarily be made persistent—this determination is made by reachability analysis from a set of root objects. To demonstrate what additions are required to use SOS, consider first the ListEntry data structure in Figure 2.1. This declaration has not been altered for use with SOS. The ListEntry example data structure is a node of a singly linked list that contains a string and an integer encoding of that string. Figure 2.2 shows the two modifications required to the declaration of ListEntry for use with SOS. The first modification is that ListEntry must inherit from the SOS defined class SOSObject. The second is the addition of the SOS_DECL macro to the public section of the declaration. The SOS_DECL macro takes the form SOS_DECL(classname). It is a macro that provides a number of declarations required by SOS to make the class persistent, including declarations for four methods that must be provided by the user. The prototypes for those four methods are shown in Figure 2.3. Figure 2.4 shows the code to implement those four methods for the ListEntry struct ListEntry : public SOSObject { char *str; int encoding; ListEntry *next; SOS_DECL(ListEntry); }; Figure 2.2: Persistent Linked List Data Structure
13
SOS::Size SOS_GetSize() const; void SOS_Write(SOS::Buffer&) const; void SOS_Init(SOS::Buffer&); void SOS_RegisterPointers(SOS *); Figure 2.3: SOS Function Prototypes
SOS_IMPL1(ListEntry, SOSObject); SOS::Size SOS_GetSize () const { return sizeof(int) + sizeof(SOS::ID) + SizeOf(Str); } void SOS_Write (SOS::Buffer& buf) const { buf str; buf >> encoding; SOS_InitPtr(buf, next, ListEntry); } void SOS_RegisterPointers (SOS *sos) { SOS_RegisterPtr(next, sos); } Figure 2.4: Code to Make ListEntry Persistent
14 example, as well as a call to the macro SOS_IMPL1. The four methods are responsible for providing persistence for the members of the class. The expansion of the SOS_IMPLn macros provides additional methods on a per-class basis. The additional methods ensure that the persistence mechanism is applied to all of the members of classes from which the current one inherits; the methods will be discussed in section 2.1.2 in conjunction with implementation issues. The SOS_IMPLn macros take the name of the class being made persistent as their first argument and all of the classes that this class directly inherits from as subsequent arguments. The n in SOS_IMPLn is the number of classes directly inherited from. The current implementation supports up to five classes that can be inherited from directly, i.e., n must be less than or equal to five. While it is highly unusual to directly inherit from a large number of classes, it would be possible to construct a generator that would allow for an arbitrarily large value of n, based on the largest number of classes directly inherited from. The SOS_GetSize method must return the number of bytes that will be written by the SOS_Write method. This is typically done by using the sizeof operator on each of the elements of the data structure. In the example of Figure 2.4, sizeof is used to determine the size of the integer member and the size of an object ID. Object ID’s are used to represent references to other objects instead of pointers. The type of an object ID is an SOS::ID. For string members, it is necessary to use the SOS-provided SizeOf function. This function corresponds to the representation of strings read and written by the stream operators (>) for SOS buffers. In this representation, an integer length precedes the actual string. The function SOS_Write provides the serialization of the data structure. Elements of the data structure are written to the buffer provided as argument to the function. This buffer argument can be used like a C++ stream. The stream has operators defined for it to deal with each of the basic C++ types and one for character pointers that treats them as strings. The simplicity of the code involved is demonstrated in Figure 2.4. Serialization of pointers involves writing the object ID of the object pointed to. The SOS header files export the macro SOS_WritePtr to simplify this repetitive operation. SOS_Init is the reverse of SOS_Write in that it initializes the data structure from the contents of the buffer supplied. Again the buffer is implemented as a C++ stream. Initialization of pointers involves checking to see whether the object referenced by the object ID has already been resurrected, in which case a simple table lookup yields the correct pointer value. Otherwise, the object must be resurrected. Again, a macro is provided to simplify operation on pointers. Note that this macro requires the class name of the object pointed to, as this is required by the resurrection operation. It is important to recognize that it would not be very difficult to write the SOS_Write and SOS_Init functions in such a way as to make the persistent representation of data be architecture independent. To do this would require defining constants for the size of basic data types in the architecture independent form and rewriting the buffer stream operators for the basic data types to read and write values in their architecture independent form. SOS_RegisterPointers is the function that enables SOS to perform reachability analysis of the objects to be made persistent. Objects are made persistent with respect to a particular persistent store that is identified by the argument to the method. SOS_RegisterPointers is responsible for invoking the SOS_RegisterObject method for
15 each object pointed to by the current object. If there are no objects pointed to by this class of object, the method body should be empty. As with the other three user-provided methods, a macro (SOS_RegisterPtr) is provided that encapsulates a check for a non-null pointer and the call to SOS_RegisterObject. Having users supply these four functions gives them a great deal of flexibility in choosing what data to store as well as dealing with statically untyped data structures. By “statically untyped data structures,” I mean data declarations for untyped buffers (character arrays in C/C++) that are used as containers for other data types defined by the application. The content of such a buffer is not decided by static definitions, but rather by the run-time semantics of the program. One example of a statically untyped data structure is the GNU Obstack module. This module manages a growing heap of objects in which allocation of a new object may be done incrementally and then finalized when allocation is complete. It can also be used as a substitute for normal object allocation using C malloc. Using it speeds up processing considerably for applications, like those generated by Eli, that allocate strings and large numbers of small-sized objects. The implementation of the heap is a series of large untyped buffers. Since the contents of untyped buffers are determined by the run-time semantics of programs, it is appropriate that the operations for making them persistent also be dependent on those semantics. In these cases, the flexibility to provide user code for the persistence operations, such as is done by SOS, is particularly valuable. The run-time semantics of an untyped data type, such as an Obstack, are typically defined by the type that makes reference to the Obstack, not the Obstack itself. As such, the persistence operations (SOS_GetSize, etc.) should not be associated with the Obstack, but rather with the referencing type. The persistence operations must consider whether to treat the objects stored in the Obstack as separate objects or simply as member data. The primary criterion for making this decision is whether or not the objects contained in the untyped area are directly referenced (not via some index) by other objects. If so, then it is typically desirable to treat the contained objects as individual objects with their own object ID’s, which allows references to those objects to be stored in the normal way. If there are no direct references to the contained objects, then it suffices to treat those objects simply as member data and not assign object ID’s to them. In addition to the above information, the method RegisterClasses for the SOS class must be provided by the user. The purpose of this method is to register the names of classes that may be made persistent with the functions that resurrect objects of those classes. The symbolic names of the classes must also be provided as a static character string field of each persistent type. The only pieces of this information relevant to the user are the names of the classes that may be made persistent. For this reason, I implemented a processor that takes the names of classes (and the names of the header files that declare those classes) and emits not only the RegisterClasses method for the SOS class, but also the static member fields for each class that specify the name of the class. Figure 2.5 shows a sample input to the processor and Figure 2.6 shows the resulting output. Figure 2.5 gives the names of two classes, PropList and PropElt, as well as the
16 PropList "deftbl.h" PropElt Figure 2.5: Input to the SOS processor name of the header file that declares them (deftbl.h). In the output of Figure 2.6, one sees that deftbl.h is included as one of the headers. The RegisterClasses method of the SOS class contains several lines of boiler-plate code to initialize the hash table used to hold the mapping between class names and their resurrection functions. Each subsequent line of the function uses the RegisterClass method to enter one of these mappings into the hash table. The first is always for the SOSObject class and the subsequent ones are those specified by the user. The resurrection function for a class is always the SOS_Factory method of its class. This method will be described in the next section. The last two lines of the output are the static initializations of the _pd_classname member of each class that provides the string representation of a class’ name. Automating the generation of the RegisterClasses method and the static class member strings was relatively easy. Generating the other SOS-required methods automatically poses a greater challenge. While much of the code shown in Figure 2.4 is mechanical in nature, a suitable specification language would have to be designed to capture the configurable aspects of the output in order to retain the flexibility afforded when writing the methods by hand. In addition, a generator would require information about the types being made persistent. This information could be extracted by parsing the original code containing declarations of the data types, however parsing C and C++ is in itself a nontrivial task. Users wanting to translate C code to C++ must also be aware of the need to use the C++ new operator to allocate memory for persistent objects. In C++, the only objects that do not need to be allocated using the new operator are objects that belong to classes that do not inherit from any other classes and do not have virtual functions. Since the modifications to classes required by SOS include virtual functions as well as inheritance from SOSObject, use of the new operator becomes necessary. Without this, C++ will not appropriately initialize virtual function tables necessary to the proper operation of the persistence mechanism. Once the necessary data structures have been instrumented as described above for use with SOS, creating and reading a persistent store is trivial. Consider again the instrumented example data type from Figure 2.2 (the ListEntry class). Assume also that an application has been created that has a global variable called TestList that is a pointer to a linked list of ListEntry’s. Figure 2.7 shows code that can be used to store the linked list pointed to by TestList to the file TestData. The first line of code uses the new operator for the SOS class with the name of the persistent data file to create. This creates a persistent store object that is used in subsequent calls to SOS defined methods. The second statement calls the SOS_RegisterObject method for the object pointed to by TestList to mark that object and all objects transitively referenced by that object as being persistent objects. The call to SOS_DefineName assigns the symbolic name StringList to the object pointed to by TestList. StringList is consequently the name by which the object can later be resurrected. Finally, the call to
17
#include "sos.h" #include "deftbl.h" void SOS::RegisterClasses() { if ( !_get_init() ) { _pd_ht_class = new HashTable( NULL ); _set_init(); SOS::RegisterClass( "SOSObject", SOSObject::SOS_Factory ); SOS::RegisterClass( "PropList", PropList::SOS_Factory ); SOS::RegisterClass( "PropElt", PropElt::SOS_Factory ); } } const char* PropList::_pd_classname = "PropList"; const char* PropElt::_pd_classname = "PropElt"; Figure 2.6: Output from the SOS processor
extern ListEntry *TestList; SOS *PStore = new SOS("TestData"); TestList->SOS_RegisterObject(PStore); TestList->SOS_DefineName("StringList"); PStore->Flush(); Figure 2.7: Creating and Writing to a Persistent Store
18 SOS *PStore = new SOS("TestData"); SOS::ID id = PStore->GetNameID("StringList"); ListEntry *TestList = SOS_Resurrect(PStore, id, ListEntry); Figure 2.8: Reading from a Persistent Store the Flush method of the persistent store object causes all objects that had previously been marked/registered to be written out. Reading the data from the persistent store is similarly straightforward and is demonstrated in Figure 2.8. Error checking has been omitted for brevity in the example. The persistent store is opened for reading exactly as it was for writing: the new operator is used for an object of type SOS with the name of the persistent store file as its argument. The function GetNameID extracts the object ID for the object named with the given symbolic identifier. This ID is then used by SOS_Resurrect to resurrect the object. Note that resurrection of an object causes resurrection of all objects transitively referenced by the object specified. 2.1.2 SOS Implementation The interface to SOS described in the last section is implemented as a combination of C preprocessor macros and an object library that is linked with the application. The object library contains the definition for the SOS and SOSObject classes as well as the buffer operations used for reading and writing basic data types. The macros provide the class by class implementation of the functions required to make the interface work. As indicated in the last section, the steps needed to make data persistent involve first registering the objects to be made persistent and then invoking a flush operation to write them out to a file. Object registration is implemented by creating a new object ID for the object, entering the object ID and its pointer in a hash table, and registering all objects pointed to from the current object. Cycles are avoided by not following pointers for objects that already have an object ID, i.e., they already have been registered. With each of the four user-provided functions described in the last section (SOS_GetSize, SOS_Write, SOS_Init, and SOS_RegisterPointers), it is important that the behavior of the persistence mechanism consider not only the members of a particular class, but also all of its inherited members. For this reason, each of the four functions has a corresponding version to deal with inheritance. These are called SOS_InhGetSize, SOS_InhWrite, SOS_InhInit, and SOS_InhRegisterPointers, which we will call the inherited versions. These functions are automatically supplied when the SOS_IMPL macro (supplied by the user) is expanded. Recall that the SOS_IMPL macro takes as arguments the name of a class and all of its direct supertypes. The implementations for the four inherited versions of the functions simply invoke the inherited versions of the direct supertypes before calling the non-inherited version of the function. For example, the implementation of SOS_InhGetSize would call the version of SOS_InhGetSize associated with each of the direct supertypes before making a call to SOS_GetSize. In this way all inherited member variables are accounted for. After all objects have been registered, the user may flush the objects to a file. Flushing the objects is accomplished by iterating through the hash table of objects, creating a buffer whose size is determined by invoking the SOS_InhGetSize method for the object, and invoking SOS_InhWrite to write the object to the buffer. The object ID, the name of
19 the class to which the object belongs, and the buffer are then written to the file. When the persistent store is initialized to be read, the information described in the last paragraph is loaded into SOS internal hash tables. At this point, all objects simply reside in their buffers. The user may then resurrect an object given an object ID. The mapping of symbolic names to object ID’s (as established by the SOS_DefineName method) is stored in a separate section of the persistent file format and can be queried using the GetNameID method. Resurrection of objects takes place by first determining the appropriate classspecific function to perform the resurrection. The mapping between names of classes and their resurrection functions is statically established in the definition of the function SOS::RegisterClasses, which makes calls to SOS::RegisterClass for each class that may be persistent. Figure 2.6 shows generated output that provides the definition of SOS::RegisterClasses. The resurrection functions (also called Factory’s) are responsible for allocating an object of the correct type using the C++ new operator, initializing the object with its appropriate object ID, entering the newly created object into an SOS internal hash table, and then invoking SOS_InhInit to initialize the contents of the data structure. The SOS_Init functions are also responsible for transitively resurrecting all objects pointed to by the current one. To avoid circularity, the resurrection operation checks to see whether the object has already been resurrected by consulting the internal hash table mentioned above. While the contents of the object may not have been resurrected entirely, the pointer to the object suffices to make a reference to it. 2.1.3 Dealing with Static Data Most applications have both dynamic and static data. In this context, “static data” refers to data that does not depend on a particular input to an application, while “dynamic data” is sensitive to the input. The techniques described so far for making data persistent make sense when applied to the dynamic portion of the data. However, applying the same techniques to the static data of the application would result in a waste of time and space. For each possible input to the producer application, the same data would needlessly have to be stored and resurrected. Instead of storing the static data, one can copy the static data declarations from the producer application and make them part of the consumer. Copying the declarations avoids the time and space associated with storing and resurrecting the data. The problem is to ensure that references from the dynamic data to the static data remain intact when the dynamic data is stored. Storing a reference to static data should not cause the data to be placed in the persistent store. Resurrecting a reference to the static data must correctly reference the equivalent data definition supplied in the consumer application. To ensure the correctness of references to static data, SOS allows an object to set a static name for itself. The same static name must be used for the object declared in the producer application and the equivalent declaration in the consumer. This can typically be accomplished with a special constructor for the object that takes the static name as an argument. The constructor must make a call to SOS_SetStaticName to set the name and to SOS::RegisterStatic to register the object with the persistent store. In the course of writing out referenced objects to the persistent store, a check is made to see if the object is a static object, in which case the static name is written rather than the actual object.
20 At resurrection time, when a static name is found it is resolved to the object which has registered itself under that static name, i.e., the copy of the static object in the consumer. 2.2
Application of SOS to Compiler Data Structures While it is impossible to anticipate all of the kinds of data that could be computed and stored by a translator, there are a number of basic data representations that are present in almost every translator. Compiler generation systems that do not provide support for these data force their users to construct their own interfaces. String and identifier tables are one example of data that appears in almost every translator. Most translators also require some means of creating objects that represent linguistic entities, as well as an interface to manipulate the properties of those objects. Collectively, these objects can be referred to as the definition table. Data types that store information about textual coordinates and scoping of identifiers are yet other examples of common compiler data structures. The remainder of this section will focus on the application of SOS to Eli’s definition table interface as well as its string and identifier tables. Support for persistence in these components requires principles beyond the straightforward application of SOS described in the last section. 2.2.1 Persistence of a Definition Table The definition table interface in Eli consists of a fixed portion and one that is generated from a specification written in PDL (for Property Definition Language) [32, 63]. The fixed portion exports a type representing a definition table key, DefTableKey, an operation to create new instances of these keys, and a generic accessor function. The PDL language allows users to specify a set of properties, their types, and access operations (a default set is provided). From a specification written in this language, a generator creates a module that exports the specified access operations on definition table keys for the specified set of properties. Providing persistence for the fixed module is not difficult—it is a straightforward application of the methods described in the last section. What requires further examination is how to apply these methods to the generated component of the interface. SOS requires additions to be made to the declarations of persistent data types. Since the generator for the PDL language generates data types to hold property values, modifications must be made to the generator to support persistence. Modifications are also required to allow the debugger and translator to successfully share the definition table interface. The implementation of definition table keys is a simple linked list of objects whose base type is PropElt. PDL is a very simple language that associates named properties with their types, allows the specification of specialized access functions for particular properties, and allows specification of statically initialized definition table keys. The feature for supplying specialized access functions is not relevant to the discussion of persistence given here, but the other two features are. For each type of property given in a PDL specification the generator for the PDL language generates a node data type that is a subtype of PropElt and has a member to hold the property value.2 Figure 2.9 shows what this type looks like for integer-typed properties. 2 The PDL generator described here is one which was modified to generate C++ code. The version currently in use generates C code.
21 struct intElt : public PropElt { int PropVal; intElt() {}; intElt(Entry n, int s, int v); static PropElt *create_intElt(); }; Figure 2.9: Class for Integer-Typed Properties Each property also has a positive integer selector assigned to it, such that it is possible to identify the property of a particular object. This selector is a member of the PropElt class. Access functions for definition table keys must at a minimum take the definition table key and property selector as arguments. All access functions eventually call a generic accessor function called find whose prototype and interface specification is given in Figure 2.10. The find function traverses the list of objects pointed to by the definition table key looking for a match for the selector provided as argument. Each specialized access function is provided at most once for each type of property specified in the input, i.e., if multiple properties have the same type, a particular access function is only provided once for that set of properties. Separate functions are not required for each property, because the integer selector is used to distinguish objects representing different properties. In order to simplify the interface for users, the mapping of property names to integer selectors is embedded in macros that are defined for each property and each corresponding access function. These macros make the appropriate function call with the assigned selector for that property. The first step towards persistence of this interface was to modify the generator for the PDL language to include the appropriate infrastructure for persistent data described in the last two sections. This includes an SOS_DECL declaration in each node type declaration (such as intElt shown in Figure 2.9) as well as an SOS_IMPL declaration in the compilation unit exported by the PDL generator. The next problem is that of providing the four persistence functions (SOS_GetSize, SOS_Write, SOS_Init, and SOS_RegisterPointers) for each of the node types. The node types are not exposed parts of the interface for the user, so it is undesirable to force the user to provide the functions for this unknown data type directly. Instead, the PDL generator defines the four functions with calls to macros to perform the property type specific actions. These macros are what is left for the user to define. There is one macro for each of the four functions: SOS_Size_typename, SOS_Write_typename, SOS_Init_typename, and SOS_Register_typename. The definitions for these macros are typically very simple. Figure 2.11 shows definitions of the four macros for three different types of data. The first set is for the built-in data type int, the second is for a pointer type ptr which points to a type pointedto, and the last is for a data type typ that has been appropriately instrumented for use with SOS. In supporting persistence for this definition table interface, we would also like to be able to select the set of properties that need to be made persistent. Not only does this save space, but it also removes the requirement for adding the persistence infrastructure
22
int find(DefTableKey key, int p, Entry *r, PropElt *(*add)()) /* Obtain a relation for a specific property of a definition * On entry* key=definition whose property relation is to be obtained * p=selector for the desired property * add=function to create a new element of the appropriate * type or NULL * If the definition does not have the desired property * then on exit* find=false * if add != NULL then * r points to a new entry of size add for the property * else * r points to the entry following the entry for * the property * Else on exit* find=true * r points to the current entry for the property ***/ Figure 2.10: Definition Table Generic Accessor Function
#define #define #define #define
SOS_Size_int(val) sizeof(int) SOS_Write_int(buf,val) buf > val SOS_Register_int(val,sos)
#define #define #define #define
SOS_Size_ptr(val) SOS_Write_ptr(buf,val) SOS_Init_ptr(buf,val) SOS_Register_ptr(val,sos)
sizeof(SOS::ID) SOS_WritePtr(buf,val) SOS_InitPtr(buf,val,pointedto) SOS_RegisterPtr(val,sos)
#define #define #define #define
SOS_Size_typ(val) SOS_Write_typ(buf,val) SOS_Init_typ(buf,val) SOS_Register_typ(val,sos)
val.SOS_GetSize() val.SOS_Write(buf) val.SOS_Init(buf) val.SOS_RegisterPointers(sos)
Figure 2.11: Macros for PDL Property Types
23 for data types that do not need to be made persistent. To accomplish this, an additional notation is required in the input language to indicate which properties are to be made persistent. The existing notation for specifying properties in PDL is a comma separated list of property names followed by a colon and ending with the name of the type for those properties terminated with a semicolon. The change made to the input notation specifies that a double colon be used instead of a single colon to indicate properties that should be made persistent. Properties may be declared more than once and may be declared with both a single colon and a double colon, in which case the property will be made persistent. This facility allows a user to easily add a specification for persistence to an existing set of specifications without making any modifications to the existing specifications. Given this additional notation, the PDL generator can decide whether or not SOS declarations are required for each of the types involved in the PDL input specification. Any type that is associated with a persistent property must have the SOS declarations and function definitions provided. In addition, an array of selectors is generated that contains the selectors for the properties that should be made persistent. Code in the SOS_Write and SOS_RegisterPointers methods for the PropElt class can be modified to skip over nodes that have selectors that are not in the array, i.e., properties that should not be made persistent. The above mechanisms describe how the producer of the information can make the objects persistent. It is also necessary to consider how the consumer will resurrect the information, and in particular how this can be done while allowing the consumer to use the definition table interface for its own purposes. For this purpose, the PDL generator generates an additional piece of output which is itself a PDL input specification. This specification can be exported by the producer to the consumer to indicate which properties have been made persistent along with the selector numbers used for those properties. Without the selector numbers, the consumer would be unable to correctly identify the property and type of the nodes in the list representing a definition table key. Providing the selector numbers requires an additional piece of notation to be added to the PDL input language. The notation chosen was an optional parenthesized integer following a property name. Users never need to use this notation unless they are interested in fixing the selector chosen for a particular property. Where selectors are not supplied in the input specification, the PDL generator is free to choose an arbitrary one. To simplify the export of the PDL persistence specification from the producer to the consumer, an additional derivation is added to the Eli system that provides the exported PDL specification. This derivation can be used directly in the specification of inputs for the consumer application. There are cases in which a consumer application may want to take its input from more than one producer application. For example, a debugger may want to operate with more than one language compiler. In this case, it is necessary to daisy-chain the application of the PDL generator, i.e., the PDL export derivation from one translator must be fed as input to the PDL generator for the next translator and so on until the last PDL export derivation is fed as input to the consumer application. This daisy-chaining is required to avoid an overlap in the choice of selectors for eventual use in the consumer application. The one disadvantage to this approach is that users must ensure that the same property name is
24 False -> Value = {0}; True -> Value = {1}; Value: int; Figure 2.12: Statically Initialized Keys in PDL not used with different types in the producer applications. As noted before, PDL also provides a means for specifying statically initialized definition table keys. An example is shown in Figure 2.12 that defines two definition table keys, False and True. Both have their Value property set. Value is an integer-typed property that indicates an internal value used in computations involving False and True. I modified the PDL generator to treat statically initialized definition table keys as static data as described in section 2.1.3. A resulting disadvantage is that modifications and additions made by the producer application at run-time to the set of properties associated with a statically initialized key will not be reflected in the consumer application. An advantage is that users have the flexibility to initialize the equivalent key in the consumer application with whatever properties and values they want. Although the same set of properties and values are typically desirable, this flexibility becomes useful when there are slight variations in the data representations used by the producer and consumer. 2.2.2 Persistence of the String and Identifier Tables Eli’s string table is implemented as an array of pointers to strings. The interface to the string table is an index into this array. Storing the string table is a matter of storing all of the strings referenced by the array of pointers in the order they appear in the array. In this way, they can be restored with the indices unaltered. Since an array of indices is not a C++ class, one must create a wrapper class that has no data members, but is instrumented as a persistent class for SOS. Introducing such a class allows one to write the necessary code to make the string table persistent in the SOS-defined methods of the wrapper class. A difficulty arises, however, because both the translator and debugger make use of the string table. The debugger may need to make entries into the string table before the string table from the translator is restored. These initial entries made by the debugger cause the indices for all of the strings restored from the translator to be offset by the number of entries already stored. Any other restored data types that make reference to string table indices would have incorrect indices. To solve this mismatch of indices, data types that restore string table indices must translate between the string table index stored and the correct string table index in the restored version. Based on the requirements of the string table alone, this translation could consist simply of adding an offset to every string table index. The requirements of the identifier table, however, require the use of a translation table that maps between indices in the saved string table and the restored one. The identifier table exists in order to maintain a unique representation (in this case, a string table index) for each string within it. A hash table is used to store the correspondence between strings and their indices. The translator and debugger should have the same index for identifiers that are the same. Otherwise, identifiers entered in the debugger would not
25
Translation Table
String Table
1
3
1
foo
2
4 1
2
bar
3
5
3
main
4
6
4
foo
5
x
6
y
Figure 2.13: Restoration of the String and Identifier Tables properly correspond to the identifiers restored from the translator. The solution to this problem is demonstrated in Figure 2.13. The first two entries of the string table (foo and bar) were entered in the string and identifier tables of the debugger prior to resurrecting the translator’s string table. When the translator’s string table is restored, the strings “main,” “foo,” “x,” and “y” are entered in the string table and the string index translation table is updated to indicate the correct indices. (The index of main in the translator was 1, but appears at index 3 in the debugger, and so on.) When we resurrect the translator’s identifier table next, foo already has an entry in the identifier table, so we do not add a new one. However, we do update the translation table entry for foo to point to the original foo entered by the debugger. This update is shown in Figure 2.13 by the crossed out 4 and newly entered value of 1. Where string table indices are used as definition table properties, another modification is required. It must be possible to perform the string table index translation when restoring properties that contain indices. To do this, it must be possible to distinguish properties that are string table indices from simple integers. For this reason, the type CsmIndex is introduced for which it is possible to introduce the PDL persistence macros described in the last section that perform the index translation. 2.3
Related Work The SOS library described and used in this thesis is essentially a stripped-down version of the Persi Persistent Object System Library [67]. The complexity of the interface provided by Persi and its reliance on non-portable storage managers were the primary reasons for creating a simpler library. Features of Persi that complicate its interface include transaction management and the variety of policies it supports for object residency. The work here assumes that it is sufficient to simply store and load the entire persistent store rather than worrying about the residency of individual objects. The fact that SOS does not use a storage manager also makes it highly portable. Less portable approaches to generic persistence involve the use of virtual memory hardware to write and read persistent data. The Texas Persistent Object Store [55] and ObjectStore PSE product [47] use this approach. Both of these systems require that persistent objects are allocated with a specialized version of C++’s new operator. Using a specialized
26 new operator can require pervasive changes to an application to make objects persistent. It also requires that the application be able to determine at object allocation time whether the object should be persistent. Yet another approach is the use of schemas or interface definition languages (IDL’s) to describe the data that is to be made persistent. Didriksen et al., discuss the use of IDL [64] as the data model for use in a programming environment database in [16]. Powell and Linton [52] describe the use of a relational database to support persistence of information in programming environments. Their approach requires specifying the persistent data types in a database schema language. The difficulty with these solutions is that the languages can restrict the kinds of data that can be stored and require a separate specification describing the persistent data types.
CHAPTER 3 DEBUGGER QUERY PROCESSING The primary goal of the framework is to create debuggers that allow users to debug at the level of the source language being debugged. Debugging at the source level means that users should be able to phrase their requests to the debugger in terms which utilize both the concepts and the phrase structure of the source language. Examples of requests that utilize source language concepts are requests that evaluate source language expressions or set breakpoints on user-defined functions. Making the phrase structure of the request language mirror that of the source language has a great advantage to users: Users need not learn an entirely different language to express concepts that already have a notation in the source language. When evaluating source language expressions in the debugger, the user does not need to be concerned that the expression semantics applied by the debugger may be different than the semantics applied by the translator. When cutting and pasting expressions from the source program into the debugger, it makes particular sense to retain the source language semantics. Similarity between a debugger’s request language and the source language can also lead to an advantage in implementation. The framework described here has a query processing component that is responsible for processing interactive requests and using the information store and run-time library to take appropriate action. Significant leverage can be achieved if specifications used for the source language translator can be reused in specifying the processing of the debugging request language. Note that I assume the existence of a debugging command language as the primary means of interaction with the debugger. Some debuggers avoid the use of a command language altogether by providing all functionality only through a graphical user interface. The absence of a command language, however, restricts certain kinds of uses for a debugger. For example, command languages allow scripted interaction by which information about a particular run of a program can be extracted without explicit user interaction. The presence of a command language also does not preclude the existence of a graphical user interface. To facilitate the use of translator specifications in specifying the request language of the debugger, the framework described here makes use of the same set of specification languages and tools as are used in implementing the translator. The query processing component of the framework can be decomposed very much like the translator, whose decomposition was shown on the left side of Figure 1.1. A decomposition of the query processing component is shown in Figure 3.1. The query processor’s decomposition differs from the translator’s only in the final stage of processing. Instead of generating target code as the translator does, the debugger interprets or evaluates the command using calls to the information store and the run-time library. In Section 3.1, I will discuss the elements of the query processor decomposition with particular emphasis on what parts of a source language translator specification can be reused
28
Query Processor
lexical analysis
syntactic analysis information store semantic analysis
interpretation & evaluation
Figure 3.1: Decomposition of the Query Processor
29 and what additions and modifications are required. While a debugging request language is linguistically not unlike any other language, the interactive nature of the input and output stream does place some requirements on the tools used to process the language. Section 3.2 will discuss what those requirements are. Use of standard text processing tools to process interactive input makes providing some user interface features more difficult. Section 3.3 will discuss how standard tools can be adapted to provide some of these features. 3.1
Leveraging Translator Specifications A debugger’s request language can be divided into two components: those parts that are specific to debugging and those parts that are specific to the source language being debugged. I call the former the debugging component and the latter the source component. Examples of the debugging component include commands for controlling the run-time execution of the program, examining the run-time stack, and setting options of the debugger. The source component is involved with source language concepts such as procedure names and arithmetic expressions. As indicated before, my framework supports the use of the same specification languages that are used in specifying the translator. Lexical analysis is described by a set of regular expressions describing the tokens of the request language. Syntactic analysis is specified using an EBNF grammar that defines the phrase structure. These specification methods are common to most compiler generation toolsets. Semantic analysis in Eli is described by an attribute grammar that defines computations over abstract syntax trees. Using an attribute grammar allows the specification of computations and dependencies to be separated from the tree traversal strategy [36]. This separation of concerns greatly simplifies the composability and reuse of existing specifications. Being able to reuse translator specification fragments and compose these with specifications specific to a debugger is one of the central themes of the framework described by this thesis. Without the use of an attribute grammar, reuse of semantic computations requires significantly more effort as it may be necessary to devise an entirely new tree traversal strategy by hand. The rest of this section examines each element of the query processor decomposition shown in Figure 3.1 in greater detail. The information store is omitted here since its use was described in detail in Chapter 2. 3.1.1 Lexical Analysis The debugging component of the request language often consists primarily of literal keywords organized into commands. For example, a command to examine the run-time stack might consist of just a single keyword. Commands to trace execution of the program might consist of a keyword with an optional number indicating the number of times to resume execution. In specifying the tokens of an input language, Eli allows users to omit the specification of literal symbols that can be extracted from the grammar specification, which means that only the non-literal tokens need to be specified directly. Because the debugging component is made up mostly of literal keywords, it requires very little in the way of lexical specification. The terminal symbols that may require specification for the debugging component include numbers to represent counts and source line numbers. Since most source languages have a concept of an integer, the lexical specification for these numbers may in
30 many cases be easily provided by using the source language’s specification for integers. The tokens for the source component of the request language mirror those specified for the source languagem, which include the source language’s concept of identifiers and numeric values. These specifications can be taken directly from the specification of the source language translator. Consequently, the effort required in creating the lexical specification for the complete request language will typically consist of little more than copying the lexical specification of the source language. 3.1.2 Syntactic Analysis The source component has a greater syntactic complexity than the debugging component, because the syntactic structure of the debugging component is not typically recursive and consists primarily of keywords and literals organized into commands. The source component by contrast is typically recursive and retains much of the complexity of the source language. It is also the source component for which the most leverage can be provided by reusing specifications from the translator. Specifying the phrase structure for the source component of the request language is primarily an exercise in copying relevant EBNF rules from the phrase structure specified for the translator of the source language. For example, it is common to allow for source language expressions to appear in the debugging request language. To do this, the author of the debugger must isolate the nonterminal symbol which represents expressions in the translator’s syntactic specification and extract the set of rules which are reachable from that nonterminal symbol. A tool could easily be constructed that extracts the set of rules reachable from a specified nonterminal. Some changes to the source language phrase structure may be required to adapt it for use in a debugger. For example, it is typically desirable for a debugging request language to have more flexibility in specifying identifiers that appear in different scopes. The notion of scope determines the visibility of identifiers at any particular position in the input. Because debugging requests are not part of the input program, we evaluate expressions with respect to a particular scope (known as the “current scope”). To provide the flexibility to reference identifiers outside of the current scope, notation is required that is not needed as part of the source language. For example, in a language like Pascal that has nested procedures, identifying a variable reference in a different scope requires specifying the hierarchy of nested procedures in which the variable reference is embedded. Nonlocal references might be specified in the debugging request language by a colon-separated list of identifiers preceding the variable name. Such syntactic changes are typically very easy to make since they are localized to particular nonterminals in the grammar. 3.1.3 Semantic Analysis The task of semantic analysis can be further subdivided into name and type analysis. Name analysis is responsible for consistently renaming identifiers, i.e., establishing a correspondence between identifiers that represent the same conceptual object and any declarations for that object. Type analysis is responsible for determining a type for every object and each tree context that represents operations on those objects. In both cases, the analysis includes reporting errors when inconsistencies are found. The last section highlighted some of the issues involved with providing name analysis in a debugger. In particular, it is important to note that the scope for a debugging request
31 is not defined by the stream of input associated with the user input to the debugger, as would be the case for a normal source program, but rather is dynamically alterable. Changing the scope of evaluation means that future debugging requests (until the next change) are evaluated as though they appeared in a particular scope of the program being debugged. For example, most debuggers will alter the scope in which debugging requests are evaluated each time the current point of execution changes. Many debuggers also provide commands that allow users to alter the scope of evaluation. For example, the up command in the gdb debugger changes the current scope of evaluation to be the scope associated with the stack frame of the calling routine [23]. The implementation of scoping rules in Eli uses an abstract data type described by Kastens and Waite [40], which is implemented as a tree of scopes. Each scope maintains the relationship between identifiers and definition table keys (definition table keys are described in detail in Chapter 2). Children in the tree of scopes represent nested scopes. Looking up an identifier in a particular scope involves checking for an occurrence of the specified identifier in the relationships recorded for the current scope and proceeding to look in each successive ancestor scope if the identifier is not found. It is clear from the above debugging requirements that information about the scope of identifiers in the source program must be preserved. This can most easily be done by applying the techniques described in Chapter 2 to the module implementing the abstract data type for scoping. However, this information is not sufficient for the usage patterns employed by the debugger. One requirement is the ability to set the current scope based on the current execution point in the program. As will be discussed in greater detail in Chapter 5, the current execution point is defined by a particular location in the target program (the program counter address for object code or a line number for higher level target language representations) that can be mapped back to input text coordinates of the source program. Consequently, we must be able to locate a particular scope based on the source program coordinates of a point embedded in that scope. This access method is significantly different from access methods used when processing the source program. When processing the source program, a particular point in the source program is not represented by coordinates but rather by a context in the abstract syntax tree. The enclosing scope is typically determined by the nearest ancestor node in the abstract syntax tree that has the scope defined as an attribute. For example, a nonterminal representing a function body would typically have an attribute that was the scope to hold definitions from the body of that function. Nested below the function body node in the abstract syntax tree might be an identifier reference that is to be looked up in the scope defined for the enclosing function body. For the purposes of translating a source program, the data structure representing a scope does not need to store information about the source coordinate extent of a particular scope because this information is implicitly available as part of the abstract syntax tree. For debugging, however, being able to find a specific scope based on source coordinates requires knowing for each scope what source coordinates it encompasses. This information must be added to the scope data structure to support debugging. More specifically, we are interested in finding the scope whose range of coordinates
32 most closely encloses the given source coordinates, i.e., the most deeply nested scope visible at the given point. Finding the correct scope involves a search of the scoping tree beginning at the root. The search looks for a child whose source code extent encloses the specified point. Only one such child can be found since the source code extents of scopes at a particular nesting level should be disjoint. If such a child is found, then the search proceeds from that child. Otherwise, the parent is the closest enclosing scope. A function that performs this search can easily be made a standard function available as part of the provided scoping module. Aside from the source coordinate extent of a scope, there may be other properties of a scope that are useful to preserve in conjunction with a particular scope. For example, in the case of a language like Pascal, functions and procedures may have the same names if they appear in different scopes, which means that unique labels must be created when generating assembly code. These labels are an example of a property that is useful to store in conjunction with a scope. In order to not restrict the kinds of information that can be stored for a particular scope, it makes sense to associate a definition table key with scopes so that arbitrary properties can be stored. Type analysis benefits greatly from existing translator specifications. Assuming that the goal in writing the debugger is to support a subset of the expressions available in the source language, there is no significant difference in the analysis of types when dealing with a source program as opposed to a debugging request language. Implementing type analysis for the debugger involves copying the type analysis computations from the translator’s specifications that are relevant to the subset of the expression language supported by the debugger. Some simplifications may be made in extracting this subset. For example, the translator may make a distinction between constant and non-constant types to simplify the task of constant folding. In an interpretive environment (such as is being created for debugging), this distinction is unimportant since all expressions will be evaluated by the processor anyway. 3.1.4 Interpretation and Evaluation The last phase of query processing is responsible for evaluating the debugging requests, which involves performing any necessary computations with the aid of the information store and run-time library. In this section, the focus is on the evaluation of source language constructs. Other classes of debugging queries include those that control the run-time execution of the program and those that set options for the debugger. The complexity associated with managing the former is not in the query processing, but rather in the run-time library which will be discussed in greater detail in the next chapter. Setting debugger options is primarily a matter of using commands to set state variables and will not be discussed further. As noted in the introduction, the run-time library is actually based on an existing debugger. As a result, the ability to evaluate source language constructs depends greatly on the facilities provided by that existing debugger. If that debugger emulates a majority of the constructs of the target language, it may be possible to simply use the code generation engine of the translator to generate code that is passed to the run-time library (the existing debugger) for emulation. Where the run-time library supports less emulation of the target
33 language constructs, the interpretation of the source language constructs must be done by the query processor. For the purposes of evaluation, source language constructs can be split into two categories: those that provide explicit statement-level control flow versus those that do not. Loops, conditionals, and subprogram invocations fall into the first category, whereas expressions and assignments fall into the second category. Source language constructs in the first category are usually more difficult to emulate in a debugger than constructs in the second category, which is why many debuggers do not support the emulation of statementlevel control flow. The framework described in this thesis also does not provide any explicit support for this feature. When the target language is object code, the techniques described in section 3.4 for dynamic code generation are likely to be the most promising for supporting the emulation of such constructs. On the surface, it would appear that evaluation of expressions differs substantially from the code generation phase of the translator. However, if the translator performs basic constant folding one discovers that evaluation of expressions can be viewed as a hybrid between the code generation and constant folding done by the translator. Constant folding mimics many of the operations of the source language on constants found in the input. As long as we are able to produce constants in the place of variable references, the constant folding computations will yield the desired result. To produce constants from variable references, calls must be inserted to the run-time library to extract the runtime values of the variables which can be used as the constants in the constant folding computations. Of course, not all operations of the source language are necessarily candidates for constant folding. In particular, operations involving address computations for array subscripts or structure field specifiers are not since the address of an array or structure will never be known statically. In these cases, the code generation computations must be adapted to work in interpretive fashion, i.e., the code must be changed to perform the computations instead of emitting instructions. 3.2
Compiler Generation System Support for Interactive Processing Compiler generation systems are typically designed with batch processing applications in mind. Some additional issues must be considered when trying to use the same tools in an interactive environment such as the processing of debugging queries. For example, the input source to the processor should be easily configurable, so that it is possible to embed code that issues prompts to the user when more input is expected. In processing debugging queries, there is also the requirement that all processing for one query be completed before beginning to read a new query. Without this requirement, users would not be able to see the results of their queries until future queries had been issued. The requirement holds for all interactive applications, but it raises some implementation issues for tools that were originally designed for batch processing. There are two paradigms for processing interactive input in an environment like the one Eli provides. Using the first paradigm, each debugging query is viewed as a separable input source that is processed apart from other queries. Using the second paradigm, all of the queries are treated as coming from a single input source. The two approaches have different
34 storage requirements and differ in the way in which computations associated with previous queries can influence processing for future queries. For most tasks, the first approach is preferable, because it has a smaller storage requirement and the behavior can more easily be encapsulated in a module. I have encapsulated this paradigm in a module that can easily be instantiated by the author of a new debugger. If each query is treated as a separate input, the parser and tree evaluator are called in a loop instead of only once. The end of a command is treated as an end-of-file marker in the input. The loop ends after the user has entered a command that sets a condition that causes the loop to terminate. Repeatedly invoking compiler components, such as the parser and tree evaluator, for each query means that these components must be reentrant. It also means that it must be possible to clean up allocated storage to avoid memory leaks. These properties cannot be assumed, since compiler generation systems may have been designed with the assumption that the input comes from a single source. One of the pieces of storage that would be freed after each iteration would be the abstract syntax tree representing the query. It is, however, sometimes desirable for information from one query to be visible in a future query. Using this approach, such information must be stored in a place other than the abstract syntax tree. Possibilities include storing values in the definition table or simply in global variables. In the second paradigm, the compiler tools are only called once to process all of the user’s queries. The syntax of the query language must represent a sequence of queries rather than a single query as in the previous approach. In this case, special notation is required to ensure that computations for one query are completed before any attempt is made to read input for the next. Otherwise, the result of a query would not be printed before prompting the user for the next input. In Eli, the keyword BOTTOMUP is used to mark attribute grammar computations that must be performed before the next input is read. Marking computations with the BOTTOMUP designation forces the system to perform computations based on partial trees. This approach has a much larger storage requirement than the first, since all the queries for an entire interactive session are constructed and kept in memory. At the same time, this makes it easier for computations in previous queries to influence processing in future queries without always having to use the definition table or global variables. (Values can be transmitted through attributes in the attribute grammar instead.) This approach cannot as easily be encapsulated in a module, since the user must introduce the BOTTOMUP annotations in their own computations. 3.3
User Input Issues When using interactive processors such as debuggers, users have become accustomed to special features that make typing commands easier. This section describes how some of those features can be implemented within the framework described in this thesis. One such feature that appears in many debuggers is the ability to uniquely abbreviate commands. For example, the letter s might be a unique abbreviation for the step command which traces execution of the program. To implement this feature the command keywords can be recognized simply as identifiers by the scanner’s finite state machine instead of being directly encoded by the finite state machine. A token processor1 can look up the 1 Token
processors are used in Eli to perform the scanning conversion task, i.e., converting tokens to values
35 identifier in a table of command keywords to determine which one to return to the parser. Implementing this also requires that the token processor knows when one is expected so that identifiers in other contexts are not treated as abbreviations for command keywords. Since request languages are typically structured in such a way that command keywords always appear at the beginning of a query, it is easy to set a flag before the query is read to indicate that a command keyword is expected. Another common feature in interactive processors is the ability to have queries span multiple lines. In recognition of a partially typed command, the processor echoes a different prompt until the command is complete. Initially the assumption is made that each query is contained on a single line and end-of-file markers are inserted in the input stream at line breaks to signal what appears to be the end of a query. During the parse, this endof-file marker is reached before the end of a complete parse. Eli provides a mechanism that allows a user to override the standard error recovery mechanism in the parser. An interactive processor can use this mechanism to force the parsing of the query to resume after new input has been read and the last token has been altered to be the first token of the new input. 3.4
Related Work Using compiler generation tools such as Lex and Yacc [44] when implementing interactive processors is not a new idea. Existing debuggers such as gdb [51] use Yacc to parse C expressions. These existing interactive processors typically use compiler generation tools more selectively to avoid dealing with some of the user input issues discussed in the last two sections. While better solutions may be achieved by using the tools in more limited circumstances, it results in more of the input processing having to be hand-coded. Techniques for generating interpreters using attribute grammars is discussed in [39]. An alternative to interpreting debugging requests is to dynamically generate code in the same way the translator does and then to execute the generated code. VCODE [19] is an example of a system for dynamic code generation and [42] describes how to execute generated code. Unfortunately, the interfaces for using such systems differ enough from the way code is generated by the translator that no significant leverage is achieved by following this approach. The descriptions in this chapter have focused on a scenario in which the debugging request language is modeled closely after the source language. In this way, existing translator specifications can be most fully utilized in specifying a debugger. Duel [24], Dalek [48], and ACID [66] are examples of debuggers in which the debugging language has been extended with constructs aimed at providing greater expressibility for debugging but do not have direct analogs in the source language. The framework described by this thesis does not preclude the introduction of such constructs into the debugging language. In fact, the use of specification languages to specify a debugger as is done in this thesis may make it easier to experiment with such new debugging constructs. The cost of implementing such extended constructs is however greater than the cost of implementing source language constructs for which translator specifications already exist.
in some internal form and possibly changing their classification.
CHAPTER 4 PROVIDING DEBUGGING FUNCTIONALITY This chapter will focus on the information and primitives required to implement debugging commands, also called the run-time library, which includes facilities for probing the current state of a program as well as controlling its execution. Code to provide these facilities in existing debuggers is nontrivial. An important goal for the framework described here is to avoid implementation methods which incur a high cost to the author of a new debugger. Consequently, writing code from scratch to provide these facilities is not a viable option. Because significant effort has been invested in providing debugging functionality in existing debuggers, the goal of the framework described here is to leverage this functionality in constructing a new debugger. At a high level, we can view a new debugger written using this framework as a wrapper around an existing debugger. The wrapper is responsible for converting source language concepts into concepts understood by the underlying debugger being leveraged. One possibility for leveraging an existing debugger would be to take its source code and try to integrate large portions of it into the new debugger. This approach has significant weaknesses. It requires that one have source code for an existing debugger, which is clearly a very limiting assumption. Not only is source code unavailable for most debuggers, but significant effort would be required in understanding the code of such a large piece of software in order to use it effectively. A better solution is for the new debugger to interface with the existing debugger as any user would. Assuming that the existing debugger has a line-mode interface, we can use a tool like Expect [45] to manage this interface. Expect is a tool that uses the Tcl scripting language [49] to allow programmed dialogue with interactive programs such as a line-mode debugger. Section 4.1 describes in greater detail how Expect can be used to control an existing debugger. This solution is much more flexible. It does not require having source code for an existing debugger and moreover, it makes it easy to use any existing debugger with a line-mode interface. The ability to use any existing debugger has important implications for debugging translations whose target language is another high-level language as opposed to assembly or object code. If a debugger already exists for the target language, the construction of a debugger for the source language involves mapping between concepts of the source and target language instead of additionally being concerned with the mapping between the target language and the machine-level code that is ultimately executed. For example, a translator that translates to C will benefit most from using a debugger that is capable of debugging C source code. In this way, the new debugger (or wrapper) need only be concerned with the mapping from the source language to C rather than also being concerned with the mapping from C to object code that is the result of a separate
37 translation step. Similarly, a translator that translates to assembly code (as opposed to translating directly to object code) benefits from using a debugger that is capable of debugging assembly code. Section 4.2 describes how to implement some of the most important parts of a debugger with this approach. Using an existing debugger does require the ability to interpret its results. When the query processor requires a piece of information about the running program, it issues a request to the run-time library. The run-time library is responsible for translating this request into a command that can be processed by the existing debugger. Expect is used to send the command to the debugger and return the results. The results are typically identified by reading the output stream up to the next prompt. Because Expect uses the Tcl scripting language, it is possible to use regular expressions provided by Tcl to recognize elements of the result strings. For most debugging requests, this is likely to prove adequate. However, in some instances regular expressions are not sufficient. For example, the result of printing the value of an array or structure object (in which nested structure and array objects may exist) is difficult to process using only regular expressions. To solve this problem, the notion of backend query processing is introduced. Backend query processing is the ability to instantiate the available compiler construction tools for use in processing the text produced by an existing debugger. It is described in greater detail in Section 4.3. 4.1
Using Expect Using Expect to control the execution of a debugger is for the most part a straightforward application of Expect. Expect provides facilities for sending input to the debugger and for capturing its output based on the presence of strings matching specified regular expressions. While the interface to Expect is usually through an Expect command interpreter1 , Expect also provides an object code library that can be linked with an application. Since the generated query processing code is not written in Tcl, we must opt for the latter approach.2 The interface between the query processing engine and the run-time library is intentionally left somewhat nebulous. How the interface is constructed depends very much on what functionality can easily be provided directly by the existing debugger and what must be provided by hand by the author of the new debugger. As will be seen later in this chapter, it is possible that the use of an existing debugger can be adapted to appropriately handle things like breakpoints and mapping to source level coordinates for the new source language without the new debugger requiring specialized code and data structures. In such cases, we say that the debugging model provided by the existing debugger is close to the debugging model desired in our new debugger. When the two debugging models are closer to each other, more debugging functionality can be pushed into the run-time library and less needs to be coded by hand. In cases where debugging requests can be executed directly by the existing debugger, the query processing code only needs to formulate the query and pass it via Expect to the
1 The Expect command interpreter is actually just a superset of Tcl augmented to provide Expect functionality. 2 It may be possible to generate a suitable Tcl interface to the generated query processing code using a tool such as SWIG [8].
38 existing debugger. Expect then allows the author of the debugger to capture the output from the existing debugger and either print it out directly or transform it before printing it out. If the transformation requires information from the information store, access to this information must be wrapped in an interface that can be installed as a Tcl command. Where large amounts of information are required from the information store or the recognition of lexical elements from the existing debugger’s output is sufficiently difficult, the author of the debugger may resort to using backend query processing as described in Section 4.3. Other debugging requests require a much more fine grained interface to the runtime library, i.e., they need piecemeal access to the state of the running program. This is particularly the case when evaluating source language expressions, for which the values of several variables must be fetched independently from the run-time library. The query processing code is then responsible for combining these results according to the rules of the source language. In these cases, individual queries are formulated for the existing debugger, the output is captured, and the relevant information is extracted and returned to the query processing code. The following list shows an example of a sequence of events that could be used to execute a request to print the value of a simple integer variable a that resides in the current stack frame: (1) The query processor issues a request to the run-time library to get the value of the current stack pointer. (2) The run-time library issues the command print $sp to the existing debugger and captures the result $sp = 1024. (3) The value 1024 is extracted from the existing debugger’s output and returned to the query processor. (4) The query processor issues a request to the information store to retrieve the definition table key representing the variable a in the current scope. (5) The query processor issues a request for the Offset property of the definition table key returned in the last step. The offset returned is 24. (6) The offset is added to the value of the stack pointer returned in step 3 to yield the address 1048. (7) The query processor issues a request to the run-time library to get the integer value residing at address 1048. (8) The run-time library issues the command x/dw 1048 to the existing debugger and captures the result 1048: 5. (9) The value 5 is extracted and returned to the query processor. (10) The query processor prints the string a = 5. In the above example, the results returned by the existing debugger follow a welldefined format that can easily be captured by Expect. When the debugger allows the program to run, however, the running program may issue arbitrary output. At the same time, one must give the user the ability to interact with the program when it is running. To interact with the running program, Expect provides the interact command. The interact command allows one to supply regular expressions for strings whose appearance should prompt special behavior by Expect including revoking the user’s interactive control. The difficulty in using this command is knowing when to transfer control back
39 to the debugger. Expect is only privy to the same visual cues that a user of the existing debugger would be. In the case of most debuggers, a prompt constitutes the visual cue. It is impossible, however, to tell whether the prompt string was issued by the debugger or if the string appears as a result of the user’s interaction with the program. Another complication is that the interact command must buffer output that matches a prefix of the patterns it is attempting to match. For example, if the interact command is looking for the string “(debug) ” in the output stream and the user types (or the program generates) the string “(deer) ”, the first three letters would not appear until the second e was discovered after which buffering would no longer be required. Unfortunately, there are no foolproof solutions to this problem. The basic strategy must be to look for sufficiently obscure strings so that the buffered behavior will not occur and it is possible to recognize when to revoke interactive control. Some debuggers provide features that can simplify this task. For example, gdb allows users to set the prompt string and the definition of a hook to be executed each time the program is stopped. This hook can be used to echo an obscure string that can be recognized by the interact command. It may also be desirable to document a keyboard escape for the character that appears first in the string that the interact command is looking for. For example, if the gdb hook is defined to echo the string “˜dbg” for interact to recognize, a keyboard escape can be defined such that typing the tilde twice will result in the tilde actually being sent to the running program. 4.2
Specific Debugging Functionality While it is beyond the scope of this thesis to provide an encyclopedic treatment of debugging functionality, this section will focus on two major elements of debugging that require special consideration given the framework described here. The first is the mapping of coordinates between the source program and the executable program. The next section discusses how source coordinates are mapped into data structures that allow appropriate scoping of identifiers. The last section talks about managing the run-time flow of control using breakpoints. 4.2.1 Mapping Between Source and Target Coordinates One of the most important tasks for any debugger is to map between source text coordinates in the input program and corresponding coordinates in the target language. Coordinates in a source program are typically referred to by a pair consisting of a line and column number. Furthermore, pairs of coordinates can be used to specify a range in the input text. Such ranges are useful for specifying the extent of a scope. Where the target language is another high-level language, the same characterization can be made for coordinates and ranges. In the case of lower-level languages, such as assembly code, it may only be useful to speak in terms of lines, since each line can represent only a single instruction and column numbers are uninteresting. In the case of object code, the notion of a coordinate is most easily expressed by an address which represents an offset in the number of bytes from the beginning of the object code. Coordinate information is the primary means a debugger uses to map back and forth between source and target coordinates. When the user of a debugger asks to set a breakpoint on a particular source line, for instance, the debugger must be able to determine the set of target language coordinates that correspond to that line. When the program being
40 debugged has stopped, the debugger must be able to determine the source coordinates that correspond to the target coordinates where the program was halted. Organizing efficient data structures (in both time and space) to perform these mappings is nontrivial, particularly because the mapping must be bidirectional. The nature of the source and target languages and the granularity at which debugging will be supported often allow simplifying assumptions to be made in the formulation of these data structures. Granularity of debugging refers to the conceptual units of the source language at which the debugger will allow breakpoints and execution to be traced. An example of a simplifying assumption might be the guarantee that each source language unit can be characterized by a single entry point in a sequence of target language instructions. Even the most basic code optimizations, such as common subexpression elimination, can complicate these data structures tremendously. Because specialized mappings are specific to particular translations and it is difficult to envision a generic framework for specifying these mappings that allows for reasonable performance characteristics, there is little in the way of support a framework can provide in this respect. However, there is a simple solution that can be used when the mapping is not unique to the translation. Because the concept of a unit of source execution (a source line in many debuggers) is not unique to a particular language, it may be possible to leverage the source to target mapping facilities already provided by the existing debugger. Using the existing debugger to perform coordinate mapping requires that some information about the source execution units must be generated by the translator in a format usable by the existing debugger. For example, when translating from a high-level source language to assembly language, the translator may insert appropriate line number directives that are used by the assembler to generate a line number table that is ultimately embedded in the object code. When translating to a language like C, it is possible to generate preprocessor directives that refer target coordinates to their source counterparts. Because C debuggers recognize these directives, the coordinate mapping is provided automatically. Modifying a translator to generate suitable information is not typically very difficult, particularly if a target tree is generated as an intermediate representation of the output. A straight-forward means for doing this is to identify the contexts in the source abstract syntax tree that represent source execution units and to generate dummy contexts in the target tree. These dummy contexts represent points during processing of the target tree where additional coordinate information must be emitted. 4.2.2 Mapping Source Coordinates to Scopes Not only is it necessary to be able to map back and forth between particular coordinates in the source and target, a debugger must also be able to map from source language coordinates to the data structures that hold information about the scopes and identifier definitions for a particular location in the input. The latter mapping is required so that references to identifiers made in debugging queries are evaluated in the appropriate scope. In the sequence of events in the printing of variable a shown in Section 4.1, step 4 made mention of the current scope. In most debuggers, the notion of the current scope is determined primarily by the current point of execution in the program being debugged. Many debuggers provide commands to change the current scope while the program is suspended,
41 but the current scope is reset after the next resumption of the program. The most common commands that allow modification of the current scope are those that allow traversal up and down the dynamic call chain (e.g., gdb provides the commands up and down). Eli uses an abstract data type called the environment module (described by Kastens and Waite [40]) to hold scoping information from the translation of a particular input. The primary task in name analysis is to populate the environment module with scopes and the identifiers in those scopes. Using this information, name analysis can assign unique keys for each identifier that represents a particular source language object and verify certain semantic properties of those identifiers. In addition to the environment module, Eli provides a number of library modules that, when instantiated, implement the most common variants of name analysis. When using these modules, users need only inherit computations from the module onto symbols in their own abstract syntax tree [41]. For example, the name analysis modules export named sets of computations for the roles of identifier definitions, identifier uses, and scoping ranges. The user is insulated from the details of the computations that interact with the environment module. When debugging, we want to be able to correlate a suspended execution point with a particular scope stored in the environment module. This requires that the environment module be made persistent using the techniques described in Chapter 2. In addition, since the environment module does not ordinarily need to explicitly store coordinate information3 , this information must be added for use by the debugger. Allowing the coordinate information to be stored is accomplished by adding a parameter to the routines of the environment module that define new scopes. Providing coordinate information for scopes is further simplified if the standard name analysis modules in Eli are used, because the modules themselves can be altered to automatically provide coordinate information based on the abstract syntax tree node representing each scope. As a result, the coordinate information for scopes can usually be stored without any intervention by the author of the translator. Intervention is required only when the coordinates corresponding to an abstract syntax tree node do not correctly reflect the coordinate range for the scope that is stored at that node, which is rarely the case. 4.2.3 Trace Execution and Breakpoints Handling the run-time flow of control of a program can be very tricky and relies very much on the coordinate mapping discussed in Section 4.2.1. As indicated before, coordinate information is used to delineate source execution units in the target language. The boundaries between source execution units in the target output represent the points at which the debugger allows breakpoints to be set and the points where execution stops when tracing execution. If coordinate mapping can be performed by the existing debugger as described in the last section, the existing debugger’s handling of breakpoints can most likely be leveraged as well. Letting the existing debugger provide this functionality simplifies development of a new debugger tremendously, but this solution may not provide the flexibility desired by the author of the debugger. For example, many existing debuggers only allow breakpoints and trace execution to happen on source line boundaries. In most languages, source lines are not necessarily meaningful semantic units since several statements can be placed on a single 3 During translation, this information is known implicitly from the abstract syntax tree node that holds an attribute for a particular scope.
42 source line. The doctoral thesis of Fabio da Silva [15] advocates building debuggers that conform to the semantics of the source language, such that a direct formal correspondence can be made between the semantics of the source language and execution under a debugger. While this approach may be useful in some instances, it proves to be less practical in other cases. Programmers have a tendency to group statements on a single textual line only when the statements form some meaningful source execution unit. Having the debugger treat them as a single statement saves the debugger user from having to single step through each of the individual statements. Small loops are a prime example of this. Debugging using only information about the semantics of the language would lead a debugger to execute a loop one iteration at a time. If the entire loop is written on a single line in the source code, it is much more likely that the user would like to trace over the execution of the entire loop instead. If an existing debugger does not provide the desired coordinate mapping facilities, breakpoint semantics, or execution tracing semantics, a great deal more work is required by the author of the new debugger to implement breakpoints. It becomes necessary for the new debugger (or debugging shell) to manage breakpoints itself. How this is done is dependent on the language being debugged as well as the desired execution semantics. It is beyond the scope of this thesis to attempt to provide support for such a wide variety of scenarios. The remainder of this section discusses some of the issues that must be addressed, however, if more specialized breakpoint semantics are desired. Any given source execution unit may have several target statements that represent entry points to the sequence of target code implementing that statement. As such, any mechanism for implementing breakpoints must set internal breakpoints at each of these entry points in order to correctly implement a breakpoint for a given source execution unit. If a target statement is associated with more than one source execution unit, some method for disambiguation is required when an internal target breakpoint is triggered so that it can correctly be referred to a source execution unit (or skipped if that particular source execution unit doesn’t have a breakpoint associated with it). Implementing execution tracing semantics can prove to be much more difficult. Debuggers typically implement two kinds of tracing semantics: a “step over” and a “step into”. Step over means that subroutines are treated as a single operation, while step into means that debugging trace execution will follow subroutine calls when they are executed. In general, there are two possible strategies for implementing trace execution in a debugger. The first strategy requires that the underlying support layer (the hardware or an existing debugger in this framework) allow for individual target instructions to be executed. The strategy for trace execution is then to iteratively execute individual instructions until the current instruction is out of the range of the current source execution unit. This approach works well for the “step into” case, but when we want to step over subroutine calls, additional handling must be performed since the instructions executed in the subroutine call will be out of range of the source execution unit being traced over. Handling “step into” using this strategy requires knowing when a subroutine call takes place. The debugger may attempt to interpret each instruction before it is executed to determine whether it is a subroutine call, in which case it can set an internal breakpoint at the statement following the call and
43 then resume execution. The debugger may also wait until a target statement that is out of range of the source execution unit is the current instruction and determine whether the last instruction executed was a subroutine call. In this case, the return address can be fetched and an internal breakpoint set at that instruction before resuming execution. The second strategy for implementing trace execution requires knowing at every execution point what set of possible source execution units may follow. Having this information allows the debugger to set breakpoints at each of the potential followers, resume execution until one of those breakpoints is reached, and then unset the temporarily placed breakpoints. While one could imagine that information about the set of source statement followers could be computed at compile-time, in practice this is not done because of the large storage requirement such data structures would have. Instead, this information is computed by the debugger. 4.3
Backend Query Processing Backend query processing addresses the problem that the scripting language support provided by a language like Tcl, which is used by Expect, may not be sufficiently powerful to parse information produced by an existing debugger. This section will outline a solution that provides the text-processing power of the compiler construction toolset to the processing of such results. Chapter 6 will illustrate the solution as part of the case study. In addition to the regular expressions that Tcl is capable of using to express understanding of the output format, a compiler construction toolset such as Eli provides the possibility of using context-free grammars and semantic analyzers to capture the information from the existing debugger. The challenge in using the compiler construction toolset is in finding an effective way to integrate this new use of the toolset with the existing usage for processing the debugger’s query language into a single program. Most compiler construction tools currently available, including the current version of Eli, do not provide support for multiple instances of text processing components linked together in the same program. As an example, the code generated for two different parsers generated from different specifications typically cannot coexist in the same program. The difficulty in allowing multiple instances of generated text processing components has to do with naming. Generated C code typically provides a set of globally visible names that do not vary from one instance of a generated component to another. Those globally visible symbols provide the interface to the generated component. If multiple instances of code generated from the same tool are included in the same program, naming clashes arise. Whatever solution is provided to this problem requires that some kind of scoping be applied to the generated names such that names generated for one instance of a component do not conflict with the generated names from another instance. Unfortunately, C does not provide very sophisticated scoping features. The best that can be done with C at the language level is to restrict the scope of identifiers to a single file (by declaring global variables static), which is clearly far too restrictive. Without language scoping features, one must resort to other possibilities, each of which have their disadvantages. For example, it is possible to modify the code generators to consistently place a prefix on global symbols. If different prefixes are placed on globally visible names generated
44 for different instances of a text processing component, naming clashes are avoided. This solution comes at a steep price, however, since pervasive changes may be required to the generator to implement this solution. Another strategy is to use a feature-rich linker to hide symbols that are not required and to rename symbols which are required, but would cause a name clash. This solution requires users to exercise greater control over which symbols are to be made visible from any particular instance of a text-processing component and to appropriately rename symbols which will cause name clashes. In addition to this encumbrance placed on the user, the implementation of this approach is not very portable. Many standard linkers do not provide the support needed to implement this solution. While the GNU linker [21] does provide the needed support, it only supports a restricted set of platforms. In addition, issues of name mangling can cause problems. Depending on the platform and compiler, the names generated in the object code may or may not be prefaced by an underscore. The solution implemented as part of this thesis was one in which the generated C code, which was already capable of being compiled by a C++ compiler, was modified to utilize the object-oriented scoping features provided by the C++ extensions to C. Using these language features avoids many of the problems cited for the solutions described above. The changes required for this approach are not nearly as pervasive as are required by the first solution, because individual instances of the text processing components are simply encapsulated in the scopes of separate classes. Consequently, function definitions must be changed to reflect the classes they belong to, but individual member references need not change. Many compiler generation tools rely on a fixed piece of code that utilizes generated code. This fixed component is also referred to as the frame or driver code. The simplest object-oriented adaptation results in substantial duplication of the frame code for each instance. With this approach, a new class is created for each instance. To avoid the duplication, the frame code must be altered more significantly to make virtual function references to all of the generated pieces. I have made the necessary modifications to Eli to allow for multiple instances of the scanner and parser components. This approach is not needed, however, for the semantic analysis (attribute grammar) component. To understand why, it is necessary to understand in what context the results of these other instances of text-processing components will be used. The goal is to process the results of queries given to an underlying debugger. These results are used to satisfy a request given in the query language. Given this usage pattern, it is easiest to graft the abstract syntax tree created by the backend query processing components into the abstract syntax tree for the original query. In this way, the processing of the grafted tree has access to information computed from the original query. The discussion thus far has focused on how support is provided for each of the potential text-processing components included in the final program. What is just as important are the issues involved in integrating these pieces into a single program. In Eli, the description of a text processing problem is characterized by a listing of specification files or derived components that characterizes the various parts of the solution.
45 What a user needs to express to integrate backend query processing is that a separate set of specifications must be instantiated and its external interface made available to the original specification. This is accomplished by providing a new derivation that allows a set of specifications to be instantiated as a module to the original. Appropriately, the name the framework gives to this derivation is “:module”. In addition, it must be possible to name the instantiated module for use by the original, which is accomplished by supplying a “+modname” parameter to the derivation. As an example, such a derivation might look as follows: bequery.specs +modname=bequery :module This derivation says that the specification components listed in bequery.specs should be instantiated as a module with the name bequery. This derivation would be included in a specification file that specifies the complete debugger. The module name is used as a prefix applied to the names of the classes constructed in the instantiation of the various text processing components. The interface supplied by the module can then be utilized by the original debugger query processing component to process the results of queries from an existing debugger. 4.4
Related Work While there is a large number of debuggers in existence, there is not a tremendous amount of literature available that discusses how to provide standard debugging functionality. Vern Paxson provides a good survey of debugging techniques in [50], Mark Linton describes issues in the development of the commercial Dbx debugger in [46], and a document exists that describes the internals of the GNU debugger, gdb [51]. Dynascope is a research project that undertook to provide a suite of debugging functionality with an architecture independent interface in the form of an object code library [58]. The difficulty in using such a library for the purposes described in this thesis is that it provides a fixed set of functionality that cannot easily be extended. The support provided by the interface is sufficiently low-level that extending it to provide even basic debugging functionality would prove to be non-trivial. One is also limited to the set of platforms supported by the library. The approach taken in my framework bears some resemblance to the way debuggers like DEET [28] and DDD [68] are constructed. The goal for these debuggers is to provide a unique user interface to existing debuggers. DEET calls the code that wraps around an existing debugger, such as gdb, a “debug nub”. A similar characterization could be used for the way in which Expect is used to wrap around an existing debugger in the framework described here. As indicated earlier in this chapter, data structures for mapping source and target representations of a program are complicated significantly by optimizations performed by a compiler. A paper by Brooks et al., of Convex Computer Corporation [12] details their experience in developing a debugger for optimized code that relies heavily on developing a specialized set of data structures to present an appropriate view of the running program to users. DOC, described by Coutant et al. [14] is another example of a compiler and debugger
46 that have been instrumented to produce and use new data structures for the purpose of debugging optimized code.
CHAPTER 5 COMPILER ADAPTATIONS FOR DEBUGGING This chapter and the next will discuss the application of the framework in the context of two examples. Providing debugging functionality requires cooperation between the compiler and debugger. The compiler must supply sufficient information about the translation process so that the debugger can present a source-level view of the program during a debugging session. This chapter will focus on the adaptations that must be made to a compiler specification to generate the necessary information. The next chapter will demonstrate how the debugger is constructed and how it utilizes the information provided by the compiler. The two examples both translate the same language, but translate to different target code. The language is a subset of Pascal defined by Per Brinch Hansen [11] that I will refer to as Pascal–. One of the translations targets is an abstract stack-oriented machine defined by Brinch Hansen. A complete Eli specification for this translation can be found in [62]. The second translation targets assembly code for a Digital Alpha processor running the DEC OSF/1 operating system [17]. I wrote the Eli specification for this translation based on the specifications for the first translation. Compiler construction systems are used for a wide variety of translations and these two translations are representative of the significant differences in the kinds of generated target code. One represents a high-level translation in which the target code is for an abstract machine while the other translation is low-level in that it is only an assembler step away from machine executable code. Yet it is easy to develop debuggers for both translations using the framework described in this thesis. Not only that, but the process and specifications for constructing the two debuggers are remarkably similar. One feature of both debuggers that makes them so similar is that it is possible for both translations to use the GNU debugger (gdb) to provide the underlying debugging functionality. In the case of the abstract machine, the instructions of the abstract machine can be defined by C preprocessor macros. Programs generated for the abstract machine can be compiled by a normal C compiler given these macro definitions. Because gdb is capable of debugging both C and assembly language programs, gdb can be used as the underlying debugger for both new debuggers. The remainder of this chapter will discuss the two major categories of modifications required to the translators. The first category involves the body of information that must be communicated from the translator to the new debugger, which uses the techniques developed in Chapter 2. The second category of modifications has to do with generating specialized directives into the target code for use by the underlying debugger (gdb). These directives allow gdb to make the correspondence between line numbers in the target code and the original source line numbers.
48 5.1
Persistent Information The translator already computes most of the information required by the debugger. The goal of the framework is simply to make this information easily accessible with minimal changes to the translator. One great advantage to the framework is that the author of a debugger can work in a demand-driven mode. When in the course of implementing the debugger it is discovered that another piece of information is required, a simple change can be made to the translator to export that information. The framework obviates the necessity for designing complex data formats a priori by which to transmit information from the translator to the debugger. Figure 5.1 shows the complete contents of the only specification file, named persist.fw, that was added to the abstract machine translator. A similar file exists for the assembly code translator. The primary difference between the versions for the two translations is the list of definition table properties that are to be made persistent. The reason for the difference is that the translators compute some properties that are specific to a particular translation. The file persist.fw contains a variety of different Eli specification types. They can all be placed in the same file by using the FunnelWeb literate programming tool [65] that can generate any number of files from a single file. The @O directive indicates the generation of a new file whose contents are delimited by @{ and @}. The remainder of this section will discuss the individual components of this specification file as well as a few minor changes made to the original specification files. One important aspect of all of the functional changes is that they are easily separable from the original specification. Their inclusion is conditional on the definition of the C preprocessor macro PERSIST. For example, Figure 5.2 shows the file provided to Eli that contains the list of specifications for the translator. Note that the inclusion of persist.fw depends on the definition of the PERSIST macro. Changes made in other parts of the specification can similarly be made conditional on the same macro. The modifications I have made to Eli define the PERSIST macro in all of the Eli specification languages when the +persist parameter is provided to the derivation of the translator. While any module can be made persistent using the techniques described in Chapter 2, there are three modules in Eli that suffice for most purposes. These are the string table, identifier table, and the environment module. I have created an Eli module named Save.fw that takes care of the mechanics of saving these three components. It is instantiated at the very beginning of the specification shown in Figure 5.1. The string and identifier tables have globally visible names and can be made persistent without any additional specification from the user. The environment data structure is created by the user during the course of tree computations. To make it persistent (and the transitive closure of objects it refers to), the module’s interface exports a computational role called SaveEnvironment for use in an attribute grammar. Computational roles are used by inheriting them to symbols in the abstract syntax as described by Kastens and Waite [41]. This particular computational role requires the user to provide the computation of an attribute called SaveEnv that represents the environment data structure to be saved. The computation of this attribute and the inheritance of the SaveEnvironment computational role can be found at the beginning of the specification
49
@O@==@{ $/sos/Save.fw @} @O@==@{ Displ, Level, Kind, LowerBound, UpperBound, Value, Label:: int; ElementType, IndexType, Type:: DefTableKey; Env, Scope:: Environment; "envmod.h" Space:: StorageRequired; Str:: CsmIndex; "csm.h" "csm_ps.h" Pos:: CoordPtr; "err.h" @} @O@==@{ #include "persist.h" @} @O@==@{ #ifndef PERSIST_H #define PERSIST_H #include "csm.h" extern char *SaveFile(void); #endif @} @O@==@{ #include "code.h" #include "clp.h" char * SaveFile(void) { return GenOutputName(GetClpValue(InputFile, 0), ".db"); } @} @O@==@{ ATTR GotPersist: VOID; SYMBOL StandardBlock INHERITS SaveEnvironment COMPUTE SYNT.GotPersist = ORDER(TAIL.Storage, TAIL.Objects, THIS.GotScopeProp); SYNT.SaveEnv = THIS.Env DEPENDS_ON THIS.GotPersist; END; SYMBOL ProgramName INHERITS NameOccurrence END; RULE: Program ::= ’program’ ProgramName ’;’ BlockBody ’.’ COMPUTE Program.Key = DefineIdn(INCLUDING StandardBlock.Env, ProgramName.Sym); Program.GotPersist = ORDER(ResetLevel(Program.Key, 1), ResetEnv(Program.Key, Program.Env), ResetPos(Program.Key, COORDREF), ResetStr(Program.Key, ProgramName.Sym), EnvSetKey(Program.Env, Program.Key)); END; RULE: ProcedureDefinition ::= ’procedure’ ProcedureNameDef ProcedureBlock ’;’ COMPUTE ProcedureDefinition.GotPersist = ORDER( ResetPos(ProcedureNameDef.Key, COORDREF), ResetStr(ProcedureNameDef.Key, ProcedureNameDef.Sym), ResetEnv(ProcedureNameDef.Key, ProcedureBlock.Env), EnvSetKey(ProcedureBlock.Env, ProcedureNameDef.Key)); END; @}
Figure 5.1: Specifications for Making Debug Information Persistent
50
/* Specifications for the Pascal- compiler */ Structure.fw keyword.gla :kwd Scope.fw Type.fw Computer.fw Code.fw
/* /* /* /* /* /* /*
Lexical and Syntax Analysis */ Exclude keywords from the */ finite-state machine */ Scope Analysis */ Type Analysis */ A Pascal Computer */ Code Generation */
#ifdef PERSIST persist.fw #endif Figure 5.2: List of Compiler Specification Files
51 fragment for the file persist.lido in Figure 5.1. Note that the computation of the SaveEnv attribute depends on an attribute called GotPersist. This attribute is used to ensure that the environment data structure has been populated with all of the necessary information. The Save.fw module also requires the user to provide a function called SaveFile. This function is used to determine the name of the file in which the persistent data is to be stored. The definition for this function given in Figure 5.1 generates a name formed by concatenating the extension .db to the name of the input file. The purpose of all three saved modules is to associate information with names. The string table stores the character representations of names, the identifier table provides a data structure that ensures the unique correspondence of names to string table entries, and the environment module allows for the scoping of names in different contexts. The environment module also maintains an association between each unique definition of a name and a definition table key. A transitive closure of data objects beginning with the environment module includes all of the definition table objects that can be referenced by a name in the source program. This corresponds to the set of objects to which the user of a debugging query language might want access. Through definition table keys, an arbitrary set of properties of arbitrary types can be stored for use by the debugger. As was indicated in Chapter 2, all that may be required to make a definition table property persistent is to add a declaration for the property with a double colon instead of a single colon in the PDL language. For property types that are not exported from Eli modules, some additional macros and functions must be provided by the user to ensure that the properties can be made persistent.1 Chapter 2 provides the details of this instrumentation. Figure 5.1 shows the added PDL specification that names properties that need to be made persistent. All but two of the properties (Pos and Env) are already computed by the translator. Information required by the debugger that is not computed as part of the translation process is often information that is represented implicitly in the structure of the abstract syntax tree. Because the same abstract syntax tree (the tree representing the source program) is not available during debugging, the information must be represented explicitly instead. For example, scopes in the environment module are typically attached to particular nodes in the abstract syntax tree. The abstract syntax tree context in which the node appears defines the function (and consequently the name) that the scope is associated with. During debugging, it must be possible to locate a particular scope based only on a name and/or the source text coordinates it encompasses. This required enhancement of the environment module to hold coordinate information for scopes as well as a possible definition table key. The coordinates allow the scope to be identified based on a particular source coordinate and the definition table key is used to provide arbitrary information associated with the scope, including a property for its name in the case of named subprograms. The interface to the environment module also had to change to allow for the new information to be provided. For example, the environment and scope creation operations now take a coordinate range as an additional argument. Fortunately, this change has little 1 I have not yet instrumented all of the Eli modules for persistence, however this can be done as they are needed and once done need not be done again.
52 impact on the typical user of the environment module, because Eli provides name analysis modules that are responsible for the environment and scope creation operations. I have modified the modules to automatically supply the coordinates for scope creation operations so that users of the modules do not have to make any changes themselves. To allow the association of a definition table key to a particular scope, I added the operations EnvSetKey and EnvGetKey. EnvSetKey is used in the translator to store a definition table key with a scope and EnvGetKey is used by the debugger to extract the key. Adding the call to EnvSetKey in the translator is usually a trivial matter, since definition table keys are usually associated with the names of procedures in the normal course of name analysis anyway. These calls can be seen in the attribute grammar computations shown towards the end of Figure 5.1. Storage of coordinate information and definition table keys with scopes allows the debugger to determine the environment associated with particular source coordinates. The coordinate information and definition table key are needed when execution of the program is stopped and the debugger needs to determine the current scope. The debugger must also be able to locate the coordinates and scope associated with a particular procedure name that is part of a debugging query. Name analysis determines the definition table key associated with the procedure name given in a query, but to determine the coordinate and scope information for that procedure, additional properties to relate that information with the key must be set and stored. The additional PDL properties, Pos and Env, serve this purpose. As can be seen in Figure 5.1, computing this property is trivial. One additional change that had to be made to the original specification involves the use of PDL’s statically initialized keys as described in Chapter 2. The original specification supplied a number of operational declarations (in C code) of definition table keys to represent entities predefined by Pascal– like the integer type. Using such operational declarations makes it more difficult to refer to these entities by the same names in the debugger. An easy way to have these objects named by the persistence mechanism and to ensure that they are resurrected under the same names in the debugger is to make them statically initialized keys using the PDL language. Use of a statically initialized key is no different than a key defined operationally so this change does not have any consequences to the remainder of the specification. 5.2
Generating Target Code Directives The last section discussed additions and changes that depend very little on which of the two translations is involved. This section talks about modifications that are very different for the two translations. These are modifications to include line number directives into the target code so that gdb can appropriately map from an executable context to the source line number involved. There are two primary differences between the translations that affect how these directives are generated. The first has to do with the fact that the translation to assembly code involves the generation of a target tree. The target tree is an intermediate representation that is very close to the target code. Typically, compiler tasks such as register allocation and instruction selection are performed on a target tree before the code is ultimately generated. The translation to the abstract machine does not involve such tasks, which makes it
53 Variable(0,3) Constant(16) Assign(1) Figure 5.3: Abstract Machine Instructions for A := 16 unnecessary to construct a target tree. The target code is emitted directly from the abstract tree representation of the source program. The second difference has to do with the kind of directive being emitted. In the case of the abstract machine, the directives are C preprocessor line directives that are inserted in front of each abstract machine instruction. When translating to Alpha assembly code, .line directives are inserted before each sequence of instructions that represent a source language statement. Both kinds of directives ultimately populate the line number table that is embedded in the object code that is run. From this line number table, gdb is able to map between machine instructions and source-level statements. The next two subsections will show how these directives can be inserted in each of the two cases. 5.2.1 Inserting C Preprocessor Line Directives The C preprocessor provides line directives so that code generators can insert them to relate lines of code in their target files to lines that appear in their source files. These directives are typically used in situations where blocks of code are copied verbatim from the code generator’s input to its output. They ensure that debuggers used on the compiled output will be able to trace back to the original input file at the right line number. Line directives are of the following form: #line lineno "filename" The directive says that the lines following the directive (up until another directive is seen) are actually lines from filename beginning at line number lineno. More precisely, the line following this directive can be found in filename at line number lineno, the second line following the directive can be found in filename at line number lineno plus one, and so on. In the case of the abstract machine translation, there is no code that is copied verbatim from the input to the output, but it is still possible to use the line directives to our advantage. Figure 5.3 shows a sequence of three abstract machine instructions that might be generated for the Pascal– assignment statement A := 16. Assuming that this assignment statement appears on line 46 of the file code.p, one might consider inserting the following line directive before the abstract machine instructions in Figure 5.3: #line 46 "code.p" The line directive has the effect of fooling the C compiler into thinking that the instruction Variable(0,3) actually is the assignment statement A := 16. The problem is that the C compiler will also assume that Constant(16) is actually line 47 of code.p and that Assign(1) is actually line 48 of code.p.
54 #line 46 "code.p" Variable(0,3) #line 46 "code.p" Constant(16) #line 46 "code.p" Assign(1) Figure 5.4: Abstract Machine Instructions with Line Directives for A := 16 To get around this problem, it is possible to insert the line directive before each of the abstract machine instructions that contributes to the assignment statement, which results in the code shown in Figure 5.4. Now that we have specified those directives that need to be generated, we need to address how to generate them. The first important criterion in choosing the implementation strategy is the ability to isolate the portion of the specification that actually emits the directive, so that the directives can be generated only when desired. For the abstract machine translation, this code is isolated in a function called LineMarker that takes an integer line number and prints out the appropriate directive. Figure 5.5 shows this function, which is designed to be called from Eli’s output generation component called PTG (for Pattern-Based Text Generator) [35]. The function’s first argument is of type PTG OUTPUT FILE, which is PTG’s representation of the output file descriptor. It uses other PTG-defined macros to print out a C preprocessor line directive. SRCFILE is a macro that represents the name of the input file. Where multiple input files may be involved, the filename must be passed in as an argument. The LineMarker function can then be used in PTG output patterns to indicate the insertion of a C preprocessor line directive. The call to this function is inserted everywhere directly before an abstract machine instruction is emitted. Figure 5.6 shows the PTG output pattern for assignment statements with the appropriate call to LineMarker inserted. PTG output patterns result in functions being exported that construct the output dictated by the pattern. The dollar symbols in the pattern represent arguments that are passed in. The arguments representing the variable address and the expression value are themselves sequences of instructions that are responsible for emitting the line directive. One void LineMarker (PTG_OUTPUT_FILE f, int l) { PTG_OUTPUT_STRING(f, "#line "); PTG_OUTPUT_INT(f, l); PTG_OUTPUT_STRING(f, " \""); PTG_OUTPUT_STRING(f, SRCFILE); PTG_OUTPUT_STRING(f, "\"\n"); } Figure 5.5: The LineMarker Function
55 AssignmentStatement: $2 /*Variable address*/ $3 /*Expression value*/ [ LineMarker $1 int ] "Assign(" $4 /*Length*/ ")\n" Figure 5.6: PTG Output Pattern for Assignment Statements of the arguments ($1) was added to the original pattern so that the appropriate line number could be passed in. Consequently, the calls to the PTG exported functions must be modified to include the line number parameter. For the Pascal– specification, these changes required methodical updates to approximately 20 call sites in the attribute grammar. 5.2.2 Inserting Assembly Code Line Directives Unlike the line directives from the last section, assembly code line directives do not need to be inserted before every machine instruction. Instead, we can insert them before each sequence of instructions representing a source language statement.2 For example, the directive: .loc 1 12 indicates that the next set of instructions (up until the next directive) should be mapped to line 12 of file 1, where separate file directives are used to map between numbers and the actual file names. Because the assembly language translation generates a target tree, the strategy for emitting the directives is different. The target tree is a fairly flat tree of nodes that represents sequences of assembly code statements. It is necessary to have some way of delimiting the instructions that belong to one source statement from the previous instructions. To accomplish this, a new kind of target tree node is introduced that represents a statement marker. These markers are constructed and inserted while the target tree is being built from the source tree. They are inserted at source-level statement boundaries. When the assembly code is emitted from the target tree representation, the target tree nodes representing statement markers cause assembly code line directives to be emitted. This solution clearly localizes the code that deals with emitting the directives, but also results in a minimum of overall changes to the specification. Figure 5.7 shows the target tree rule representing a statement marker with the computation that generates output for the line directive. 2 We could actually insert them before instructions representing source lines instead of statements, but it is simpler to work in terms of statements and it does not ultimately change the behavior.
RULE StmtMarker: xStmtMarker ::= COMPUTE xStmtMarker.out = PTGStmtMarker(LINE); END; Figure 5.7: Statement Marker Node in the Target Tree
56 The main changes are in the attribute grammar computations for constructing the target tree. A slight change is required to each attribute grammar context that represents a source-level statement. The number of source-level statement constructs is typically not very large and in the case of a simple language like Pascal–, there are only five tree contexts that are affected.
CHAPTER 6 THE CONSTRUCTION OF A DEBUGGER This chapter will continue discussion of the two example translations from the last chapter: translators from Pascal– to both Alpha assembly language and to an abstract stackbased machine. While the last chapter focused on modifications to the translators in support of debugging, this chapter will show how the debuggers can be constructed. Because the two debuggers are for the same high-level source language, many of the components of the two debuggers are very similar. Both debuggers support the same set of basic debugging functionality. The set of commands supported allow users to list the source program, set and clear breakpoints, trace and resume execution of the program, view the run-time stack, and print the values of source-level expressions. Table 6.1 gives a brief description of each of the supported commands. The remaining sections will show how information from the translator is restored, how the debugging query language can be implemented, and how the underlying debugging functionality is provided while processing debugging requests. While neither of the debuggers used as examples have sufficiently complex interactions with the existing debugger (gdb) to require the use of backend query processing, Section 6.4 will show its use in processing the stack command. 6.1
Restoring Saved Debugging Information Restoring information stored by the translator is a trivial process. Figure 6.1 shows the specifications file for the debugger. The first line of the specifications file exports appropriate selectors for the Property Definition Language from the translator as described in Section 2.2.1. The second line instantiates a module which resurrects data stored by the Save.fw module described in Section 5.1. Just as with the Save.fw module, the Restore.fw module requires a function called SaveFile that supplies the name of the file containing the persistent information. The translator stored this information in a file with the extension .db. The debugger makes the assumption that the name of the executable has the same base name as the source file with a possible .exe extension. This assumption leads to the implementation of SaveFile shown in Figure 6.2. The first argument to MakeNewExtension in this function extracts the name of the program supplied as argument to the debugger. 6.2
Processing the Query Language The first requirement for processing the query language is the ability to handle interactive input. The third entry in Figure 6.1 instantiates a query processing module that provides the necessary components. The module supplies slightly different implementations for a number of standard Eli components that allow for interactive behavior, which include
58
list [location]
break location clear number run continue next step stack print expression quit
Table 6.1: List of Debugging Commands List the source code from the program. location may be a single location given as a line number or procedure name, or a range of line numbers separated by a hyphen. If it is a single location, the source listing is centered around that location. Sets a breakpoint at the given location. location can either be a procedure name or a line number. Clears the breakpoint indicated by the numeric argument. (Breakpoints are assigned numbers when they are created.) Run the program from the beginning. Resume execution of the program from the point it was last suspended. Execute a single source line, skipping over procedure calls. Execute a single source line, tracing into procedure calls. Show the contents of the run-time stack. Print the value of a source expression. Exit from the debugger.
../pascal-/pascal-.specs +persist :export $/sos/Restore.fw ../query/query.specs debug.fw type.fw expr.fw idem.specs :idem $/Output/C_Separator.fw expect.fw Figure 6.1: Debugger Specifications File char *SaveFile (void) { return MakeNewExtension( StringTable(GetClpValue(ProgramName, 0)), ".exe", ".db"); } Figure 6.2: SaveFile Implementation
59 changes to the main driver function to execute the generated compiler components in a loop until a call to QuitProcessor has been made. Consequently, each debugging query is treated as a new input. The module also includes changes to the module responsible for getting input in order to prompt the user. The text of the prompt must be supplied in the global character string variable QueryPromptString, which must be provided by the user of the module. With the help of this module, it is possible to use the standard set of compiler generation tools with their accompanying specification languages to process the query language. Figure 6.3 shows the complete concrete syntax1 for both debuggers’ query languages. The notation used is BNF, where colons are used to delimit between the left and right sides of the rule, slashes separate alternatives, single quotes surround literal strings, and a period is used to terminate the rule. Many of the commands consist only of keywords, list and break have arguments to indicate source program locations, and clear takes a single numeric argument. By far the most complex command syntactically is the print command, which allows the evaluation of arbitrary source language expressions. Including the source language expression syntax was only a matter of copying the set of syntax rules rooted by the nonterminal Expression from the translator’s syntax description into the syntax for the debugger. The remainder of this section will divide the debugging commands into three categories. The first category includes commands that require location information. In the case of the example, this includes the break and list commands. A direct correspondence exists between these two commands and commands supplied by gdb, but procedure names given as part of the location arguments must be translated into the target code labels that represent them for use by gdb. The second category of commands also correspond to commands provided by gdb, but require little, if any, translation. The results of executing the gdb equivalents may require post-processing as will be described in the next section. The print command falls into the last category of debugging commands. In this case, gdb provides only very basic information that must be manipulated to determine the appropriate result. 6.2.1 Commands with Location Information Gdb knows about source line numbers because of line number information planted in the target code during translation. However, it does not know about the names of procedures in the source program, because these are translated into unique labels in the target code. In preparing the request for gdb, the query processor must translate the names of procedures into the labels that gdb does know about. This is a matter of looking up the procedure identifier in the restored environment module and extracting the property representing the label for that procedure. An attribute grammar fragment that does this is shown in Figure 6.4. Because procedures may be nested, users must refer to procedure names in a way that they can be resolved from the current context. The notation provided by the query language is a colon separated list of procedure names that should begin with a procedure name that is visible in the current scope and each subsequent procedure name must be visible from within the last one specified. The implementation in Figure 6.4 uses a chain 1 The concrete syntax describes the phrase structure of the input language and is used for parsing, while the abstract syntax describes a tree structure suitable for semantic computations and can be used in conjunction with an attribute grammar.
60 Query: ’list’ LocationRange / ’break’ Location / ’clear’ Numeral / ’run’ / ’continue’ / ’next’ / ’step’ / ’stack’ / ’print’ Expression / ’quit’ / . LocationRange: Location / LineNumber ’-’ LineNumber / . . Location: LineNumber / Procedure . LineNumber: Numeral . Procedure: Procedure ’:’ ProcedureNameUse / ProcedureNameUse . ProcedureNameUse: Name . Expression: SimpleExpression / SimpleExpression RelationalOperator SimpleExpression . RelationalOperator: ’’ / ’=’ . SimpleExpression: Term / SignOperator Term / SimpleExpression AddingOperator Term . Term: Factor / Term MultiplyingOperator Factor . Factor: Numeral / VariableAccess / ’(’ Expression ’)’ / NotOperator Factor . SignOperator: ’+’ / ’-’ . AddingOperator: ’+’ / ’-’ / ’or’ . MultiplyingOperator: ’*’ / ’div’ / ’mod’ / ’and’ . NotOperator: ’not’ . VariableAccess: VariableNameUse / VariableAccess ’[’ Expression ’]’ / VariableAccess ’.’ FieldNameUse . VariableNameUse: Name . FieldNameUse: Name .
Figure 6.3: Query Language Syntax RULE: Location ::= Procedure COMPUTE CHAINSTART Procedure.ProcChain = NoKey; Location.Key = Procedure.ProcChain; END; RULE: Procedure ::= Name COMPUTE Procedure.ProcChain = KeyInEnv(GetEnv(Procedure.ProcChain, CurrentEnv), Name); END; Figure 6.4: Looking Up a Procedure Name in the Environment
61 in the LIDO attribute grammar language [37]. A chain results in a depth-first left-to-right computation of the attributes named by the chain. In this particular set of chain computations, the chain holds the definition table key of the last procedure name resolved in the colon separated list. The value at the beginning of the chain is the key NoKey to represent the fact that we have not yet resolved any procedure names. The initial value of the chain is set by the CHAINSTART computation found in the first rule of Figure 6.4. When each procedure name is encountered along the chain, the name is looked up in the scope of the last procedure that was found. KeyInEnv is the operation that does this lookup. Its arguments are the scope in which to search and the representation of an identifier. It returns the definition table key representing that identifier in the given scope if such a binding exists. The definition table key for the last procedure looked up is the incoming value of the chain. To get the scope associated with that key, the GetEnv query operation is used. Note that for the first procedure name, the value of the incoming chain will be NoKey. When the GetEnv operation is applied to NoKey, it will return the default value (the second argument to GetEnv), which in this case is the current environment. This is consistent with wanting to start resolving names in the current environment. Ultimately, the goal is to have a definition table key representing the procedure denoted by the colon-separated list at the root of the subtree described by Figure 6.4. The tail of the chain holds this value, so it is assigned to the attribute Location.Key. The target code label can then be extracted from this definition table key and passed on to gdb. 6.2.2 Commands Requiring Little Translation A number of the debugging commands have direct equivalents supplied by gdb. All of the run-time control commands (run, continue, next, and step) fall into this category. While no translation is required for these commands before being passed to gdb, the results from gdb (when the program is again suspended) must be post-processed to use procedure names associated with the source program and to update the debugger’s notion of the current context for evaluating expressions. As is the case for many debuggers, the current context is updated each time the program is suspended to reflect the point in the program where execution last stopped. The stack command provided by the example debuggers corresponds to gdb’s where command that shows the contents of the run-time stack. The use of a different name for the debugging command underscores the flexibility the author of the debugger has in deciding on the details of the debugging language. As with the run-time control commands, the results of gdb’s where command need to be post-processed to translate target code label names to the appropriate source procedure names. The quit command also corresponds directly to gdb’s quit command that causes termination of the underlying debugger. In addition to terminating gdb, processing of the quit command must invoke the QuitProcessor function exported by the query module to cause termination of the loop in the main driver program and cause the debugger to exit. 6.2.3 Processing Source Language Expressions As is the case in a translator, a source language expression must undergo semantic analysis in the debugger, which includes both name and type analysis. Name analysis matches the names given in an expression with their definitions so that information such as the type of the identifier can
62 be determined. Type analysis ensures that the set of operations being performed in the expression are legal according to the rules of the language. Much of the complexity in name analysis involves the creation of new identifier bindings and satisfying ordering constraints in making those bindings. Many debuggers, including the examples given in this thesis, do not support the creation of new bindings while debugging. Consequently, the task of name analysis in the debugger is simplified to the task of looking up identifiers in the restored environment module. The lookup is done with a single call to the KeyInEnv function exported by the environment module that looks up an identifier in a particular scope and returns the appropriate definition table key. Type analysis is also greatly simplified by the fact that new types are not introduced during debugging. Implementing type analysis for the debugging query languages involved copying the type analysis specification from the translator and removing all parts that deal with the creation of new types. Extracting the right specification fragments is easiest to do in languages where the contexts that declare identifiers are separate from the contexts that use identifiers, which is the case in many modern languages. Where the contexts are not separate, computations may have to be modified slightly rather than simply removed. Type analysis computations also often depend on the fact that all new bindings of names in the environment have been completed. These dependencies can be removed, since all new bindings were created during translation. The last phase of processing involves evaluation of the expression. This phase requires greater original effort on the part of the debugger author. At a high level, however, this phase can be viewed as a hybrid between the code generation and constant folding tasks of the translator. The algorithms used during code generation to compute the locations of variables can be transformed for use by the debugger. The transformation involves replacing the generation of code with code that does a run-time interpretation. In a language like Pascal– that is lexically scoped and allows nested procedures, a common implementation technique is to store a static activation link in each activation record. References to variables defined in enclosing scopes must generate code to traverse the static activation links to the activation record containing the variable. Figure 6.5 shows the C code that generates the appropriate sequence of Alpha assembly instructions to follow the static link. This can be compared to the code from the debugger found in Figure 6.6 that computes the address of a variable reference. The first few statements of ComputeAddress compute values analogous to the first three arguments to GenNest. GenNest begins its execution by setting its result to PTGNULL which represents no output. In ComputeAddress, we want to begin with the value of the current stack pointer. The current stack pointer is determined by calling gdb through the function gdb get reg. The next thing both functions do is to check if the number of static links to traverse is zero. GenNest generates output representing a relative address from the stack pointer.2 ComputeAddress just carries out the addition (stradd is used to add numbers represented by strings). If static links do need to be traversed, then both functions check first to see if the 2 Alpha assembly code by convention simulates a frame pointer by adding the size of the frame to the stack pointer.
63
typedef struct { Operand arg; PTGNode out; } NestResult;
/* Location of the variable after the */ /* instructions from out have been executed. */ /* Code to traverse the static link. */
/* * Return representation of code to compute the address of a variable * reference by traversing static links. * * proc: Definition table key representing the procedure containing * the variable reference. * levels: The number of static links that must be traversed. * offset: The offset of the variable in its activation record. * reg: A register that can be used to hold the contents of * static links. */ NestResult GenNest (DefTableKey proc, int levels, int offset, Register reg) { NestResult result; DefTableKey parent; Register linkreg; result.out = PTGNULL; /* This will happen only if a compilation error exists. */ if (levels < 0) return result; if (levels == 0) { result.arg = CreateRelOpnd(GetFrameSize(proc,0)+offset, REG_SP); } else { /* Leaf procedures store their static link in register a0. */ if (GetIsLeaf(proc,0)) linkreg = REG_A0; else { linkreg = reg; result.out = PTGLoadQ(PTGReg(reg), PTGRelative(PTGInt(GetFrameSize(proc,0)-8), PTGReg(REG_SP))); } parent = proc; while (--levels) { parent = GetStaticParent(parent, NoKey); result.out = PTGSeq(result.out, PTGLoadQ(PTGReg(reg), PTGRelative(PTGInt(GetFrameSize(parent,0)-8), PTGReg(linkreg)))); linkreg = reg; } parent = GetStaticParent(parent, NoKey); result.arg = CreateRelOpnd(GetFrameSize(parent,0)+offset, linkreg); } return result; }
Figure 6.5: Generating Assembly Code to Traverse Static Link
64
/* * Return a string (charp) representation of the address of the variable * represented by key. */ charp ComputeAddress (DefTableKey key) { int levels; int offset; DefTableKey proc, parent; charp sp, result; proc = CurrentEnv->key; offset = GetDispl(key, 0); levels = GetLevel(proc, 0) - GetLevel(key, 0); sp = gdb_get_reg(REG_SP); if (levels == 0) return ostrdup(stradd(sp, itoa(GetFrameSize(proc, 0) + offset), 10)); else { /* Leaf procedures store their static link in register a0. */ if (GetIsLeaf(proc, 0)) result = gdb_get_reg(REG_A0); else result = gdb_get_ptr(stradd(sp, itoa(GetFrameSize(proc, 0) - 8), 10)); parent = proc; while (--levels) { parent = GetStaticParent(parent, NoKey); result = gdb_get_ptr(stradd(result, itoa(GetFrameSize(parent, 0) - 8), 10)); } parent = GetStaticParent(parent, NoKey); return ostrdup(stradd(result, itoa(GetFrameSize(parent, 0) + offset), 10)); } }
Figure 6.6: Debugger Code to Traverse Static Link
65 RULE: Expression ::= VariableAccess COMPUTE Expression.IsConstant = EQ(VariableAccess.Kind, Constantx); Expression.ConstValue = GetValue(CONSTITUENT VariableNameUse.Key SHIELD(Expression), 0); END; Figure 6.7: Constant Value Extraction for Constant Folding procedure is a leaf procedure.3 Leaf procedures store the static link in register a0 while other procedures store the static link at the beginning of the activation record. Both functions then go into a loop that iterates according to the number of static links that must be traversed. GenNest generates additional code on each iteration, while ComputeAddress gets the runtime contents of the static link from gdb using the function gdb get ptr. In addition to being able to compute addresses for variable references, the debugger must be able to evaluate the source language operators. If the translator does constant folding, the specifications for constant folding can be adapted to do run-time interpretation of the query language. The trick is to treat all identifier references as constants, since the values of variables can be determined while processing the query by making appropriate requests for information to gdb as shown above. Application of this principle can be seen in Figures 6.7 and 6.8. Figure 6.7 shows attribute grammar computations from the assembly language translator that determine the value of a constant name for use in constant folding. Note that there is an attribute called IsConstant that allows the constant folding computations to determine if it is dealing with a constant identifier or not. The value is extracted from a property (Value) of the definition table key representing the constant. Figure 6.8 shows corresponding computations used to extract the value for any kind of identifier. In this case, the IsConstant attribute is not needed since the values are always available during debugging. In addition to being able to get the value of a constant, the computations in Figure 6.8 use calls to gdb (gdb get int and gdb get boolean) to get values for integer and boolean variables. For user-defined types, the address of the variable is passed on. 6.3
Using Gdb to Provide Debugging Functionality As discussed in Chapter 4, Expect can be used to leverage the functionality provided by an existing debugger. Because the rest of the debugger is generated C++ code, there must be a bridge between this code and the scripted interaction with gdb. Figure 6.9 shows all of the function prototypes that make up this interface for the abstract stack-machine debugger. The remainder of this section will focus on the abstract stack-machine debugger. The assembly language debugger is only slightly different. 3 Leaf procedures are procedures that do not call any other procedures. By convention, parameters are passed differently to leaf procedures since it is known that registers will not have to be saved and restored during a call to a leaf procedure.
66
RULE: Expression ::= VariableAccess COMPUTE Expression.Value = IF(EQ(VariableAccess.Kind, Constantx), VariableAccess.Value, IF(EQ(VariableAccess.Type, Integer), ostrdup(gdb_get_int(VariableAccess.Value)), IF(EQ(VariableAccess.Type, Boolean), ostrdup(gdb_get_boolean(VariableAccess.Value)), VariableAccess.Value))); END; Figure 6.8: Getting the Value of a Variable in the Debugger
void gdb_init (char *); void gdb_finl (void) void gdb_list (int start, int end) void gdb_break_line (int line) void gdb_break_entry (int entry) void gdb_clear (char *number) void gdb_run (void) void gdb_continue (void) void gdb_next (void) void gdb_step (void) void gdb_stack (void) char* gdb_get_stack (char *index) char* gdb_get_base (void) Figure 6.9: Interface Functions for Gdb
67 log_user 0 set timeout -1 set gdb_running "n" set gdb_line "" spawn gdb --quiet "$gdb_args" expect "(gdb) " send "define hook-stop\recho ~dbg\rend\r" expect "(gdb) " Figure 6.10: Script for Gdb Initialization The first function gdb init is responsible for instantiating a new Expect interpreter and evaluating a script to initialize gdb. Part of instantiating the interpreter includes registering new commands for the interpreter. The registration is required so that operations that are only available in the generated C++ code can be invoked from the Tcl scripts that interact with gdb. For example, since Tcl’s arithmetic operations limit the size of the operands they can operate on, I registered a library of C functions that perform arithmetic operations on strings and do not have size limitations. I also added a command called convert label, which is central to the postprocessing that needs to be performed for many of the other commands. This function takes a target code label and determines what source procedure is represented by that label. Its current implementation involves doing a search of the environment module’s scoping hierarchy looking for a scope that matches the label name. The script that is used to initialize gdb also contains definitions for Tcl procedures for all of the scripted interfaces to gdb. Consequently, only one Tcl file needs to be created for the debugger and each of the functions listed in Figure 6.9 simply evaluate Tcl commands that invoke procedures created by the original script. The remainder of this section will talk about the interactions with gdb for each of the commands supported by the debugger. These are divided into four categories: initialization and finalization, run-time execution control, querying values in memory, and the remaining commands will be placed in a miscellaneous category. 6.3.1 Initialization and Finalization The part of the Tcl script that initializes gdb is shown in Figure 6.10. The first command, log user, prevents the interactions with gdb from being shown to the user, because the user should not be privy to these interactions. Changing the 0 to a 1 in this command is a very useful way of debugging the scripted behavior of the debugger. The next command disables any timeout associated with waiting for responses from gdb. Timeouts must be disabled, because it is impossible to know how long it should reasonably take for gdb to respond to a command that resumes execution of the program. The next two lines of the script initialize the variables gdb running and gdb line. gdb running indicates whether the program is currently running or not, which allows the
68 debugger to avoid issuing pointless execution tracing commands. gdb line keeps track of the source line number for the current point of execution. It is updated by each of the scripts that cause run-time execution of the program. This variable allows the debugger to establish the current scope for expression evaluation each time the program is suspended. The next two lines spawn the gdb process and wait for the initial prompt. The spawn command uses the value of a variable called gdb args as an argument to gdb to indicate the name of the executable program to be debugged. The value of the gdb args variable is set in the C++ function gdb init according to the program name passed to the debugger. The last two lines send a command to the spawned gdb to introduce a gdb hook. Hooks in gdb are macros that are invoked by gdb at prespecified times. The hook-stop hook defined in this script causes a unique string (~dbg) to be echoed each time execution of the program stops and before the prompt is issued. These special strings are useful to help the interaction scripts differentiate between output written by the program and output provided by gdb. 6.3.2 Run-Time Execution Control The commands for run-time execution control all require very similar interaction with gdb. The only difference is the command that is sent to gdb and the string that is echoed by gdb directly after the command has been submitted. The next step for each of these commands is to look for output that signals that gdb has suspended execution and to determine where execution was suspended. I encapsulated all of this in a single Tcl procedure called gdb resume whose definition can be found in Figure 6.11. The interact command found in this procedure allows the user to interact with the running program until the string ~dbg is detected, which is the special string that gdb echoes, because of the hook that was set at initialization. The procedure then uses the expect command to check for three different kinds of output from gdb. The check is in the form of complex regular expressions that match gdb’s output. The first regular expression corresponds to the output that gdb issues after stopping at a breakpoint. The second regular expression matches a printed source line, which is what gdb echoes after tracing a single statement. The last regular expression should only appear in the case of an error. Upon detecting a match, the procedure does three things: sends some output to the user to indicate the suspended point of execution and sets the gdb line and gdb running variables. Any output that is sent to the user with the send user command is post-processed such that target code label names are translated into source procedure names. The translation is done by the convert label command that was registered when the Tcl interpreter was initialized. The gdb line variable is queried by the C++ code so that it can be used as argument to a function of the environment module that looks up the closest enclosing scope corresponding to that line number. The C++ function gdb next is shown in Figure 6.12 as an example. It uses the Tcl function Tcl Eval to run the Tcl procedure called gdb next. Tcl GetVar queries the value of the gdb line variable from the interpreter and FindScope is the function from the environment module that finds the closest enclosing scope in the restored environment module that corresponds to the current line number.
69
proc gdb_resume {} { global gdb_line gdb_running interact -o "~dbg" return "~~" set expect_out(1,string) "" expect { -re "^(\r\nBreakpoint \[0-9\]+, )?(\[^ \t\n\]+)\ \\(\\)(\r\n\[ \t]*| )at\ (\[^ :\]+):(\[0-9\]+)\r\n(\[^\r\]*)\r\n(Current language: \ auto; currently asm\r\n)?\\(gdb\\) $" { send_user "$expect_out(1,string)\ [convert_label $expect_out(2,string)] at\ $expect_out(4,string):$expect_out(5,string)\ \n$expect_out(6,string)\n" set gdb_running "y" set gdb_line $expect_out(5,string) } -re "^(\[0-9\]+)\[ \t\]*(\[^\n\]*)\n\\(gdb\\) $" { send_user "$expect_out(1,string)\t$expect_out(2,string)\n" set gdb_line $expect_out(1,string) } -re "^\\(gdb\\) $" { set gdb_running "n" set gdb_line "" } } }
Figure 6.11: Gdb Interaction Following a Resumption of the Program void gdb_next (void) { char *gdb_line; int line; strcpy(CommandBuffer, "gdb_next"); Tcl_Eval(gdb_interp, CommandBuffer); gdb_line = Tcl_GetVar(gdb_interp, "gdb_line", TCL_GLOBAL_ONLY); if (gdb_line[0] != ’\0’) { line = atoi(gdb_line); CurrentEnv = FindScope(RestoreEnv, line, 1); } } Figure 6.12: Definition of the gdb next Function
70 proc gdb_stackval {index} { send "print St\[$index\]\r" set result [gdb_read_to_prompt] if [regexp {\$[0-9]+ = ([0-9]+)} $result x result] { return $result } { send_user "**GDB error: unable to read stack value.\n" return 0 } } Figure 6.13: Reading a Value from the Stack 6.3.3 Querying Values in Memory For the abstract stack-machine translation, the only two operations required for querying values from memory are one to get the stack index that corresponds to the frame pointer and another to get a value from the stack. Figure 6.13 shows the Tcl procedure responsible for getting a value from the stack. The argument index indicates the index into the stack for the value to be returned. The interaction is quite simple. The procedure sends a print command to gdb asking it for the value. A call to gdb read to prompt is used to read all of gdb’s response up to the next prompt. This output is then matched with a regular expression and the relevant piece of information is extracted and returned. 6.3.4 Miscellaneous Commands The commands whose interaction with gdb has not been discussed yet are list, break, clear, and stack. The first three of these correspond directly to the commands provided by gdb, which makes the interaction very simple. The command is sent to gdb and the output up to the prompt is read. The stack command is not that different, but in this case we want to post-process the output from gdb by replacing the target code labels with the source procedure names. Instead of reading all of gdb’s output up until the next prompt as is done with many requests, the script reads one line of output at a time. Each line represents a single stack frame. The script recognizes the components of a line using regular expression matching and calls convert label to translate the label names to procedure names known to the user. 6.4
Using Backend Query Processing As indicated before, the example debuggers described here do not have interactions with gdb that require the more powerful output recognition facilities that backend query processing can provide. To demonstrate their use, I have reimplemented the stack command using backend query processing. The goal of backend query processing as described in Section 4.3 is to come up with a specification to characterize the output from gdb. The scanner and parser generated from this specification is used to recognize gdb’s output and to create an abstract tree fragment that can be grafted into the abstract tree representing the query. Attribute grammar
71 @O@==@{ BeFrames: BeFrame+ . BeFrame: ’#’ BeNum BeIdent ’()’ ’at’ BeLocation BeNewLine / ’#’ BeNum BeAddress ’in’ BeIdent ’()’ ’at’ BeLocation BeNewLine / ’No stack.’ BeNewLine . @} @O@==@{ BeNum: $[0-9]+ BeIdent: C_IDENTIFIER BeAddress: $0x[0-9a-f]+ BeLocation: $[a-zA-Z_\.]+:[1-9][0-9]* BeNewLine: $\015 @} }
[mkint] [mkstr] [mkstr]
Figure 6.14: Specification Characterizing Output from Gdb’s where Command computations on the grafted tree can result in the necessary output being generated. Figure 6.14 shows the Eli specification that characterizes gdb’s output from the where command. The first part of this specification gives the EBNF grammar for the syntax of gdb’s responses. The second part of the specification characterizes the lexical tokens. A scanner and parser are generated from this specification as was described in Section 4.3. I then created a function called gdb stack that instantiates the new scanner and parser, sends the where command to gdb, extracts all output up to the next prompt, sets that as the input source for the instantiated scanner, and executes the parser. The result returned from this function is an abstract tree fragment that was generated during parsing that can be grafted into the abstract tree for the stack query. Figure 6.15 shows how this tree is grafted and the computations associated with the grafted tree that generate suitable output. The first rule in this figure shows the graft. The $ symbol in a rule indicates that the following nonterminal symbol is to be grafted into the tree. The graft is actually done by setting the GENTREE attribute for that nonterminal. As can be seen in the figure, the grafted tree is created by making a call to gdb stack. The remainder of Figure 6.15 is responsible for generating output for the different kinds of output generated by gdb. A chain named Output is used to ensure that the printf statements corresponding to the different tree contexts are executed in left-to-right order. In generating the output, the function FindLabel is used to translate the target code labels into source procedure names. The label MAIN is treated specially because it corresponds to the top-level scope that does not have a label associated with it at translation time.
72
CHAIN Output: VOID; RULE: Query ::= ’stack’ $ BeFrames COMPUTE BeFrames.GENTREE = gdb_stack(); CHAINSTART BeFrames.Output = 0; END; RULE: BeFrame ::= ’No stack.’ BeNewLine COMPUTE BeFrame.Output = printf("Program hasn’t been started yet.\n") DEPENDS_ON BeFrame.Output; END; RULE: BeFrame ::= ’#’ BeNum BeIdent ’()’ ’at’ BeLocation BeNewLine COMPUTE BeFrame.Output = printf("^%d %s -> %s\n", BeNum, IF(strcmp(StringTable(BeIdent), "MAIN"), FindLabel(DebugEnv, StringTable(BeIdent)), StringTable( GetStr(PTRSELECT(PTRSELECT(DebugEnv, child), key), 0))), StringTable(BeLocation)) DEPENDS_ON BeFrame.Output; END; RULE: BeFrame ::= ’#’ BeNum BeAddress ’in’ BeIdent ’()’ ’at’ BeLocation BeNewLine COMPUTE BeFrame.Output = printf("^%d %s -> %s\n", BeNum, IF(strcmp(StringTable(BeIdent), "MAIN"), FindLabel(DebugEnv, StringTable(BeIdent)), StringTable( GetStr(PTRSELECT(PTRSELECT(DebugEnv, child), key), 0))), StringTable(BeLocation)) DEPENDS_ON BeFrame.Output; END;
Figure 6.15: Grafting an Abstract Tree Fragment
CHAPTER 7 CONCLUSION AND FUTURE WORK Programming languages are no longer evaluated solely based on the features of the language and the abstractions they provide. The development environments available for a language also play a large role in programmer productivity and the ability to maintain software written in that language. Good development environments provide support throughout the development lifecycle of a program. Such support might include analysis and design tools suited to the programming language’s paradigm as well as a high quality compiler implementation. It also includes tools for debugging, performance analysis, and maintenance. Just as we are interested in cutting down the time it takes to develop programs written using programming languages, we are also interested in cutting down the time it takes to produce the development environments for those programming languages. Today’s compiler generation tools can significantly cut the time it takes to develop compiler implementations that can be competitive with hand-coded implementations [57]. Little attention has been paid to the generation of other components of a development environment. This thesis begins to address this void by demonstrating a framework for the rapid development of debuggers. One of the most important considerations in developing a debugger is to maintain the level of abstraction provided by the programming language during a debugging session. Programming languages exist to provide some level of abstraction to their users. These abstractions provide leverage to programmers to cut down the time it takes to develop solutions to their problems. As a result, programmers do not typically want to be burdened by the details of a particular translation. Maintaining the level of abstraction in a debugger requires the cooperation of the translator. For many debuggers, this means that the compiler must generate debugging information in some prescribed format. The framework described here shows that the link between translator and debugger can be even closer. Compiler generation tools can be adapted to support the construction of debuggers. The fact that the same kinds of specifications can be used when building both the translator and the debugger means that the author of a debugger can reuse many of the specifications used to create the translator. Using compiler generation tools ensures that modifications that need to be made to a translator will be easy to make. It should also be clear from this thesis that significant leverage can be obtained from an adapted compiler generation system in the development of a debugger. One of the most important adaptations is to allow communication between the translator and debugger. Instead of storing information from the translator in a prescribed format as is done with many debuggers, Chapter 2 described a generic mechanism for making C++ data structures persistent. When applied to data structures of the compiler generation system, the mechanism allows the debugger to read data structures from the translator and
74 use them with the same interface. Using a generic mechanism of this kind ensures that a new translator with potentially different (or experimental) data representations of source program information will be able to use this framework. Chapter 3 described a set of adaptations that allow the interactive use of compiler generation tools. The most important observation for this part of the framework is that processing an interactive debugging query language is not at all unlike processing a programming language. In fact, in order to maintain the programming language abstractions in the debugger, it is useful to at least partially accept the same language. The last part of the framework, described in Chapter 4, demonstrates how to provide the basic debugging functionality. While compiler generation tools do not by themselves provide much help in this area, they can be used to leverage the basic debugging functionality that existing debuggers provide. The bridge between the compiler generation tools and the existing debuggers is provided by a tool like Expect that allows programmed interaction with existing programs. Expect captures the needed output from an existing debugger. For many interactions, Expect’s regular expression matching facilities are sufficient to process an existing debugger’s output, but this thesis has also demonstrated a way that a complete set of compiler generation tools can be used to do this processing. One of the most important consequences of using existing debuggers to provide basic debugging functionality is that this framework can be used as easily for translations from one high-level source language to another rather than only translations to assembly or object code. Very few debuggers exist that debug this kind of translation and yet the number of translations from one high-level source language to another appears to be on the rise. While this thesis has focused on how the various adaptations to compiler generation tools are combined to produce a debugger, it is important to note that many of the adaptations are useful in their own right. The ability to store information about a translated input for later use is likely to be necessary for any kind of programming support tool. Tools that have an interactive component and which draw on constructs from an existing programming language (with an existing grammar) can benefit from the ability to generate a query processor. The ability to process different languages within the same program, as is described in conjunction with backend query processing, can be useful for applications that take input from different sources. The framework described in this thesis is not only valuable from the point of view of providing debuggers, but also for the purpose of providing a testbed for further research in debugging. For example, one research issue in debugging is how to deal with debugging optimized code. Existing research suggests that the ability to debug such code relies heavily on having additional information from the translator other than that which is provided in today’s standard object code formats. The support provided as part of this research for passing arbitrary information from the translator to the debugger may more easily enable experimentation. In addition, some recent debugging research aims to extend the constructs provided in debugging query languages. For example, the Duel debugger [24] adds debugging language constructs that enhance the users ability to explore the state of the program. Using compiler generation tools to process the query language can make it easier to experiment with changes of this kind.
BIBLIOGRAPHY
[1] Vincenzo Ambriola and Carlo Montangero. Automatic generation of execution tools in a GANDALF environment. Journal of Systems and Software, 5:155–171, 1985. [2] Ken Arnold and James Gosling. The Java Programming Language, appendix D. The Java Series. Addison-Wesley, 1996. [3] M.P. Atkinson, P.J. Bailey, K.J. Chisholm, P.W. Cockshott, and R. Morrison. An approach to persistent programming. The Computer Journal, 26(4):360–365, 1983. [4] AT&T. UNIX System V Release 4 Programmer’s Guide: ANSI C and Programming Support Tools, 1990. [5] Ron Baecker, Chris DiGiano, and Aaron Marcus. Software visualization for debugging. Communications of the ACM, 40(4):44–54, April 1997. [6] Rolf Bahlke, Bernhard Moritz, and Gregor Snelting. A generator for language-specific debugging systems. In Proceedings of the SIGPLAN Symposium on Interpreters and Interpretive Techniques, volume 22, pages 92–101. SIGPLAN, ACM, July 1987. [7] Rolf Bahlke and Gregor Snelting. The PSG system: From formal language definitions to interactive programming environments. ACM Transactions on Programming Languages and Systems, 8(4):547–576, October 1986. [8] David M. Beazley. SWIG : An easy to use tool for integrating scripting languages with C and C++. Presented at the 4th Annual Tcl/Tk Workshop, Monterey, CA., July 1996. [9] P. Borras, D. Cl´ement, Th. Despeyroux, J. Incerpi, G. Kahn, B. Lang, and V. Pascual. Centaur: the system. In Proceedings of SIGSOFT’88, Third Annual Symposium on Software Development Environments (SDE3), Boston, MA, 1988. [10] Jan Bosch and G¨orel Hedin (eds.). Proceedings of ALEL’96, workshop on compiler techniques for application domain languages and extensible language models. Technical Report LU-CS-TR:96-173, Lund University, Sweden, 1996. [11] Per Brinch Hansen. Brinch Hansen on Pascal Compilers. Prentice-Hall, Englewood Cliffs, N.J., 1985. [12] Gary Brooks, Gilbert J. Hansen, and Steve Simmons. A new approach to debugging
76 optimized code. In Proceedings of the SIGPLAN ’92 Conference on Programming Language Design and Implementation, pages 1–11, 1992. [13] Geoffrey Clemm and Leon Osterweil. A mechanism for environment integration. ACM Transactions on Programming Languages and Systems, 12(1):2–25, 1990. [14] Deborah S. Coutant, Sue Meloy, and Michelle Ruscetta. DOC: A practical approach to source-level debugging of globally optimized code. In Proceedings of the SIGPLAN ’88 Conference on Programming Language Design and Implementation, pages 125–134, Atlanta, Georgia, June 1988. [15] Fabio Q. B. da Silva. Correctness proofs of compilers and debuggers: an overview of an approach based on structural operational semantics. Technical Report ECS-LFCS-92233, Laboratory for Foundations of Computer Science, University of Edinburgh, 1992. [16] Tor Didriksen, Anund Lie, and Reidar Conradi. IDL as a data description language for a programming environment database. SIGPLAN Notices, 22(11):71–78, November 1987. [17] Digital Equipment Corporation. DEC OSF/1 Assembly Language Programmer’s Guide, March 1993. Part Number: AA-PS31A-TE. [18] John Doppke. Personal communications. [19] D. R. Engler. VCODE: a retargetable, extensible, very fast dynamic code generation system. In Proceedings of the SIGPLAN ’96 Conference on Programming Language Design and Implementation, Philadelphia, PA, May 1996. http://www.pdos.lcs.mit.edu/˜engler/vcode.html. [20] C. W. Fraser, D. R. Hanson, and T. A. Proebsting. Engineering a simple, efficient code generator generator. ACM Letters on Programming Languages and Systems, 1(3):213–226, September 1992. [21] Free Software Foundation. The GNU linker. [22] Free Software Foundation. The ”stabs” debugging format. GNU info document. [23] Free Software Foundation. The GNU debugger, 4.12 edition, January 1994. [24] Michael Golan and David R. Hanson. DUEL – a very high-level debugging language. In Proceedings of the USENIX Winter Conference. USENIX, January 1993. In San Diego, California. [25] Robert W. Gray. A generator for lexical analyzers that programmers can use. In Proceedings of the 1988 USENIX Conference, pages 147–160, June 1988. [26] Robert W. Gray, Vincent P. Heuring, Steve P. Levi, Anthony M. Sloane, and William M.
77 Waite. Eli: A complete, flexible compiler construction system. Communications of the ACM, 35(2):121–131, February 1992. [27] A. Nico Habermann and David Notkin. Gandalf: Software development environments. IEEE Transactions on Software Engineering, 12(12):1117–1127, December 1986. [28] David R. Hanson and Jeffrey L. Korn. A simple and extensible graphical debugger. In Proceedings of the USENIX 1997 Annual Technical Conference, pages 163– 174, Anaheim, CA, January 1997. [29] Jurgen Heymann. A 100% portable inline-debugger. SIGPLAN Notices, 28(9):39–46, September 1993. [30] Mark Scott Johnson. The design and implementation of a run-time analysis and interactive debugging environment. Technical Report 78-6, University of British Columbia, August 1978. Ph.D. Thesis. [31] Mark Scott Johnson. A software debugging glossary. SIGPLAN Notices, 17(2):53, February 1982. [32] Basim M. Kadhim. Property definition language manual. Technical Report CU-CS776-95, University of Colorado, July 1995. [33] Basim M. Kadhim and William M. Waite. Maptool – supporting modular syntax development. In Tibor Gyim´ othy, editor, Proceedings of the 6th International Conference on Compiler Construction, CC’96, volume 1060 of Lecture Notes on Computer Science, pages 268–280, Link¨oping, Sweden, April 1996. Springer. [34] Sam Kamin(ed.). Proceedings of DSL’97 – workshop on domain-specific languages. Technical report, University of Illinois, 1997. Contents available from URL http://wwwsal.cs.uiuc.edu/˜kamin/dsl. [35] U. Kastens. PTG: Pattern-based Text Generator. University of Paderborn. Distributed with the Eli Compiler Construction System. [36] Uwe Kastens. LIDO – Computations in Trees. University of Paderborn. Distributed with the Eli Compiler Construction System. [37] Uwe Kastens. LIDO - Reference Manual. University of Paderborn. Distributed with the Eli Compiler Construction System. [38] Uwe Kastens. An attribute grammar system in a compiler construction environment. In Proceedings of the International Summer School on Attribute Grammars, Application and Systems, volume 545 of Lecture Notes on Computer Science, pages 380–400. Springer Verlag, 1991.
78 [39] Uwe Kastens. Generating interpreters from compiler specifications. Technical Report TR-RI-94-143, University of Paderborn, March 1994. [40] Uwe Kastens and William M. Waite. An abstract data type for name analysis. Acta Informatica, 28:539–558, 1991. [41] Uwe Kastens and William M. Waite. Modularity and reusability in attribute grammars. Acta Informatica, 31:601–627, 1994. [42] David Keppel. A portable interface for on-the-fly instruction space modification. In Proceedings of the Fourth International Conference on Architectural Support for Programming Languages and Operating Systems, pages 86–95. ACM, April 1991. [43] Chris Laffra and Ashok Malhotra. HotWire — A visual debugger for C++. In USENIX Association, editor, Proceedings of the 1994 USENIX C++ Conference: April 11–14, 1994, Cambridge, MA, pages 109–122, Berkeley, CA, USA, April 1994. USENIX. [44] John R. Levine, Tony Mason, and Doug Brown. Lex & Yacc. O’Reilly & Associates, 1992. [45] Don Libes. Exploring Expect. O’Reilly, December 1994. [46] Mark A. Linton. The evolution of Dbx. In Proceedings of the USENIX Summer Conference, pages 211–220. USENIX, June 1990. In Anaheim, California. [47] Object Design, Inc. http://www.odi.com.
ObjectStore PSE product description.
Available from
[48] Ronald A. Olsson, Richard H. Crawford, W. Wilson Ho, and Christopher E. Wee. Sequential debugging at a high level of abstraction. IEEE Software, 8(3):27–36, May 1991. [49] John Ousterhout. Tcl and the Tk Toolkit. Addison-Wesley, 1994. [50] Vern Paxson. A survey of support for implementing debuggers. ftp.ee.lbl.gov:papers/debugger-support.ps.Z., October 1990.
Available from
[51] Robert Pizzi. GNU debugger internal architecture. Department of Applied Science, University of California at Davis, Lawrence Livermore National Laboratory., December 1993. [52] Michael L. Powell and Mark A. Linton. Database support for programming environments. Technical Report UCB:CSD-83-134, University of California, Berkeley, 1983.
79 [53] Norman Ramsey and Mary Fern´ andez. The New Jersey machine-code toolkit. In Proceedings of the 1995 USENIX Technical Conference, pages 289–302, New Orleans, LA, January 1995. [54] Thomas W. Reps and Tim Teitelbaum. The Synthesizer Generator: A System for Constructing Language-Based Editors. Texts and Monographs in Computer Science. Springer-Verlag, New York, New York, 1989. [55] Vivek Singhal, Sheetal V. Kakkad, and Paul R. Wilson. Texas: An efficient, portable persistent store. In Proceedings of the Fifth International Workshop on Persistent Object Systems, September 1992. Available via anonymous ftp from cs.utexas.edu:pub/garbage. [56] Anthony M. Sloane. Execution monitoring for reusable software components. Technical Report CU-CS-677-93, University of Colorado, 1993. Ph.D. Thesis. [57] Anthony M. Sloane. An evaluation of an automatically generated compiler. ACM Transactions on Programming Languages and Systems, 17(5):691–703, September 1995. [58] Rok Sosic. Design and implementation of Dynascope, a directing platform for compiled programs. Computing Systems, 8(2):107–134, 1995. [59] Rok Sosic. A procedural interface for program directing. Software–Practice and Experience, 25(7):767–787, July 1995. [60] Tim Teitelbaum and Thomas Reps. The Cornell Program Synthesizer: A syntaxdirected programming environment. Communications of the ACM, 24(9):563–573, September 1981. [61] Christine L. Tsien. Maygen: A symbolic debugger generation system. Master’s thesis, Massachusetts Institute of Technology, 1991. [62] William M. Waite. A complete specification of a simple compiler. Technical Report CU-CS-638-93, University of Colorado, Boulder, January 1993. [63] William M. Waite and Basim M. Kadhim. A general property storage module. Technical Report CU-CS-786-95, University of Colorado, September 1995. [64] William B. Warren, Jerry Kickenson, and Richard Snodgrass. A tutorial introduction to using IDL. SIGPLAN Notices, 22(11):18–34, November 1987. [65] Ross N. Williams. FunnelWeb User’s Manual, May ftp://ftp.ross.net/clients/ross/funnelweb/funnelweb300/funnelweb 300.ps.
1992.
[66] Phil Winterbottom. ACID: A debugger built from a language. In Proceedings of
80 the USENIX Winter Conference, pages 211–222. USENIX, January 1994. In San Francisco, California. [67] Alexander L. Wolf. The Persi persistent object system library. University of Colorado, available from author, 1993. [68] Andreas Zeller and Dorothea L¨ utkehaus. DDD - a free graphical front-end for UNIX debuggers. SIGPLAN Notices, 31(1), January 1996.