The language features which make Ada a difficult language from the point of view of a compiler builder are the same for the debugger builder. Features such as ...
Debugging Ada Bernd Bruegge
Department of Computer Science Carnegie Mellon University Pittsburgh, Pa. 15213
Abstract The complexity of the Ada language poses several problems for the builder of a debugger. The Ada language constructs that cause these problems are identified and solutions are proposed that can be incorporated in a debugger based on Pascal. This involves changes in the symbol table of the compiler as well as the introduction of constructs outside the language, based on the argument that having to obey the language rules is an obstacle when debugging programs. In particular, we propose the use of dynamic abstractions to manipulate names from several name spaces that are not necessarily visible at the same time in the Ada program if Ada’s scope rules are observed. Several of the proposed solutions have been implemented in an Ada compiler and a debugger called KRAUT as part of of the SPICE project currently being developed at Carnegie-Mellon University.
1. Introduction After the Ada language definition was introduced, it was tempting to "upgrade" existing Pascal compilers and convert them into Ada compilers. This approach seemed feasible because - except for syntactic differences - Pascal could be seen as a subset of Ada. Several compiler builders followed this approach and built compilers which ended up as subset Ada compilers, providing an Ada language with one or more of the following features missing: Generics, overloading and tasking. When building an Ada debugger, it is tempting to follow the same idea: Start from a (line number oriented) debugger for Pascal, for example PasDDT [Hisgen, 1981] or KRAUT [Bruegge, 1983b], or some Algol-like language and modify it for Ada. Again, this approach is not likely to succeed. The implementers will encounter difficulties, because none of the existing Pascal debuggers was designed to be language portable. Furthermore, a straightforward implementation of an Ada debugger based on a traditional debugger for block structured languages is not possible. The problems again are rooted in the complexity of the Ada language. The language features which make Ada a difficult language from the point of view of a compiler builder are the same for the debugger builder. Features such as initialization at declaration time or type properties that are only determinable at runtime make it necessary to keep more complex information in the symbol table. Other features such as overloading or separate compilation introduce large name spaces, often only partially created or known by the user himself, leading to problems of proper name management at debug time. However, the task of writing a debugger is not the same as that of writing a compiler. Specifically, the debugger does not have to implement the full language. In fact, the violation of some language rules (type checking, scope rules, etc) is actually desired during the debugging process. Under this assumption, it is possible to start with a Pascal debugger and upgrade it to an Ada debugger. In the following we discuss the problems involved in writing such a debugger. As we will see, this includes problems that were traditionally associated with debugging of optimized code. We will deal with the problem of debugging optimized code only as far as it is required by the reference manual. Thus the
1
following discussion assumes that the programs are translated by a nonoptimizing Ada compiler supporting the full Ada reference manual1. Section 2 defines what one could call the "traditional" symbol table format for Pascal debuggers. This definition serves as the base of our discussion to cope with Ada’s "non Pascal" features. Section 3 deals with language features for which we propose the extension of the traditional symbol table format. These are initialization at declaration time (section 3.1), inline expansion (section 3.2) and generics (section 3.3). Section 4 argues that several of Ada’s new features can be dealt with in a better way by mechanisms that allow the user to violate the language rules. We introduce the notion of a dynamic abstraction which is an abstraction maintained during debug time involving names from several name spaces that are not necessarily visible at the same time in the Ada program. Dynamic abstractions are manipulated by a visibility list (section 4.2) and by search modes (section 4.3). Language features that can be dealt with by dynamic abstractions include separate compilation (section 4.4) and overloading (section 4.5). Finally the problem of debugging tasks and exceptions is discussed and the use of PATHRULES [Bruegge, 1985] for these language constructs (section 5 and 6) is proposed. The paper discusses the issues of extending a Pascal debugger to an Ada debugger on the design level. We are currently modifying the KRAUT debugger to debug Ada programs according to the proposals of this paper. Section 7 describes the implementation status of this effort.
2. Symbol Table Definitions To allow symbolic debugging of Pascal programs, a compiler has to generate two tables for the debugger: The data table performs the mapping of program names to target locations and the code table maps program instructions such as statements, etc. to target locations. Each of these tables is usually searched in both directions and we distinguish the following mappings: Data table • Address: TargetAddress => IdentifierList • Name: Identifier x Scope x Scoperule => DescriptorList Code table • Target: TargetAddress => SourceCodeLocation • Source: SourceCodeLocation => TargetAddress Given a virtual address in the target process, Address returns the names of the objects containing a field that is allocated at that address. Given a string, a scope and a scope rule (dynamic or static search), Name returns a list of descriptors, where a descriptor contains the virtual address, the type, etc. of the identifier. Given an address in the code of the target process, Target returns the corresponding location in the source program. Given the location of a statement in the source program, Source returns the corresponding virtual address in the target process. The name mapping is useful mainly for inquiries about variables, to determine their value or to make changes to them. It is by far more used than the address mapping. The address mapping is useful for
1
The full treatment of the problems of debugging optimized code is still an open research area [Hennessy, 1982], [Zellweger, 1984], [Wall,1985]
2
watching addresses being unintentionally touched to determine the name of the corresponding variable. The target mapping is used when the program counter of the target process has to be interpreted in terms of the source program. For example when printing the call stack, the debugger examines the return addresses of routines on the runtime stack and uses the target mapping to find the corresponding source statements. The source mapping is useful for any debugging command that takes a source location as argument, for example setting a breakpoint. The notation for a location in the source code depends on the representation of the source program. In the following we assume the source program is represented in traditional ASCII form as a file of source lines. The source lines can contain one or more statements and a statement index is needed to differentiate between the statements on one line. Thus a source line oriented source mapping looks as follows: Source: Line x FileName x StatementIndex => TargetAddress We will use the term symbol table informally to denote all the above mappings and other tables introduced later in this paper.
3. Symbol Table Extensions This section deals with language features for which we propose the extension of the traditional symbol table format. These are initialization at declaration time (section 3.1), inline expansion (section 3.2) and generics (section 3.3).
3.1. Initialization For Pascal debugger implementations, the source and target mappings are actually functions. When their domains are monotonic increasing the ranges are also monotonic increasing. Thus for Pascal, the creation of the code table is very simple: The compiler can represent Source and Target by the same data structure - for example, a linear ordered array of record entries - and emit the table on the fly during the code generation. Furthermore, because Source as well as Target are monotonic increasing, the debugger can use fast search algorithms - such as binary search - for both mappings. Ada allows objects to be initialized in the declaration part. This complicates the code generation and the creation of the code table. The problem arises because it is possible to nest subprogram declarations between the initialization code of the locals and the body of a another subprogram. The following program fragment illustrates the problem. Inside procedure X three objects are declared: Variable A initialized to 5, Variable B initialized to 10 and Procedure Y : 1 Procedure X is2 2 A: integer := 5; 3 B: integer := 10; 4 5 Procedure Y is 6 begin 7 A := 6; 8 end Y; 9 10 begin 11 B := A * B; 12 end X; 2
The program examples in this paper are not legal Ada programs: Each source line is prefixed by a line number.
3
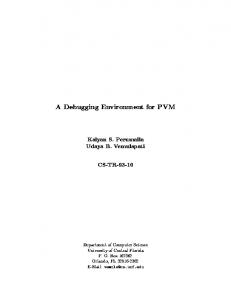
There are several ways for a compiler to generate code for this fragment. The constraint is that the variables A and B have to be initialized every time X is called. Thus the code generated for A and B has to be executed before the body of X is executed. The code for procedure Y cannot be nested between the code initializing A and B and the body of X - except if gotos would be inserted after the expressions. If we assume the compiler generates code for a virtual stack machine3 as in figure 3-1, then the compiler cannot maintain a monotonic increasing ordering of line numbers which at the same time is also monotonic increasing for code locations. Two options are available for the compiler builder. The first option is the two mappings are represented by two different data structures. This offers fast access for both mappings but requires more space. Second the two mappings are still represented by one data structure, but only one mapping is sorted. This solution is preferable if one of the mappings is used more often than the other one and space is a limited resource. From measurements we have conducted with KRAUT we determined that the target mapping is requested about 5 times more often than the source mapping Thus a code table that is sorted by source locations seems to be advisable in a disk space limited environment. Such a code table is shown in figure 3-2. X: Target Address 0 2 4 6 8 10 12 14 16
Instruction LOAD 5 STORE A LOAD 10 STORE B LOAD A LOAD B ADD STORE B RETURN
Target Address 18 20 22
Instruction LOAD 6 STORE A RETURN
Y:
Figure 3-1: Target Code for Subprograms X and Y Source Location => Target Location 2 0 3 4 7 18 8 22 11 8 12 16 Figure 3-2: Code Table for X and Y (sorted by source location) Because it is possible to initialize objects at declaration time, we propose to set break points in the declaration part. Thus in addition to be able to break before or after subprograms and sourcelines, an Ada debugger should provide a break command that permits the user to break before or after any initialization code.
3
For simplicity reasons we assume an instruction format where each instruction is two bytes long.
4
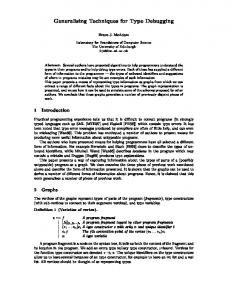
3.2. Inline Expansion The Inline Pragma takes one or more names of subprograms or generic subprograms as arguments. It specifies that the subprogram bodies should be expanded inline at each call whenever possible. There are several problems with inline expansion on the compiler and on the debugger side. The reference manual states that an implementation is free to follow or ignore the recommendation expressed by the Inline pragma. Sometimes it is not even possible to follow it, for example in recursive subprogram definitions. Usually subunits of a unit can be (re)compiled without affecting the unit itself. However, this is not the case if a subunit contains subprograms declared Inline and if they are called in the unit or other units importing those subprograms. If an Inline pragma is applied to a subprogram declaration given in a package specification, inline inclusion will only be achieved if the the package body is compiled before units calling the subprogram. In such a case, inline inclusion creates a dependence of the calling unit on the package body, and the compiler must recognize this dependency when deciding the need for recompilation. If a calling unit is compiled before the package body, the pragma may be ignored by the compiler for such calls. Similar considerations apply to a separately compiled subprogram for which an Inline pragma was specified. For example, if unit A in the program fragment in figure 3-3 is compiled before unit B, the Inline pragma will be ignored. If B is compiled before A, each call to Transform or Collect is inline expanded by the compiler. Because the language does not necessarily guarantee inline expansion, the user never can be certain whether a subprogram is inline expanded or not. Thus we recommend that an Ada debugger should indicate whether a subprogram is inline expanded if this information is requested by the user. If the subprograms in figure 3-3 are inline expanded, the generated target code for our ideal stack machine is shown in figure 3-4. For simplicity reasons we assume that the formal parameters of the expanded subprogram are replaced by their actual parameter expressions for the given call. Furthermore we assume that the code is not peephole optimized. Inline expansion also complicates the debugger side. The basic idea of providing debugger support for inline expansion is that when any target location of an inline expanded subprogram is reached, the debugger has to should display the virtual runtime stack, that is, all the activation records that would be on the runtime stack if subprograms would not be inline expanded. To achieve this, a virtual frame table (called inline table in [Zellweger, 1983], [Zellweger, 1984]) is introduced and the target and source mappings are modified slightly. The virtual frame table records information whenever the compiler expands a subprogram call inline. Each table entry contains three items: a pointer to the source location of the call (CallingLocation, a pointer to the symbol table entry of the subprogram (Subprogram and a field called CallerID. CallerID permits the debugger to deal with nested inline subprograms. If the CallerID field is 0, the caller is a normal subprogram, if the CallerID is not 0, then the entry denotes a nested inline call. In this case the value of CallerID is the table index describing the caller. A chain of nonzero CallerIDs is called a virtual frame list. The head of a virtual frame list points to the "top" of that part of the virtual runtime stack that simulates the target location and the tail points to its "bottom". Virtual frame lists can completely be determined at compile time because the compiler knows how deep inline expanded subprograms are nested at any time. The virtual frame table for the program fragment in figure 3-3 is shown in figure 3-5. Because this
5
-- Unit A SA.1 procedure Top is4 SA.2 R : real; SA.3 U : real; SA.4 procedure Transform(U: in out Real) is separate; SA.5 procedure Collect(U: in out Real) is separate; SA.6 begin SA.7 Collect(R); SA.8 Transform(R); SA.9 Collect(S); SA.10 Transform(S); SA.11 end Top; -- Unit B SB.1 separate (Top) SB.2 pragma InLine(Transform, Collect); SB.3 SB.4 function Mult(X,Y: integer) return integer is SB.5 var I : integer; SB.6 begin SB.7 I := X * Y; SB.8 return I; SB.9 end Mult; SB.10 SB.11 procedure Transform(U: in out Real); SB.12 begin SB.13 U := Mult(U,2); SB.14 U := U + 2; SB.15 end Transform; SB.16 SB.17 procedure Collect(U: in out Real); SB.18 begin SB.19 U := 2.0; SB.20 end Collect; Figure 3-3: Program fragment using inline expansion particular example does not contain any nested inline subprograms, all CallerID entries are 0. The source mapping is modified to a one-to-many mapping. Each source location of the subprogram has to be mapped onto all the target locations of the inline expanded target code. For example, the source location SB.13 of figure 3-3 has to be mapped to the target locations TA.6 and TA.26 of figure 3-4. The target mapping is modified in the following way: If a target location belongs to an inline expanded subprogram, the corresponding source location is the pointer to the source text location and the FrameIndex points to the virtual frame table entry that describes the subprogram call. With these three mappings, the debugger builds the virtual runtime stack for any given target location as follows. First, it looks up the entry for the target location and checks its FrameIndex entry. If it is 0, then the location does not correspond to an inline subprogram. If the entry is nonzero, it is the head of a virtual frame list. In this case the debugger follows the list until an entry is reached whose CallerID field is 0. The chain of all these entries constitutes that part of the virtual runtime stack that simulates the calling situation for the given target location.
6
Target code for A TA.0
ENTRY
TA.2 LOAD TA.4 STORE TA.6 TA.8 TA.10 TA.12 TA.14 TA.16 TA.18 TA.20
TOP 2 R
LOAD LOAD CALL STORE LOAD LOAD ADD STORE
R 2 MULT R R 2 R
TA.22 LOAD TA.24 STORE
2 S
TA.26 TA.28 TA.30 TA.32 TA.34 TA.36 TA.38 TA.40
S 2 MULT S S 2
LOAD LOAD CALL STORE LOAD LOAD ADD STORE
S
TA.42 EXIT Top
Target code for B TB.0 TB.2 TB.4 TB.6 TB.8
ENTRY MULT MULT STORE I LOAD I EXIT MULT
Figure 3-4: Target code for Unit A and B (with inline expansion) InlineIndex 1 2 3 4
==>
Calling Location SA.7 SA.8 SA.9 SA.10
Subprogram Collect Transform Collect Transform
Figure 3-5: Inline Table for unit A and B
CallerID 0 0 0 0
For example, let us assume we are given the fragment of a target mapping Target Location T.0 .... T.4 .... T.20 and the virtual frame table
=>
Source Location B.5
FrameIndex 4
B.5
1
B.5
5
7
Index 1 2 3 4 5
Calling Location A.5 A.10 A.100 A.20 A.20
Name Proc1 Proc2 Proc3 Proc4 Proc4
CallerID 0 1 0 2 3
If there are currently three frames on the real runtime stack with the following program counters (return addresses) T.0 T.4 T.20
[TopOfStack] [BottomOfStack]
then the debugger would build the following virtual runtime stack Proc4 Proc2 Proc1 Proc1 Proc5 Proc3
[TopOfStack]
[BottomOfStack]
which then can be used to display the runtime stack as expected by the user.
3.3. Generics Generics can be treated in the same way as inline expansion from the debugger’s point of view. For each call of a generic subprogram, a unique index is created, and the source location of the call and the name of the generic instance are entered into the virtual frame table at that index. Again, as with inline expansion, the source mapping is no longer a one to one mapping but each source location must contain pointers to the target locations of each of the instances. This is done by generalizing the domain of Source to include the names of generic instances: In the case of a line number oriented source mapping we would have Source: Line x File x StatementIndex x InstanceName => TargetAddress where InstanceName is the range of strings denoting instances of generics defined in the source program. The target mapping also has to be modified but only if generics are not expanded but shared. For example, an Ada compiler might generate shared code for generics instantiated inside a recursive subprogram or for a generic with a formal type parameter that is instantiated with two different subtypes. If both types have the same machine representation or require the same machine length for the representation of the type and have the same underlying machine operations that operate on them, the compiler could use the same code for both instances. In this case, a breakpoint implementation based on code patching would not be sufficient to distinguish between breakpoints defined for any of these instances. At any time, the runtime system has to maintain the name of the current instance of the generic. The current instance name can then be used by the debugger to disambiguate any uncaught exception or breakpoint in generic instances independent of underlying optimizations. For example, if the code is shared between two instances Foo and Bar of the generic FooBar and the user has set a breakpoint in instance Foo, for every breakpoint the debugger can compare the current instance name with the name Foo and break only if there is a match.
8
We therefore introduce a variable CurrentGeneric that always contains the FrameIndex of the current generic instance. CurrentGeneric has to be updated at runtime every time a generic subprogram is called, and it has to be saved if another generic subprogram is called inside the current generic subprogram. The index can be passed as a hidden parameter in the generic subprogram call. A possible data structure for CurrentGeneric is a stack: Every time, a generic subprogram is called inside another generic subprogram, the new index is pushed onto the stack. And everytime a generic subprogram is exited, the stack is popped. The top of this stack always contains the current generic. The following example illustrates the previous discussion. Given the following Ada fragment: --Specification: S.1 Generic S.2 type Element is private; S.3 procedure Exchange(U,V: in out Element); --Body: B.1 procedure Exchange(U,V: in out Element); B.2 T: Element; B.3 B.4 begin B.5 T:= U; B.6 U := V; B.7 V := T; B.8 end Exchange; -- User program: U.1 ... U.2 procedure IntSwap is new Exchange(Integer); U.3 procedure CharSwap is new Exchange(Character); U.4 procedure ArraySwap is new Exchange(Array(1..2) of Integer); U.5 ... U.10 IntSwap(I,J); U.11 CharSwap(A,B); U.12 ArraySwap(M,N); U.13 ... The compiler might generate the following code for IntSwap and CharSwap T.0 T.2 T.4 T.6 T.8 T.10 T.12
LOAD U STORE T LOAD V STORE U LOAD T STORE V RETURN
For ArraySwap the compiler might generate the code:
9
T.14 T.16 T.18 T.20 T.22 T.24 T.26 T.28 T.30 T.32 T.34 T.36 T.38
LOAD U1 LOAD U2 STORE T1 STORE T2 LOAD V1 LOAD V2 STORE U1 STORE U2 LOAD T1 LOAD T2 STORE V1 STORE V2 RETURN
The source mapping for Exchange would look as follows: Source Location B.5 B.6 B.7 B.8
Target Location T.0, T.14 T.4, T.22 T.8, T.30 T.12, T.38
And the target mapping for IntSwap and CharSwap would be Target Location T.0 T.4 T.8 T.12
Source Location, FrameIndex B.5 1 | 2 B.6 1 | 2 B.7 1 | 2 B.8 1 | 2
For the target mapping of ArraySwap we get: Target Location T.14 T.22 T.30 T.38
Source Location, FrameIndex B.5 3 B.6 3 B.7 3 B.8 3
The virtual frame table for procedure Exchange is Frame 1 2 3
Calling Location U.10 U.11 U.12
Name IntSwap CharSwap ArraySwap
CallerID 0 0 0
In our example, code is shared between the generic instances IntSwap and CharSwap, thus the virtual frame list entries of the target mapping contain frame indices of the form 1|2. If in such case, CurrentGeneric contains 1, then the debugger chooses subprogram IntSwap, if CurrentGeneric contains 2, the debugger chooses CharSwap. In addition to the changes in the symbol table generation sketched above, debugger commands must also be changed to cope with generics. They have to be generalized and new display formats are necessary. For example, the user should be able to ask for the actual parameters or variables of a generic instance. This can be made possible by generalizing commands that allow to look at the parameters and locals of a routine to apply to generics as well: Parameters R Return the actual parameters of generic instance or subprogram R. Locals R Return the local variables of generic instance or subprogram R.
10
The notation for a source location must also be generalized because any source location might denote one or more instances of a generic. We solve this by prefixing a source location with the name of a generic instance. For example the command Break IntSwap.B.5 sets a breakpoint at source line B.5 of the generic instance IntSwap. If a source location is not qualified by the instance name, but points to the source code of a generic, then all current and future instances are denoted. For example, Break 5 sets a breakpoint at source line B.5 at all - current as well as future - instantiations of EXCHANGE. This means that the debugger, after consulting the source mapping, sets breakpoints at target locations T.0 and T.14. If a breakpoint occurs at one of the target locations, say T.0, the debugger consults the target mapping and determines source location B.5. Then it compares the virtual frame table index with CurrentGeneric to determine whether the breakpoint occurred in procedure IntSwap or in CharSwap.
4. Dynamic Abstractions In this section we introduce the notion of a dynamic abstraction to manipulate names from several names spaces that are not necessarily visible at the same time in the Ada program. Dynamic abstractions are manipulated by a visibility list (section 4.2) and by search modes (section 4.3). We demonstrate how dynamic abstractions can be used for dealing with separate compilation (section 4.4) and overloading (section 4.5).
4.1. Why Dynamic Abstractions? The meaning of the occurrence of an identifier at a given place in the text is defined by Ada’s visibility and overloading rules. From user studies we have conducted with KRAUT, it seems to be clear that users have a different notion of visibility when debugging. Instead of static scope rules they often apply dynamic scope rules. Users often refer to locals of routines that are currently not visible with respect to the scope rules of the programming language. This hypothesis is supported by experiments described in [Bruegge, 1985]: Violation of scope rules are used if they are provided by the debugger. There is another aspect where the violation of the visibility rules at debug time is important, namely abstract data types. This has not been so problematic in languages like Pascal, which do not support abstract data types but it becomes a problem in Ada. Ada’s package concept encourages users to write programs as a set of hierarchical levels or as a set of abstract data types each of them implementing a certain abstraction and hiding its implementation details from the rest of the system. However, the levels of abstraction composed at design or implementation time are usually not helpful when debugging a faulty computation. While debugging, the programmer is simultaneously the implementer as well as the user of an abstraction. Even if they are using an abstraction, they would like to have a look inside it, to make sure the body is a correct realization of the specification. Thus we argue that a view across the abstractions boundaries maintained by the Ada program is often needed during debugging. We call such a view a dynamic abstraction. Dynamic abstractions are useful to check a certain hypothesis where one might simultaneously have to refer to variables defined in several package bodies.
11
In addition to superimposing user defined abstractions, dynamic abstractions also permit the violation of predefined language abstractions such as types and the operations defined on them. To determine whether an abstraction is correctly implemented or used, a view of a type in terms of its underlying representation is often very useful. One might argue, that a high level source language debugger should not provide any possibility at all to violate the rules imposed by the language. For example, it should not be possible to assign an integer to a boolean, write an integer as a set, etc. We take a different attitude. The structure of the program is a design time property, typing and scope rules of a programming language are compile time properties and none of these are debug time properties. In fact, we maintain that when a program is faulty, strictly obeying structural rules or rules of the programming language obstructs the user from finding the bug. The debugger must provide for greater flexibility and relaxation of the language rules. Design abstractions and language abstractions should be seen as one possible set of dynamic abstractions at debug time. Other dynamic abstractions can be specified by the user .
4.2. Visibility List A consequence of dynamic abstractions is the relaxation of the compile time rules, in particularly the visibility rules for identifiers. In Ada programs the user will generally encounter a large name space, especially when debugging programs that contain context clauses, that is, they import library packages. Searching the symbol table in such a case might actually be confusing, because it contains packages that are imported without the explicit knowledge of the user. Furthermore, the user often has some idea in which package the variable is located, and a search through the whole name space might not only be confusing but also very time consuming. Thus it would be preferable if the user could give the debugger some directions for the search to make it more manageable and more efficient. In more concrete terms, the situation we want to model is where a programmer would like to inspect a big program listing but has only a limited desk space available. The complete listing does not fit on the desk and the programmer must use a technique to make only those aspects of the program visible that are of concern to the current debugging problem. In practice this is generally done by putting the irrelevant pages aside and keeping only the important pages on the desk. Abstractions maintained by the program are usually of no concern in such a situation. Of course, during the debugging session the view of what constitutes an irrelevant page changes very often and the programmer has to leaf through many pages, changing their visibility status depending on his current needs. To model this scenario with a debugger we introduce the notion of a visibility list and operations for its manipulation. From the user’s point of view the visibility list is the set of compilation units that are of concern to him for the current debugging situation. From the implementer’s point of view the visibility list is an ordered list of symbol tables where each symbol table is the result of the compilation of a compilation unit. The visibility list is searched in sequential order, starting at the head of the list. In the following we introduce debugger commands that manipulate the contents of the visibility list and thus permit the user to manipulate the search order. In this section we discuss the visibility list and operations defined on it. The search can be further modified by so-called search modes introduced in section 4.3. The main intended use for visibility lists is to manage the name space of large complex Ada programs
12
being debugged by experienced programmers. For small programs, visibility lists are probably not very helpful, especially if the cost of making the whole name space available is negligible. Furthermore, because the visibility list permits the programmer to violate so many rules of the Ada language, the subset of the name space made visible by the visibility list might be quite confusing, especially to the naive user. Thus the Ada debugger must contain commands for managing simple name spaces and simple debug situations as well as complex name spaces and complicated debug situations. One name space that is often needed during debugging is the set of names that are statically visible as seen from the current program counter and as expected by the user. The statically visible name space can be opened by the command OpenStaticView
Enter all symbol tables of compilation units currently visible from the current point of execution applying Ada’s scope rules.
A situation which is also needed very often is to open all the symbol tables for routines currently on the runtime stack. This can be done by the OpenStack command. OpenStack Append all symbol tables containing symbolic information for each of the subprograms currently on the runtime stack to the end of the visibility list. Do not move symbol tables that are already in the visibility list. To make the use of these commands as simple as possible, they can be made part of a default profile that is automatically executed at certain specified events, for example whenever the client process is suspended. Other different views of the name space can be obtained by applying one of the commands described below. Each of these commands take a name N denoting a compilation unit and an optional qualifier SPECS or BODY, which permits the debugger to distinguish between the user’s view and the implementer’s view of the name space of N. SPECS denotes the specification parts of all packages of N and BODY specifies the body parts of all packages of N. If the qualifier is omitted the whole name space of N is denoted. Open [SPECS|BODY] N If N is already in the visibility list move it to the top. Otherwise insert the symbol table for N at the head of the visibility list. If N = ’*’, then add all symbol tables to the visibility list and make the specifications, body parts or both visible. For example, Open SPECS * makes all the specifications of the program visible. Close [SPECS|BODY] N If N is not in the visibility list do nothing. Otherwise, if SPECS or BODY is specified, make the specification or the body of compilation unit N invisible, respectively. If no qualifier is specified, remove compilation unit N from the visibility list. Close SPECS * removes all specifications from the visibility list. Close BODY * makes the name space of all bodies of the program invisible. The command Close * empties the visibility list. Symbol tables of compilation units are not added to the visibility list if the user has not issued an Open, OpenStack or OpenStaticView command. In particular, if a compilation unit N contains some use clauses the corresponding package declarations are not automatically made visible when N is opened. The underlying assumption is that packages from a library are generally well debugged and don’t have to be present in the visibility list. If they are needed, however, they can be dealt with by the OpenTransitive
13
and CloseTransitive commands. OpenTransitive [SPECS|BODY] N Execute Open [SPECS|BODY] N. Then for each package mentioned in a context clause (use or with) in N open the corresponding compilation unit. This is done recursively until there are no more new clauses. If N = ’*’, then the command is the same as Open *. CloseTransitive [SPECS|BODY] N Execute Close [SPECS|BODY] N. Then for each context clause in N , close the compilation unit containing the package mentioned in the clause. This is done recursively until there are no more new context clauses. CloseTransitive * is the same as Close *. The visibility list commands have to be supported by adequate symbolic information generated by the Ada compiler. In particular, the debugger must be able to distinguish between specifications and bodies of a compilation unit as easily as possible. This can be achieved by adding this information to the data table.
4.3. Search Modes In Ada, a potentially visible declaration is any declaration that occurs immediately within the visible part of a package. They can be made visible by a use clause. However, the Ada Reference Manual states that potentially visible declarations are not visible in the following cases: • If the place considered is within the immediate scope of a homograph of the declaration. • Conflicting names: Two potentially visible declarations with the same identifier are not visible unless one of them is either an enumeration literal or a subprogram declaration. For example, let us assume we are debugging the program fragment in figure 4-1. Then the name V is package D is T,U,V: Boolean; end D; procedure P is package E is B,W,V : Integer; end E; procedure Q is T,X: Real; Use D,E; begin -- Body of procedure Q end Q; begin .... end P; Figure 4-1: Ada’s Visibility Rules illegal inside the body of procedure Q according to Ada’s visibility rules. D.V or E.V must be used instead. However, it would be legal if we "move" into package D. Again, we regard these rules as compile time rules that are not well suited for debugging. From the analysis of the user protocols we know that debugger users frequently move the point of inspection - which is different from the program counter - in
14
the program [Bruegge, 1985]. Furthermore they avoid prefixing and rather move to an inspection point where they can use short names. Thus an Ada debugger should not follow the Ada visibility rules and we introduce the notion of a search mode instead. The user can specify one of three search modes: SearchOne The visibility list is searched from top to bottom and when the first name is found it is printed. SearchCompilationUnit The visibility list is searched from top to bottom. When the first match is found, the compilation unit is searched completely and all matches found in this compilation unit are printed. SearchAll The whole visibility list is searched and the set of found identifiers is printed. We illustrate these search modes with an example. Let us assume we have written the following Ada program fragment in a compilation unit CU: procedure R is package TRAFFIC is type COLOR is (RED, AMBER, GREEN); ... end TRAFFIC; package WATER COLORS is type COLOR is (WHITE, RED, YELLOW, GREEN, BLUE, BROWN, BLACK); ... end WATER COLORS; If we look for the name COLOR we could have the following situations: 1. If CU is not on the visibility list, COLOR will not be visible to the debugger. 2. If we set the search mode to SearchOne and CU is on the visibility list, then the debugger returns the definition of COLOR in the TRAFFIC package. 3. If we set the search mode to SearchAll and CU is on the visibility list, then the debugger returns both definitions of COLOR.
4.4. Separate Compilation Ada’s separate compilation feature introduces two problems. One problem is that if a program consists of several compilation units the whole symbolic information of the program is no longer generated at the same time. Symbol tables must be generated separately for each compilation unit and thus an Ada debugger has to cope with the problem of multiple symbol tables. We discuss this problem in section 4.4.1. The other problem is that separate compilation units introduce a large name space which is only partially created by the user, especially if packages are imported by context clauses. When debugging users are not necessarily interested in having this large name space available. However, they might be interested in names which cannot be made visible simultaneously as far as the language rules are concerned. In section 4.4.2 we show how this can be done by means of the visibility list. 4.4.1. Multiple Symbol Tables With the symbolic information being generated at different times in several symbol tables the physical relation between symbol tables and target process becomes a problem. Existing Pascal debuggers are generally based on integrated symbol tables, that is, the symbol table is part of the runfile of the target.
15
PasDDT [Hisgen, 1981], for example, expects the compiler to load symbol information together with the runfile if the program is compiled with debug switch. The advantage of an integrated symbol table is fast response time because direct memory access to the symbolic information can be used. There is also no need to use the file system for accessing the symbol table, which means that the debugger does not have to rely on the file system. Integrated symbol tables have several disadvantages. Depending on the programming style and other factors, runfiles containing symbolic information can be significantly larger than the virgin runfile [Barbacci, 1985b]. This results in the commonly practiced style of distinguishing between the debugging version (debugging information included) and the production version (all debugging information stripped off) of a program5 which we do not advocate. Another disadvantage of integrated symbol tables is that they can influence the paging behaviour of the system. For example, timing errors in the target process might have a smaller chance of being detected when frequent symbol table access causes the enlarged runfile to be paged in a different manner than the virgin runfile. And worse, sometimes the enlarged runfile might be just too large to fit into the available file system space. Separate symbol tables have several advantages and these show up especially in the context of a Ada debugger. The separate compilation feature encourages the compiler to keep the abstract syntax tree of the specifications of compiled programs beyond the compilation time. This is of advantage, for example, when a package that has not been changed after its last compilation is imported by another program. In this case the compiler can use the syntax tree instead of scanning the source text again, speeding up the compilation. If we allow the debugger to have read access rights to the abstract syntax tree, no extraneous symbol table has to be produced (as was usually done for Pascal debuggers). This has several advantages. First, avoiding the generation of the (extraneous) symbol table reduces the compilation time. Furthermore the size of the runfile of the target process is the same no matter whether the user is debugging or not. Third, if the symbol table is not part of the address space of the target program, it can be kept on a remote file system. This is of advantage in disk space limited environment such as personal workstations6. Fourth, it allows the protection of symbolic information on the file system level making unauthorized access to the symbolic information impossible. Copyrighted or otherwise protected programs can be released into "hostile" environments and still symbolically debugged if necessary. One could argue that with the introduction of separate symbol tables the number of file accesses has to increase and the response time of an interactive debugger slows down. However, measurements done during debugging sessions of programs written in a Pascal dialect supporting separate compilation revealed that generally less than 0.5% of all symbols were accessed during debugging sessions [Bruegge, 1985]. Furthermore symbolic accesses seem to follow a locality principle: Once a name is accessed in a certain compilation unit, the number of accesses to names defined in the same compilation unit is significantly higher than the number of requests for names in different compilation units.
5 Hoare has compared this practice with swimmers who try to learn swimming on the beach wearing life vests and then take their life vests off as soon as they go into the water. 6
Network transparent file system access could be used to add the remote directory to the local file search list of the debugger.
16
4.4.2. Manipulation of the Visibility List In the following we show how the notion of a visibility list can be applied with advantage to a set of separately compiled units. To make the discussion more concrete, figure 4-2 contains an Ada program consisting of 3 compilation units called A, B and C. -- COMPILATION UNIT A --------------------1 procedure TOP is 2 3 type REAL is digits 10; 4 R,S : REAL := 1.0; 5 6 package FACILITY is 7 PI: constant:= 3.14159; 8 function F(X: REAL) return REAL; 9 procedure G(Y,Z: REAL); 10 end FACILITY; 11 12 package body FACILITY is separate; 13 14 begin -- TOP 15 FACILITY.G(R,S); 16 end TOP; -- COMPILATION UNIT B --------------------1 separate (TOP) 2 package body FACILITY is 3 function F(X: REAL) return REAL is 4 begin 5 F := X*2; 6 return F; 7 end F; 8 9 procedure G(Y,Z: REAL) is separate; 10 end FACILITY; -- COMPILATION UNIT C --------------------1 with TEXT IO; 2 separate (TOP.FACILITY) 3 procedure G(Y,Z: REAL) is 4 begin 5 R := Y +Z; 6 end G; Figure 4-2: Example program: Separate Compilation Let us assume we are debugging this program and the visibility list is initially empty. If we execute the command OPEN A, the visibility list contains A (Specs, Body)
[Head=Tail]
Thus all the names declared in compilation unit A such as R, S, PI, etc, are visible for the debugger. If we execute the command Close *, the visibility list is empty again. The command OpenTransitive A fills the visibility list with A (Specs, Body) B (Specs, Body) C (Specs, Body)
[Head] [Tail]
17
which makes all the symbols of all symbol tables visible. Close SPECS A changes the visibility list into A (Body) B (Specs, Body) C (Specs, Body)
[Head] [Tail]
which makes all the symbols defined in the specification of package Facility invisible. Thus the variable PI as well as the specification of functions F and G are not accessible. However, F and G are still known, because their bodies are accessible in the compilation units B and C, respectively. F can be made invisible by the command Close BODY B: A (Body) B (Specs) C (Specs, Body)
[Head] [Tail]
Note that the variables R and S in compilation unit A can only be made invisible if the whole compilation unit A is removed from the visibility list.
4.5. Overloaded Identifiers Ada’s overloading rules are complex and a full implementation puts quite a burden on the implementer of the debugger. However, the overloading rules might not always be that useful at debug time. As we have already argued above, the user of a debugger usually does not apply the notion of a scope as strictly as the compiler. We hypothesize that this is also true for overloaded identifiers. Of course, when writing expressions containing overloaded operators the user most probably expects the operators to be resolved exactly in the way they were resolved at compile time. However, the user is also often interested in all instances of a certain name, not just the instances that are visible according to the current scope and overloading rules. Thus we regard the overloading rules as compile time rules that can be overridden at debug time by means of the visibility list described in section 4.2. If a name is overloaded the search modes can be used to return a list of symbols describing one or all instances of the name and ask the user for more precise information to determine the meaning. This can be done by pointing or by some other naming mechanism. Our approach results in a requirement for the compiler builder. To return the list of all overloaded instances of a certain identifier as fast as possible, the data table should allow fast access to all overloaded identifiers. This can be done by representing the name spaces as ternary trees where all overloaded names descend from the same node, a representation employed by the Spice Ada compiler [Barbacci, 1985a].
5. Tasking Helmbold and Luckham [Helmbold 85] propose a debugging facility for the detection of deadlocks and blocking errors of Ada programs containing tasks. The facility is built on the notion of the tasking state of an Ada program. A tasking state of a program is the set of tasks that have been activated by the program, their statuses and associated information. A tasking state is described without referring to the name space of the client program, that is it is independent of the application. Unfortunately the facility is not adequate for many debugging situations. It does not provide the ability to specify the execution behaviour in terms of the abstractions employed in the application. A command like "Run the program until 1000 tasking statements have been executed" does not describe a specific debugging situation as well as a command "Run the program until an entry call Produce is followed by an
18
entry call Consume". The facility also does not provide a way to filter the output produced during the execution. However, when debugging multiple processes the output produced can be overwhelming. Finally the facility does not provide for any corrective action to be taken once a certain situation is recognized. ([Bruegge, 1983a], [Bruegge, 1985]) are more fitted as a debugging facility for debugging Ada tasks. PATHRULES is a language based on the production system paradigm. A path rule consists of two parts: An event recognition part and an action part. The language for the event recognition part is based on predicate path expressions [Andler, 1979] and permits the description of the state, operational and communications aspects of single as well as multiple process systems in a concise way. The action part specifies the actions to be performed when the execution of the target process matches the execution specified by the event recognition part. PATHRULES
The following example shows how to set a distributed breakpoint in an Ada fragment employing tasks. The fragment defines a buffering task B for a producer task P and a consumer task C and is shown in figure 5-1. -- Producing task P: loop ... B.Write(char); ... end loop --Consuming task C: loop ... B.Read(char); ... end loop
--Buffering task B: loop select when count < PoolSize => accept Write(fCh: in Character) do ... or when count > 0 => accept Read(fCh: out Character) do ... or terminate end loop Figure 5-1: Ada Tasking Example To set a breakpoint after P has called the entry routine Write with Char= ’B’ and when B is about to accept it, we write the following path rule: PATHRULE DistBreak GPE: P:B.Write!R{Char=’B’} ... B: B.Write!A{Char=’B’} MATCH: Suspend P,B END DistBreak
19
This definition defines a path rule with the name DistBreak. The event recognition part - prefixed by the word GPE - contains a generalized path expression that specifies the occurrence of a composite event consisting of two events. The first event is described by "P:B.Write!R{Char=’B’}". It matches the execution when the entry routine Write of task B is requested7by task P and the variable Char has the value ’B’. The second event is described by "B:B.Write!A{Char=’B’}". It matches the execution when the entry routine Write in task B is about to be activated with the actual parameter Char=’B’. The sequential operator "..." specifies that the composite event described in the path rule is only matched by the execution if the two events occur in sequential order, that is P requests the execution of Write before B enters the execution of Write8. No other execution path would be matched. The action part of the path rule specifies that the tasks P and B are suspended as soon as the execution matches the event specified in the rule. The Suspend command is described in section 5.1. Note that Ada’s semantics for rendezvous ensures that the calling task P is suspended until the corresponding accept statement in B is executed. Naturally, this example does not describe all the possibilities of using PATHRULES. PATHRULES are an adequate language to describe many other aspects of debugging Ada [Bruegge, 1985]. In the remainder of this section we concentrate only on a set of Ada specific commands that can be used in the action part of a path rule to debug and manipulate Ada programs containing tasks. First, in section 5.1, we describe a set of general commands that we consider useful in the context of debugging Ada tasks. Because task debugging experience is still quite limited, it is highly probable that this set of commands does not cover all possible debugging situations. We argue that this problem can be alleviated by the ability to call routines of the target program. In general, this is already possible in PATHRULES. However, many task specific manipulation routines will be defined in the runtime system of the language implementation. Thus in section 5.2 we propose to extend PATHRULES to call routines defined in the runtime system as well as in the target program itself.
5.1. General Commands Ada’s semantics of tasks poses several problems when debugging Ada programs. In the following we describe these problems and show how to circumvent them. Ada’s task objects are constants. At debug time, however, it might be necessary to replace a task by another one. For example, tasks can proceed in parallel and make the execution of the target process nondeterministic. To be able to make a debugging session deterministic, it might be desirable to replace a nondeterministic task by a deterministic one (such as a test driver). Another example where task replacement might be necessary is when a task is hung and a correctly functioning one is available. The command we propose is
7 In PATHRULES the occurrence of a path function can be monitored at three different occasions, namely when the path function execution is requested, activated or terminated. This is indicated by postfixing the name of the path function with an event qualifier !R, !A or !T, respectively. 8 PATHRULES offers three operators to specify the sequence of events, the ";" (direct call), ";;" (indirect call) and "..." (followed by) operators. The event "A;B" matches any execution where subprogram A directly calls subprogram B. The event "A;;B" matches any execution where subprogram A is still active when B is called, but A is not necessarily the caller. And "A...B" matches any execution where a call to A is some time later followed by a call to B, but A is not necessarily active at that time. For more details see [Bruegge, 1985].
20
Replace [ALL] T1 T2 Replace replaces the task T1 by the task T2. If ALL is specified, all tasks dependent on T1 are deleted. T2 starts its execution as if it has been called by the program. Ada provides queues associated with entry routines that follow a certain server discipline. These queues are not directly visible to the user. At debug time, however, we might want to change the queueing discipline or the contents of the queues. Thus the debugger should provide commands that permit the manipulation of entry queues. The commands we propose are AddQueue S T N Add task T behind N’th entry of the queue associated with subprogram S. ClearQueue S Clear the queue associated with subprogram S. Ada’s definition of the termination of a task is also not very useful at debug time. For example, a task might be hung up because of another task and one would like to get rid it so that the hung one is able to continue its execution. If the second task has dependent tasks, the user might want to kill these or not. To manipulate the order of execution and termination of tasks we propose the following commands: Start T Start the set of tasks T = T1,...,Tn. If a task Ti is already running, ignore the command for that task. Start * starts all currently defined tasks. Suspend T1,...,Tn Suspend the set of tasks T1,...,Tn. If a task Ti is already suspended by a previous Suspend command, ignore the command for Ti. Suspend * suspends all currently active tasks. Note that Suspend means suspension of the task on the operating system level, not on the language level. In Ada a task T is suspended if it is waiting for a rendezvous but the other task is not yet ready for the rendezvous. Such a task would normally resume the execution if the conditions for the rendezvous are fulfilled. However, if the user has issued a Suspend T command, the task would not resume the execution even if the rendezvous can take place. Resume T Resume the set of tasks T = T1,...,Tn that were suspended by a previous Suspend command. If a task Ti is already running, ignore the command for Ti. Resume * resumes all tasks that were suspended by a previous Suspend command. Kill [ALL] T1,...,Tn Terminate each of the tasks T1,...,Tn, if they are not yet terminated. If ALL is specified, all tasks depending on T1,...,Tn are also terminated, otherwise they are not. Kill * terminates all tasks and depending tasks. Priorities of tasks can be set in Ada with the PRIORITY pragma and are fixed at runtime. The selection of the priorities, however, does not always support all possible executions desired during debugging. To change the priority of a task we propose the command SetPriority N T1,...., Tn Change the priority of the set of tasks T1,...,Tn to N.
5.2. Calling Subprograms in the Runtime System As mentioned before, there is not much experience in debugging Ada tasks, and thus it is not clear whether the functionality just described in connection with the PATHRULE language is sufficient. We therefore propose that subprograms in the Ada runtime system that modify impending tasks can also be
21
called in the action part of a path rule. By providing routines that can be called instead of built in commands, the debugger can be customized to the specific application being debugged. We think, that this approach is viable as long as nobody knows what a good set of commands for debugging tasks is. In fact, because of its flexibility and customizability it might be even useful after such a basic set has been determined. The runtime subprograms can be routines used by the runtime system to implement the Ada language as well as routines that modify tasks but are never called directly, that is, routines that are not necessary for the implementation of the Ada language. In fact, several of the commands described above might be available as routines implemented in the runtime system. The ability to call subprograms creates several problems for the builder of the debugger. Symbolic information of the runtime system routines must be made visible for the debugger to set breakpoints, intercept calls or execute the runtime routines. In particular, the calling convention for the routines in the runtime system should be the same as the one for the subprograms of the Ada program. This causes problems if the runtime system is written in a different language. In this case an Ada interface and the associated symbolic information must be provided for all the runtime system routines and must be made visible to the user and the debugger, respectively. Another problem is that the environment of the call might not be the same as during normal execution. In particular, if the subprogram is nested, the enclosing subprogram might not be on the runtime stack and the subprogram might refer to nonexisting objects. For this reason we disallow the call of any nested subprogram at debug time. Even if we disallow nested subprogram calls, subprograms might refer to global variables which are not yet initialized because the subprogram is called out of order. If the subprogram is defined in the Ada program, we can assume that the user is able to deduce any preconditions for the call. However, this might be impossible for the subprograms of the runtime system. For this reason the implementer of the runtime system must specify all the preconditions for all the exported subprograms of the runtime system as a help for the user. Even with the restrictions mentioned above, calling a subprogram might result in an unexpected error which the user would like to undo. Thus we propose that the debugger provides a command that neutralizes the effect of any subprogram call issued during a debugging session: Abort R
Restore the state of the program to the state it had before the subprogram R was executed.
To support such a command, the debugger must be able to memorize the debug state before the subprogram is executed. This could be done by saving the state of the target process in a core dump before executing the subprogram. If this is too costly, an additional parameter to Abort could indicate whether to restore the state only partially. For example, a command Abort StackAndHeap R might restore the state to the old run time stack and heap before R was called, but it expects the user to "repair" the global state by himself9.
9 The Unwind command in KRAUT, for example, removes only the activation records from the run time stack that are a result of the subprogram call. It does not restore activation records of other currently suspended subprograms. Neither does it restore the heap or global variables. However, despite this limited capability the Unwind command is used quite often.
22
6. Exceptions The Ada language defines a set of exceptions such as Constraint Error, Program Error, etc. Each of these language defined exceptions has a corresponding handler in the runtime system. If the language defined exception occurs, this handler is called, prints out some predefined error message and aborts the execution of the program. User defined exceptions define their own handler. Handling exceptions in the language defined manner is not necessarily useful at debug time, especially if exceptions indicate program errors. If a debugger is present, the user should have the choice as to whether the actions defined by the exception handler are executed or whether a debugger is invoked instead. The Ada language does not define what happens when the execution of an Ada program is terminated because of an unhandled exception. Again, if a debugger is present, the debugger should be called for any unhandled exception, that is, the debugger should be regarded as the final exception handler for any exception not handled by the target process or the runtime system. For example, a division by zero does not necessarily mean that the user wants to abort the current execution. At debug time the user might want to explore what happens if the result of the division is patched with a defined value. Of course, when proceeding from an uncaught exception the state of the target process is undefined. But in many cases the user is able to patch the state into a defined state before proceeding. Cohen&Cohen propose a debugging facility for dealing with exceptions [Cohen, 1985]. Their proposal introduces exception-related breakpoints, facilities for allowing the user to raise and dismiss exceptions and clean-up operations. We intend to provide the functionality described in their paper. For example, the Ada debugger provides commands such that the user can raise or dismiss an exception: Raise E
Raise exception E.
Dismiss E
Dismiss exception E.
We extend Cohen’s proposal and suggest using the PATHRULES language for debugging exceptions. We propose to make use of the environment variable %ExceptionReason to describe the reason for the exception10 and three new path functions for describing events that deal specifically with exceptions: RaisedException This path function is executed when an exception is raised. PropagatedException This path function is executed when an exception is propagated outside of a subprogram. UnhandledException This path function is executed when there is no handler associated with the raised exception. Event qualifiers can again be used to filter out unimportant occurrences of exception related events. For example, the event RaisedException!R denotes the situation when an exception is about to be raised. Thus to implement a breakpoint at the raise sites of all exceptions we write the path rule
10
In PATHRULES, environment variables are prefixed by a percent sign (%) to distinguish them from names from the client name space.
23
PATHRULE BreakAtRaise GPE: RaisedException!R ACTION: Halt END To break only at the occurrence of exceptions of type Constraint Error we qualify the path function RaisedException!R with the predicate {%ExceptionReason= ’Constraint Error’}: PATHRULE BreakAtRaise GPE: RaisedException!R {%ExceptionReason = ’Constraint Error’ ACTION: Halt END The path function PropagatedException is useful when an exception is propagated into or out of a specified subprogram and the user might want to dismiss the exception or raise a different exception. For example, if we would like to dismiss an exception UnknownCharacter raised by a subprogram Write, but only if Write is called from the subprogram Display, we could write the following path rule: PATHRULE Dismiss GPE: Display!A;Write!A; PropagatedException!R {%ExceptionReason=’Un ACTION: Dismiss %ExceptionReason END This path rule fires when the exception UnknownCharacter is raised in Write and Display is active. Because the action part of the rule dismisses the exception, the subprogram Write will not be aborted. To catch all unhandled exceptions of an Ada program we could write the path rule PATHRULE CatchAll GPE: UnhandledException Action: Halt END To support debugging of exceptions as outlined above, the compiler must maintain a symbol table that contains the names of all exceptions defined in the program and all exceptions defined in the Ada language manual. Furthermore, the runtime system must initialize the environment variable %ExceptionReason with the reason for the exception every time an exception is raised.
7. Implementation We are currently implementing the proposals of this paper by extending KRAUT to debug Ada programs compiled by the Spice Ada compiler [Barbacci, 1985a]. KRAUT is a remote, source level symbolic debugger for a Pascal dialect called Perq Pascal [PQS, 1984]. It is running on a personal workstation supporting multiple windows and a network environment with network transparent file system access. The current status of our effort is as follows: KRAUT can deal with initialized declarations as proposed in this paper. Visibility lists and the ability to call user defined subprograms are also implemented. First experiences with the visibility list support our argument that users do not always follow the language rules at debug time. Especially users of programs with large name spaces make frequent use of visibility lists. PATHRULES have been implemented to deal with unhandled exceptions. KRAUT
11
cannot yet deal with generics, inline pragmas11, overloaded identifiers and tasks. In addition,
The inline pragma is also not supported by the Spice Ada compiler.
24
KRAUT
does not support records, arrays, enumerated types and constants.
8. Conclusion We have shown how a debugger based on Pascal can be converted into an Ada debugger and discussed the problems encountered in the process. Several Ada features can be dealt with by making a clear distinction between compile time and debug time. Pascal did not provide any abstractions beyond the procedure level. With Ada a new programming style emerges that promotes the use of abstractions. We have argued that abstractions that are useful at design or compile time are not necessarily useful at debug time. We proposed the introduction of the visibility list to manage the visibility of the name space of an Ada program and showed how it can be used for separately compiled programs. Many other language rules are not necessarily useful at debug time, for example the rule for resolution of overloaded identifiers or Ada’s exception handling. The introduction of the visibility list has two advantages. First, it allows the user to make the debugging name space of large complex programs manageable because the size can be kept as small or as large as desired. Second, a small visibility list yields faster search times, which in turn leads to better debugger response times. Other Ada features required additions to the symbol table produced by the compiler for the debugger. These included initialization at declaration time, the inline pragma and Generics. For debugging tasks and exceptions we proposed the use of PATHRULES. Furthermore we advocated the ability to call runtime system routines from within the debugger. The main advantage of calling subprograms is its flexibility compared with built in commands.
9. Bibliography [Andler, 1979]
S. Andler, "Predicate Path Expressions: A High-Level Synchronization Mechanism", Ph.D. Thesis, Department of Computer Science, Carnegie Mellon University, 1979.
[Ball, 1982]
J.E. Ball, M.R. Barbacci, S.E. Fahlman, S.P. Harbison, P.G. Hibbard, R.R. Rashid, G.R. Robertson, and G.L. Steele: "The SPICE Project", Computer Science Research Review 1980-1981, Department of Computer Science, Carnegie-Mellon University, pp: 5-36.
[Barbacci, 1985a]
M.R. Barbacci, T.D. Newton, R.G. Stockton: "The Ada+ Front End and Code Generator", Proceedings of the 1985 International Ada Conference: Ada In Use, Paris, France, May 1985.
[Barbacci, 1985b]
M.R. Barbacci, personal communication.
[Bruegge, 1983a]
B. Bruegge, P. Hibbard "Generalized Path Expressions- A High Level Debugging Mechanism", Journal of Systems and Software, Vol.3, 265-276, 1983.
[Bruegge, 1983b]
B. Bruegge, "User Manual for KRAUT - The Interim SPICE Debugger", Technical Report RTL-83TR-008, Siemens RTL, Princeton, November 1983.
[Bruegge, 1985]
B. Bruegge, "Adaptability and Portability of Symbolic Debuggers", Ph.D. Thesis, Department of Computer Science, Carnegie Mellon University, CMU-CS-85-174, September 1985.
[Helmbold, 1985]
D. Helmbold, D. Luckham, "Debugging Ada Tasking Programs", Computer, IEEE, 47-57, March 1985.
[Hennessy, 1982]
J. Hennessy, "Symbolic Debugging of Optimized Code", ACM Transactions on Programming Languages and Systems, Vol.4, No. 4, 323-344, July 1982.
25
[Hisgen, 1981]
A. Hisgen, "Pascal on the DEC System 10 at CMU", Chapter 3: PasDDT, June 1981.
[PQS, 1984]
Perq Systems Corporation, "Perq Pascal User Manual", Pittsburgh, 1984.
[Wall, 1985]
D. Wall, A. Srivastava, F. Templin, "A Note on Hennessy’s: Symbolic Debugging of Optimized Code", ACM Transactions on Programming Languages and Systems, Vol.7, No. 1, 176-181, January 1985.
[Zellweger, 1983]
P. T. Zellweger, "An Interactive High-Level Debugger for Control-Flow Optimized Programs", Technical Report CSL-83-1, XEROX Corporation, Palo Alto Research Center, January 1983.
[Zellweger, 1984]
P. T. Zellweger, "Interactive Source-Level Debugging of Optimized Programs", Ph.D. Thesis, University of Berkeley, Department of Computer Science. Available as Technical Report CSL-84-5, XEROX Corporation, Palo Alto Research Center, May 1984.
i
Table of Contents 1. Introduction 2. Symbol Table Definitions 3. Symbol Table Extensions
0 1 2
3.1. Initialization 3.2. Inline Expansion 3.3. Generics
2 4 7
4. Dynamic Abstractions 4.1. Why Dynamic Abstractions? 4.2. Visibility List 4.3. Search Modes 4.4. Separate Compilation 4.4.1. Multiple Symbol Tables 4.4.2. Manipulation of the Visibility List 4.5. Overloaded Identifiers
5. Tasking 5.1. General Commands 5.2. Calling Subprograms in the Runtime System
6. Exceptions 7. Implementation 8. Conclusion 9. Bibliography
10 10 11 13 14 14 16 17
17 19 20
22 23 24 24
ii
List of Figures Figure 3-1: Figure 3-2: Figure 3-3: Figure 3-4: Figure 3-5: Figure 4-1: Figure 4-2: Figure 5-1:
Target Code for Subprograms X and Y Code Table for X and Y (sorted by source location) Program fragment using inline expansion Target code for Unit A and B (with inline expansion) Inline Table for unit A and B Ada’s Visibility Rules Example program: Separate Compilation Ada Tasking Example
3 3 5 6 6 13 16 18