reveals that some measures may decrease the flood damage, but may also ... Flood disasters cause massive losses of human lives and immense damage to the.
Weiler Resources Systems—Hydrological Risk, Management and Development (Proceedings o f symposium HS02b held during IUGG2003 at Sapporo, July 2003). IAHS Publ. no. 281, 2003.
115
Decision support system for flood control and ecosystem upgrading in the Red River basin M. J. BOOIJ Department The
of Civil
Engineering,
University
ofTwente,
PO Box 217,
7500 AE
Enschede,
Netherlands
m.i.booii@,ctw.u twente.nl
Abstract A decision support system (DSS) for the selection of a suitable combination of flood control and ecosystem upgrading measures was developed. This was achieved by carefully selecting the most appropriate model environment for the DSS. The hydrological, hydraulic and socio economic models within the DSS are constructed in a consistent way, taking into account the project objectives, characteristics of the measures, spatial and temporal scales and future scenarios. The developed DSS was applied to the Red River basin in Vietnam and China to evaluate a number of measures. This reveals that some measures may decrease the flood damage, but may also result in a decrease in total income and hence total revenues. The described results are an illustration of how measures can be selected in the DSS. More data collection and model calibration and validation are needed before employing the DSS for real flood management. Key words appropriateness; DSS; ecosystems; flooding; HBV model; Red River; scales
INTRODUCTION Flood disasters cause massive losses of human lives and immense damage to the infrastructure and economic activities in the Red River basin in Vietnam and China (e.g. Nghia, 2000). These disasters result not only from the climatological circumstances, but are also caused by human development. The ecosystem has been seriously disrupted by rapid population growth and by the uncontrolled development of industrial and urban centres. This has led to deforestation and changes in the ecosystem, which in turn have increased the flooding risk. The severity of the floods can be mitigated by adopting suitable measures for flood control and for preservation and sustainable upgrading of ecosystems. These measures should take into account the social, economical and ecological consequences. Short-term measures include flood diversion, rescue actions and prevention of unexpected dike breaks and inundation in important urban and industrial zones. Here, the emphasis is on the long term, with measures such as reforestation, the construction of reservoirs in upstream areas and a controlled development of urban and industrial centres. The objective is to develop and apply a system to support decisions concerning the selection of a suitable combination of measures, considering all important consequences. This objective is achieved by carefully selecting the most appropriate model environment for the decision support system (DSS). Next, the hydrological, hydraulic and socio-economic models in this DSS are constructed in a consistent way, taking into account the project objectives, characteristics of the measures, spatial and temporal scales and future scenarios. The developed DSS was used to evaluate a number of flood control and ecosystem upgrading measures. In
116
M. J. Booij
this preliminary assessment, scenarios were not taken into account. Finally, some conclusions are drawn.
DATA Meteorological, hydrological, hydraulic and socio-economic data from several sources were used (e.g. Vietnamese Hydrometeorological Forecasting Centre, Vietnamese Ministry of Agriculture and Rural Development, United States Geological Survey), mostly for the time period 1994-1998. The physical data have a daily resolution, while the socio-economic data have an annual resolution. The meteorological data included precipitation (for 28 stations) and évapotranspiration (30 stations); important hydrological and hydraulic data were discharges (9 stations) and water levels (9 stations); and socio-economic data include incomes, agricultural yields and flood damage (provincial level). Additionally, elevation, land use and geographical (e.g. river network) data, generally with a spatial resolution of 1 km, have been used to set-up and calibrate the different models.
DECISION SUPPORT SYSTEM Model environment choice The DSS should support decisions concerning the selection of a suitable combination of measures for flood and ecosystem management, considering all important consequences. The model environment for the DSS needs to be carefully selected, taking into account the objectives and application of the DSS. Therefore, the requirements and possibilities for the DSS model environment have been confronted with each other in order to find the most appropriate model environment. Important requirements for the model environment are spatial and temporal capabilities, different spatial and temporal scales, different interacting processes in space and time, flexibility, universality and user-friendliness. The model environments which were considered are third generation programming languages (e.g. Fortran), fourth generation languages (e.g. Matlab), geographical information systems (GIS, e.g. Arc View), combinations of existing models (e.g. the hydrological model HBV, the hydraulic model SOBEK, and an existing socio-economic model) and existing DSSs (e.g. RAMCO, see De Kok et al., 2001). Additionally, experts have been consulted for their opinions. The confrontation of requirements and possibilities did not yield one favourite model environment. However, it was concluded that three groups of model environ ments could be left out; third generation languages (problems with flexibility, presentation, etc.), combinations of existing models (different scales, interacting processes, universality) and existing DSSs (different scales, flexibility, universality). The choice between a fourth generation language and a GIS was further explored based on the literature (e.g. Theobald & Gross, 1994; Sharifi, 1999) and expert judgement. Most experts recommended the use of a GIS as a model environment, in particular PCRaster (see e.g. Wesseling et al., 1996), because of its spatial-temporal
Decision support system for flood control and ecosystem upgrading in the Red River basin
117
character. Therefore, PCRaster has been chosen as the model environment for the DSS. The main advantages of this model environment are the spatial-temporal character, the built-in capabilities, the flexibility and the possibility of constructing user interfaces appropriate for the model user. Van der Perk et al. (2001) describes a DSS built within the PCRaster environment.
Appropriate system scales The appropriate scales for the DSS are chosen, taking into account its objectives. In this respect, the terms flooding and ecosystem degradation, the possible measures and the decision variables, are of importance. Appropriate scale refers to all aspects of the spatial and temporal scale triplet (Blôschl & Sivapalan, 1995). For example, for flooding this implies a choice for the time step (temporal spacing scale), flood duration (temporal support scale), flood frequency (temporal extent scale), spatial resolution (spatial support/spacing scale) and research area (spatial extent scale). In the same way, scale aspects for ecosystem degradation, measures and decision variables should be chosen. A rough analysis reveals that the DSS should fulfil at least the following scale requirements: (a) temporal resolution: 1 day; (b) temporal extent: years to take into account the frequencies of extreme floods; (c) spatial resolution: may vary depending on the variability and importance of processes, e.g. the resolution in the downstream area should be finer than in the upstream one, because of the importance economic activities and consequently the flood damage modelling in the downstream area; (d) spatial extent: complete Red River basin (RRB) in Vietnam and China. Therefore, the DSS has a variable spatial resolution with a more coarse scale (5 km) for the complete RRB and a finer scale downstream (1 km). Booij (2003) has found an appropriate spatial scale of 10 km for a similar problem in a smaller river basin. The DSS simulates impacts of measures at a daily time scale for several years.
Model concepts The main components of the DSS are the integrated model system, the objectives and related measures, the scenarios and the database. These will be briefly described here, except the data base which has been dealt with in the Data section. The integrated model system is the representation of the natural and socio-economic system by proper hydrological, hydraulic and socio-economic models. This allows for a sensible evaluation of flood reducing and ecosystem upgrading measures. The complexities (processes, scales, formulations) of the different models should be balanced, i.e. it does not seem to be reasonable to combine a sophisticated hydrological-hydraulic model with a simple socio-economic model. The hydrological model is based on the concepts of the HBV model (Bergstrôm & Forsman, 1973) and applied to the complete RRB. The considerations, which have led
M. J. Booij
118
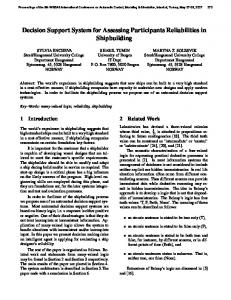
to the choice for HBV, are extensively described in Booij (2002). Only the relevant model concepts for the RRB are employed. The HBV model is a conceptual model of river basin hydrology which simulates river discharge using precipitation, temperature and évapotranspiration as input. The model consists of a precipitation routine, a soil moisture routine determining actual évapotranspiration and overland and subsurface flow, a fast flow routine representing stoim flow, a slow flow routine representing subsurface flow, a transformation routine for flow delay and attenuation, and a routing routine for river flow. For a detailed description see e.g. Bergstrom (1995). The hydraulic model is a conceptual river routing and inundation model and is employed in the downstream area. For this purpose, the downstream area is divided into several units, each of which is supposed to inundate when dike breaking or overtopping take place, dependent on the elevation and the amount of water available. The division is based on the location of the main structures (significant dikes, main roads) within the area. A set of dike attributes (height, quality) can be associated with each unit and compared with water depth in the adjacent river(s). The inundation will fill the lowest parts of the units and will gradually inundate the higher parts up to a level dependent on the amount of water available for inundation. It is not necessary to model the two-dimensional flow directly, because the daily time step used is much larger than the time scales of two-dimensional flow patterns. Most of the monodisciplinary socio-economic models seem to be too complex to be included into a DSS (e.g. Angelsen, 1999; Tachibana et al, 2001). Therefore, simplified socio-economic models have been used so far, e.g. in NELUP (O'Callaghan, 1996) and RAMCO (De Kok et al., 2001). Here, the socio-economic model is a conceptualization of the socio-economic flows, allowing for migration between the economic sectors based on net revenues and land use. The net revenues include incomes, costs and flood damage. Scenarios are exogenous processes which can not be influenced by stakeholders (e.g. farmers, government) within the socio-economic system or natural system. For example, they can be defined with respect to price development, population growth or climate change. In this preliminary assessment, scenarios will not be considered. Measures are usually related to the policy objectives and thus will be mainly flood reducing and ecosystem upgrading measures. The DSS represents the measures by means of changes in its system. Important possible measures in the RRB are dike heightening and strengthening, retention basins and reforestation. These measures are evaluated by means of their effects on the total net revenues in the RRB. Figure 1 shows the Red River basin and its delta with the evaluated measures.
RESULTS The observed and simulated daily discharge at Ta Bu (upstream area -46 000 km") and Son Tay (upstream area -144 000 km , 85% of RRB area) for the period 1994-1998 is given in Fig. 2. Although no thorough calibration procedure has been done yet, the discharge at Ta Bu is reasonably simulated (Nash-Sutcliffe coefficient -0.60, volume difference less than 5%). The discharge at Son Tay is less well simulated (NashSutcliffe coefficient -0.40, volume difference less than 5%) and in particular, peaks are overestimated. However, in this preliminary stage the observed pattern is sufficiently 2
Decision support system for flood control and ecosystem upgrading in the Red River basin
100°
101°
102°
103°
104°
105°
106°
107°
119
108°
Fig. 1 Red River basin at 5 km resolution between 20°N-26°N and 100°E-108°E, and the downstream deltaic part at 1 km resolution with locations of measures evaluated (black = Hoa Binh retention basin, shaded = reforestation, grey = dike heightening and strengthening) and discharge stations: (a) Ta Bu, and (b) Son Tay. (a) Ta
Bu
20000
15000
E>
10000
5000
1994
1995
1996
1997
1998
1997
1998
(b) S o n T a y 25000
20000
15000
o
10000
-
5000
1994
1995
1996
Fig 2 Observed and simulated discharge at Ta Bu (a) and Son Tay (b) for period 1994-1998.
120
M. J. Booij
represented by the simulated one. For other sub-basins similar results were obtained and a more extensive calibration will be performed in the near future, in particular by employing more data from the Chinese area. The simulated inundated areas for two floods (1994 and 1996) in the downstream part of the RRB in combination with the elevation pattern are shown in Fig. 3. Unfortunately, observed maps with inundated areas are not available yet, but a few will become available to check the simulated ones. Figure 3 obviously shows that in areas with relatively low dikes of poor quality, in combination with the low elevations, inundation takes place. The big 1996 flood even caused problems in the neighbour hood of the capital Hanoi. Besides flooding maps, more accurate information on dike height and quality are needed to improve this inundation simulation and hence the damage assessment. An important part of the socio-economic model is the damage modelling. Data on a provincial level (number of flooded houses, schools, surface area of lost agricultural production, etc.) were used to make a first estimate of the parameters in the damage function (a simple linear function based on inundation depth and land use). Figure 4 gives the incomes, flood damage, costs (e.g. for the construction of dikes or retention basins) and total revenues (= incomes-costs-flood damage) for five different combin ations of measures. It should be mentioned that these figures are very rough estimates, because of a lack of data and the preliminary stage of the socio-economic model. This will be adapted and improved in the remainder of the project. Figure 4 is primarily shown to illustrate the approach which will be used when selecting a combination of measures in the DSS. The measures with reforestation (increase of forest coverage from 42% to 62%) have a positive effect on the total flood damage, because of an increased storage in the river basin. However, due to decreased total incomes (e.g. rice area decrease forest area increase) the net revenues slightly decrease with reforestation. Remarkably, the construction of the retention basin Hoa Binh (capacity 6 Gm ) with an uncontrolled release of water after the flood even J
Fig. 3 Elevation pattern in downstream part of Red River basin and simulated inundated areas (black areas indicated with arrows) for 1994 and 1996 floods.
Decision support system for flood control and ecosystem upgrading in the Red River basin
121
Fig. 4 Indexes of average annual incomes, flood damage, costs and total revenues relative to the base scenario for five different measures (see Fig. 1, Hoa Binh with maximum release is controlled/spread release from retention basin).
increases the total flood damage. The measure with a controlled release of causes a substantial decrease in flood damage. Dike heightening and (construction) involves high costs, but can be very effective and is on the basis total net revenues the preferred measure. Obviously, other effects, such as acceptance and government policy can seriously alter these results.
water repair of the social
CONCLUSIONS The evaluation of a number of flood control measures in a DSS for the Red River basin revealed that some measures may have substantial (decreasing) effects on the flood damage, but may also result in a decrease in total incomes and hence total revenues. This illustrates how measures can be selected in the DSS, taking into account not only flood damage, but incomes and other costs as well. All combinations of measures can thus be systematically evaluated in order to find the most profitable combination in ternis of costs and benefits. Obviously, other methods such as multi-criteria analysis may be used in this evaluation as well. More data collection and model calibration and validation are needed in order to apply this DSS to the flood management in the Red River basin. Large uncertainties will complicate the distinction to be made between different measures. Similar decision support systems can be used for other river basins in the world, taking into account the relevant policy objectives, characteristics of possible measures, river basin characteristics and future scenarios.
Acknowledgements This study is part of the FLOCODS project which is funded under the EC contract no. ICA4-CT2001-10035 within the Fifth Framework Program.
REFERENCES Angelsen, A. ( 1 9 9 9 ) Agricultural expansion and deforestation: m o d e l l i n g the impact of population, market forces and property rights../. Dev. Econ. 5 8 , 185-21 8.
122
M J. Booij
Bergstrom, S. (1995) T h e H B V model. In: Computer
Models
of Watershed
Hydrology
(ed. by V. P. Singh), 4 4 3 - 4 7 6 .
Water Resource Publications, Highlands Ranch. Colorado. U S A . Bergstrom, S. & Foreman, A. (1973) D e v e l o p m e n t of a conceptual deterministic rainfall-runoff model. Nordic 147-170.
Hydrol.
Blôschl, G. & Sivapalan, M. ( 1 9 9 5 ) Scale issues in hydrological modelling: a review. In: Scale
Hydrological
Modelling
Issues
in
4,
(ed. by J. D . K a l m a & M. Sivapalan), 9 - 4 8 . Wiley, Chichester, UK.
Booij, M . J. (2002) A p p r o p r i a t e modelling of climate change impacts on river flooding. P h D T h e s i s , University of T w e n t e , Enschede, T h e N e t h e r l a n d s . Booij, M. J. (2003) Determination and integration of appropriate spatial scales for river basin modelling. Processes (in press).
Hydrol.
De Kok, .1. L., Engelen, G., White, R. & Wind, H. G. (2001) M o d e l i n g land-use c h a n g e in a decision-support system for coastal-zone m a n a g e m e n t . Environ.
Model. Assess.
6, 1 2 3 - 1 3 2 .
Nghia, T. T. (2000) Flood control planning for Red River basin, ln: Ecosystem
and Flood (ed. by K. D. N g u y e n ) (Proc. Int.
European-Asian W o r k s h o p Hanoi, June 2 0 0 0 ) , 2 4 6 - 2 5 6 . Inst, of M e c h a n i c s , Hanoi, Vietnam. O ' C a l l a g h a n , J. R. ( 1 9 9 6 ) Land Use: The Interaction of Economics, Ecology and Hydrology. C h a p m a n & Hail, London, UK. Sharifi, M. A. (1999) R e m o t e sensing and decision support systems. In: Spatial Statistics for Remote Sensing (ed. by A. Stein, F. van der M e e r & B . Gorte), chapter 14. Kluwer, Dordrecht, T h e Netherlands. Tachibana, T., N g u y e n , T. M. & Otsuka, K. ( 2 0 0 1 ) Agricultural intensification versus extensiftcation: a case study of deforestation in the Northern-Hill region of Vietnam. J. Environ. Theobald,
D. M . & Gross, M.
Computational
Environ,
D. ( 1 9 9 4 ) E M L : A m o d e l l i n g
and Urban Systems
Econ. Manag.
41, 44-69.
environment
for exploring
landscape
dynamics.
18, 1 9 3 - 2 0 4 .
Van der Perk, M., B u r e m a , J. R., Burrough, P. A., Giliett, A . G. & van der Meer, M. B . (2001) A GIS-based environmental decision support system to assess the transfer of long-lived radiocaesium through food chains in areas contaminated by the Chernobyl accident. Int. J. Geogt: Information
Sci. 15, 4 3 - 6 4 .
Wesseling, C. G., Karssenberg, D.-J., Burrough, P. A. & Van Deursen, W. P. A. ( 1 9 9 6 ) Integrating environmental m o d e l s in G I S : the d e v e l o p m e n t of a d y n a m i c m o d e l l i n g language. Trans. GIS 1, 4 0 - 4 8 .
dynamic