shape, and topology (Chapman et al., 1994), it has ... age (Chapman et al., 1994) using the preliminary ..... Toyota Motor Corporation and the Horace H. Rack-.
DECOMPOSITION-BASED ASSEMBLY SYNTHESIS OF STRUCTURAL PRODUCTS: PRELIMINARY RESULTS Kazuhiro Saitou Department of Mechanical Engineering and Applied Mechanics University of Michigan, Ann Arbor USA F. Arkin Yetis Department of Mechanical Engineering and Applied Mechanics University of Michigan, Ann Arbor USA
ABSTRACT An automated method for synthesizing assemblies of structural products is presented, where a complex structure obtained via structural topology optimization is decomposed into an assembly made of multiple members with simpler geometries. The method provides an efficient means to explore a large number of feasible decompositions prior to the detailed component design phase. First, a bitmap image of a structure obtained via structural topology optimization is transformed to a graph with the equivalent topology through the sequential application of image filters. Second, the structure is automatically decomposed into multiple structural members through the decomposition of the resulting graph to its subgraphs. Preliminary results of the decompositions of Mitchell’s truss like structures demonstrate the impact of decomposition to the overall structural stiffness and in-process dimensional adjustability of the resulting assembly. The results motivate the future development of automated optimal assembly synthesis based on the quantitative evaluation of product decompositions generated through the presented method.
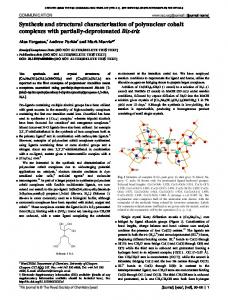
1 INTRODUCTION Many structural products such as automotive bodies are made of multiple components with relatively simple geometries decomposed from substructures of the products. Assembly synthesis refers to a process of decomposing an overall product into multiple components. Although may not be desirable from structural point of view, assembly synthesis is often inevitable since production of an entire product without decomposition is technically or economically infeasible. Figure 1 shows an example of the decomposition of an automotive body front consisting of the external panels (a hood and outer fenders) and the internal structures (inner fenders and a radiator support) that connect to the rest of the internal body frame. In industry, such decompositions are typically determined ad hoc prior to the detailed design of each component. Such an ad hoc decomposition, however, often reveals the following problems during the subsequent detailed design phases. • Overall structural stiffness: Assembled products cannot achieve desired stiffness with specified joining methods.
KEYWORDS
• Manufacturability and assembleability: Components cannot be manufactured and/or assembled with economical means.
Product decomposition, assembly synthesis, structural topology optimization, graph decomposition, image processing, design for manufacturing.
• Dimensional errors: Joints do not allow the adjustments in critical dimensions during assembly to absorb manufacturing errors (in-process dimensional adjustments).
body frame hood
inner fenders
outer fenders radiator support external panels
internal structures
Figure 1. Example of decomposition of an automotive body front.
Since a decomposition determines basic component geometries and joint configurations, we have conjectured that the above problems can be effectively avoided by a good selection of a decomposition during the stage of assembly synthesis. Accordingly, this paper describes our first attempt towards the development of an automatic method for the assembly synthesis of structural products that enables a designer to explore a large number of feasible decompositions prior to the detailed component design phase. A complex structure obtained via structural topology optimization is decomposed into an assembly made of multiple structural members with simpler geometries. Preliminary results are presented for example decompositions of Mitchell’s truss like structures that demonstrate the impact of decomposition to the overall structural stiffness and inprocess dimensional adjustability of the resulting assemblies. The results motivate the future development of automated optimal assembly synthesis based on the quantitative evaluation of product decompositions generated through the presented method.
2 RELATED WORK Design for assembly (DFA) is a class of design methodologies for improving product design based on assembly considerations to realize easy and lowcost assembly (Boothroyd and Dewhurst, 1983). Based on the results from the seminal work on assembly modeling and sequence generation (Bourjault, 1984; de Fazio and Whitney, 1987; de Mello and Sanderson, 1991; Lee and Shin, 1990), a number of researchers attempted the integration of assembly planning and DFA (de Fazio et al., 1993; Lee et al., 1993; Hsu et al., 1993). Although proven effective, the methods requires a product decomposition specified a priori by a designer. An automatic product decomposition method, such as the one dis-
cussed in this paper, would provide an input to such DFA methods. Graph decomposition (Bos´ak, 1990), a basis of an automatic decomposition presented in this paper, has also been applied to automatic assembly sequence generation, where a disassembly sequence (assumed to be the reverse of an assembly sequence) is generated by sequential binary decompositions (i.e., cuts) of a graph of connections of an assembled product (Bourjault, 1984; de Fazio and Whitney, 1987; de Mello and Sanderson, 1991; Lee and Shin, 1990). Feasibility of each binary decomposition is determined by checking the precedence relationship of two subassemblies subject to partition using human input (Bourjault, 1984; de Fazio and Whitney, 1987) or geometric reasoning (Lee and Shin, 1990). Recently, Wang et al. (Wang and Bourne, 1997; Wang, 1997) developed a system which decomposes an unfolded sheet metal product based on the decomposition of a spanning tree of the faceadjacency graph of the product. Although their focus is similar to the presented work, the system does not consider the structural issues of the product. Also, the approach does not address the issue of dimensional error in cutting, bending, and joining.
3 AUTOMATIC ASSEMBLY SYNTHESIS METHOD 3.1 Structural topology optimization The input to the presented assembly synthesis method is a bitmap image of a structure generated via structural topology optimization. Structural topology optimization methods, such as the homogenization design method (Bendsøe and Kikuchi, 1988) and the genetic algorithm based method (Chapman et al., 1994), enable top-down synthesis of an optimal structure that fits within a specified design domain from the specification of loading and boundary conditions. As illustrated in Figure 2, these methods take as input the design domains and the loading and boundary conditions, and then produces through finite element analyses a discretized image (bitmap or gray scale) of an optimal material distribution in the design domain which, for example, maximizes stiffness at the loading point subject to weight constraints. In most cases, each pixel in the output image corresponds to a finite element. The methods also allow the design domain to be multiplyconnected (i.e., to have holes) or three dimensional.
AA AA A
design domain
1
P
Figure 2. Structural topology design method: The right figure shows a structure with maximum stiffness occupying 40% of the design domain. The results is obtained by using Topology Optimization Web site at the Technical University of Denmark.
Since structural topology optimization provides a mathematical formulation to synthesize a structure optimized for a given objective in terms of size, shape, and topology (Chapman et al., 1994), it has been applied to numerous structural design problems ranging from civil structure design (Mijar et al., 1998) to material micro structure design (Siva et al., 1997). In spite of its extreme popularity in structural design community, however, structural topology optimization has not yet gone beyond the realm of academic research. This is because the resulting optimal structures are often too complex to be manufactured without further decompositions. Accordingly, the presented method is designed to provide an automatic means to decompose such a complex structure into an assembly consisting of multiple components based on the following two steps: 1. A bitmap image of a structure obtained via structural topology optimization is transformed to a product topology graph through the sequential application of image filters. 2. The structure is automatically decomposed into multiple structural members through the decomposition of the product topology graph to its subgraphs. The resulting assembly can be evaluated based on desired engineering criteria such as structural stiffness. The following sections destined each of these two steps in detail.
3.2 Construction of product topology graphs Figure 3 outlines the flow of the transformation process. First, topology of the output image is extracted by identifying the distinct segments in the output image (Figure 3 (b)). Next, the resulting segments are labeled, and their connectivities are checked to produce a product topology graph (Figure 3 (c)).
2
1
3 4 (a)
(b)
2 3
5
4
5 (c)
Figure 3. Transformation of a structural topology optimization output to a product topology graph. (a) output image, (b) extraction of product topology, and (c) resulting product topology graph. The I-beam like image in (a) was adopted from (Chapman et al., 1994).
(a)
(b)
(c)
(d)
(e)
(f)
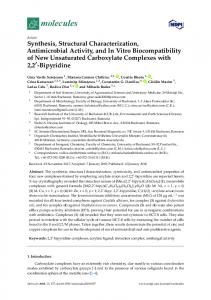
Figure 4. An example of product topology extraction: (a) original image, (b) dilation, (c) skeletonization, (d) initial Hough transform (shown in θ-ρ space), (e) primary line extraction, and (f) topological segmentation.
The extraction of product topology is accomplished by the successive application of standard digital image processing algorithms such as dilation, skeletonization, and the Hough transform (Gonzalez and Wintz, 1987), as well as non-standard algorithms such as primary line extraction and topological segmentation. Figure 4 illustrates a sequence of these image transformations applied to an example I-beam like image (Chapman et al., 1994) using the preliminary implementation of the transformation algorithms. A brief description of each step is given in the following. Although the description assumes a bitmap image as an input, it can be easily generalized to a gray scale image with a prior application of an appropriate thresholding method.
• Dilation fattens the image by filling a small, isolated holes and expanding the image boundary (Figure 4 (b)). It scans the image and turn a pixel on if a majority of the neighboring pixels are also on. Definition of majority and neighbor determines the effects of fattening. Since dilation is to eliminate small voids or non-smooth edges prior to skeletonization, it is unnecessary for smooth images such as the right figures in Figures 2. • Skeletonization has an opposite effects to dilation. It thins the image by expanding a small, isolated holes and shrinking the image boundary (Figure 4 (c)). It scans the image and turn off a pixel if a majority of the neighboring pixels are also off. Definition of majority and neighbor determines the effects of thinning. Applying dilation before skeletonization prevents the resulting skeleton from being affected by noises in the original image. • Hough transform detects lines in the skeletonized image by mapping the image in the x-y space to a parameter space (the θ-ρ space) using the normal representation of a line in x-y space:
x cos θ + y sin θ = ρ
(1)
Since a pixel (xi , yi ) in the x-y space corresponds to a sinusoidal curve xi cos θ + yi sin θ = ρ in the ρ-θ space, collinear pixels in the x-y space have the intersecting sinusoidal lines in the θ-ρ space. Conversely, an intersection point (θn , ρn ) in the θ-ρ space corresponds to a line in the x-y space. Therefore, all lines passing through arbitrary pairs of pixels in the image are found by checking the intersection points in the the θ-ρ space. Discretization of the θ-ρ space for computing the sinusoidal lines determines the accuracy of the detected lines. The Hough transform is repeatedly applied in the primary line extraction algorithm described below. Figure 4 (d) shows the θ-ρ space from the initial application to the skeletonized image. A generalized form of the Hough transform uses a spline representation of a curve to detect arbitrary curves in the image (Ballard, 1981), which will be incorporated in the future implementation. • Primary line extraction abstracts the topology of the skeletonized image by selecting primary lines in the x-y space based on the number of pixels they pass through. Basic procedure is as
follows. 1. Do the Hough transform of the image. 2. Select an intersection point in the θ-ρ space with the maximum number of intersecting lines. If the maximum number is below a prespecified value, return. 3. Remove pixels in the image corresponding to the intersecting lines in 2. 4. Go to 1. Figure 4 (e) shows the extracted three primary lines shown in a different gray scale. The prespecified value in the step 2 to cut off the iteration determines the “level of abstraction” of the extracted topology. The repeated application of the Hough transform is needed since the pixels removed in the step 3 may also have been on the lines not selected in the step 2. However, it does not generally add a significant computational overhead since the number of unremoved pixels rapidly decreases after a few iterations. • Topological segmentation associates each pixel in the original image to each primary line identified above. For each pixel in the original image, it calculates the distances to all primal lines, and associates the pixel with the primal line with the minimum distance. Figure 4 (f) shows the original image shaded with three distinct segments corresponding to the three primal lines in Figure 4 (e). Occasionally, however, the topological segmentation yields a segmented image with stand-alone (disconnected) pixels at the intersection of multiples segments. In such cases, the following postprocessing is necessary to re-assign these pixels to another primal line so they can be connected. • Pixel re-assignment 1. Select a segment in an image obtained by the topological segmentation. If all segments have been checked, return. 2. Count the number of disconnected subsegments. If the number is one, go to 1. Otherwise let the largest sub-segment be the primal segment. 3. For each pixel not belonging to the primal segment, re-assign the pixel to the primal line to which the majority of the surrounding pixels belong.
1
2
cut
3
3 4
2
1
5
cut
4
5 (a)
(b)
(c)
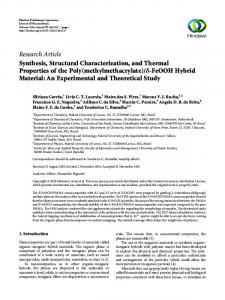
: spot welding : adjustable direction
(a)
(b)
Figure 5. Decomposition of a product topology graph and the corresponding product geometry before decomposition (a) and after decomposition (b).
4. Go to 1. After the completion of the extraction of product topology, a product topology graph can be easily constructed by labeling each edge of the primary lines and each intersection point among these edges, with a node and an edge in a graph data structure, respectively.
3.3 Decomposition of product topology graphs The structural members are synthesized by decomposing the product topology graph and the corresponding product geometry. As illustrated in Figure 5, several cuts can be applied to the edges of the structural topology graph to yield a desired number of distinct subgraphs, each of which corresponds to a component in the decomposed structure. Given a constructed structural topology graph, a standard graph partition algorithm (Bos´ak, 1990) can realize this procedure automatically. The quality of a decomposition is qualitatively evaluated based on the reduction of overall structural stiffness due to the introduction of the joints and inprocess dimensional adjustability (Mantripragada and Whitney, 1998), a degree to which a desired critical dimension can be adjusted during the assembly process. Although the precise quantitative evaluation of these criteria requires the detailed component design, fairly sensible evaluation can be done with the preliminary geometry of the decomposed components and the associated selection of the mating features at the joints.
(d)
(e)
Figure 6. Mating features common to components joined with spot welding (Mantripragada and Whitney, 1998).
Figure 6 shows examples of the mating features common to spot-welded joints with various orientations of mating surfaces and the corresponding adjustable directions, which will be considered in the examples in Section 4. Similar choices for mating features are also available for other joint types, e.g. bolted joints. As seen from the figure, both the geometry of components and the orientation of mating surfaces are needed to determines the stress to the joints and the adjustable dimensions in the decomposed structure. • Overall structural stiffness of the assembled product is qualitatively evaluated based on the stress on the mating surfaces at the joints of the decomposed components. The evaluation method is based on the reasoning that the decompositions at the mating surfaces with the lower stress would cause less reduction in the overall structural stiffness. The stress components on the mating surfaces can be computed from the orientation of the surfaces and the stress tensor of the finite element corresponding to the pixels subject to decomposition. The stress component of interest depends on the type of the chosen joining methods. For example, if the components are to be joined with spot welding, the value of tensile stress has more significance than shear stress, since the spot welding is more susceptible to tensile stress. • In-process adjustability of critical dimensions during assembly is qualitatively evaluated based on the directional match between the given critical dimensions and the dimensions that are ad-
critical dimension
critical dimension
(a)
(a)
(b)
(b)
Figure 7. In-process adjustability evaluation: (a) adjustable and (b) not adjustable.
justable during assembly process. Such adjustable dimensions can be computed from the preliminary geometry of the decomposed components and the orientation of mating surfaces at the joints. For example, the assembly in Figure 7 (a) has more in-process adjustability in the shown critical dimension than the assembly in Figure 7 (b) due to the orientation of mating surfaces relative to the joined components.
4
EXAMPLES
This section describes example topology extraction and decomposition of two Mitchell’s truss like structures obtained by structural topology optimization methods. A gray scale output image is first transformed to a binary image by simple thresholding, and the transformation algorithms discussed in Section 3.2 is applied to the binary image. In the first example, the resulting product topology graph is decomposed to four components. To demonstrate the impact of decomposition to overall structural stiffness and in-process dimensional adjustability of the resulting assemblies, example decompositions are provided that are qualitatively “good” and “bad” for each of these criteria. In the second example the transformation algorithms exhibit some difficulties due to the complexity of the image. Possible cause of these difficulties and improvements are discussed. The transformation algorithms are implemented in C++ with the use of a graph data structure and its manipulation methods in the LEDA Library developed at the Max-Planck-Institute of Computer Science1 .
(c)
(e)
(d)
(f)
Figure 8. Result of product topology extraction: (a) original image, (b) dilation, (c) skeletonization, (d) initial Hough transform (shown in θ-ρ space), (e) primary line extraction, and (f) topological segmentation. Note that dilation has little effect since the original image is smooth.
4.1 Example 1 First example is the decomposition of the right image of Figure 2, a cantilever structure fixed at a vertical boundary subject to downward load P. The output image is obtained by using the Topology Optimization Web site at the Technical University of Denmark2 . Figure 8 shows the results of the successive application of the transformation algorithms to this image. As shown in Figure 8 (f), all distinct “members” in the input image are successfully segmented as a result of the image transformation. Note since the original image in Figure 8 (a) is already smooth, dilation has little effects as shown in Figure 8 (b). Figures 9 (a) and (b) show the extracted product topology with the label for each member and the resulting product topology graph, respectively. The following assumptions are made on the design
1 http://www.mpi-sb.mpg.de/LEDA/. 2 http://www.topopt.dtu.dk/.
1
1
3
3
6
4
3 6
2
7 0
5
9 10 7
2
8 0
(a)
4
5
6
12
7 2
0
4
Figure 9. Construction of the product topology graph: (a) extracted product topology, and (b) the resulting product topology graph.
and manufacturing of the structure.
• The horizontal length of the assembled structure is the critical dimension. Example decompositions of the segmented image into four components are generated that are, based on these simple assumptions, qualitatively “good” and “bad” for overall structural stiffness and for inprocess dimensional adjustability. Note that in the decomposed images shown below, a mating feature is drawn manually at each joint to emphasize the fact that it can be adjusted only in the horizontal direction. Figures 10 and 10 show the decompositions that are “good” and “bad” for structural stiffness under the specified loading P, respectively in the decomposed image and the corresponding decomposition of product topology graph. Note both decompositions has four components and six joints, which are represented as subgraphs and dashed lines in Figures 10 (b) and 10 (b), respectively.
4
7
5 2
0
(a)
1
(b)
Figure 10. Four-component decomposition that is “good” for structural stiffness: (a) the decomposed image and (b) the corresponding decomposition of the product topology graph. Among 6 joints represented as dashed lines in (b), joints 0, 4 and 5 are in compression and joints 3, 6, 2 are in tension.
1
3 9
3
4
5
6
4
7
5
11
6
• The assembled structure is attached to the wall with members corresponding to node 0 and 1 in the product topology graph in Figure 9.
• The decomposed components are joined with spot welding, hence joints are strong for shear and compressive stress, but weak in extensile stress.
8 0
• The structure can be decomposed only at the location corresponding to the edges of the product topology graph.
• For the simplicity of discussion, the decomposed components are joined with the mating features that allow adjustments only in the horizontal direction.
6
11
2
1
(b)
4
5
6
5
13
9
3
11
14
1
3
2
8 0
(a)
2
0
1
(b)
Figure 11. Four-component decomposition that is “bad” for structural stiffness: (a) the decomposed image and (b) the corresponding decomposition of the product topology graph. Among 6 joints represented as dashed lines in (b), joints 0 and 5 are in compression and joints 1, 2, 3 and 6 are in tension.
Among 6 joints in Figure 10, three joints (joints 0, 4 and 5) are in compression and three (joints 3, 6, 2) are in tension, according to a finite element analysis of the original image. In Figure Figure 11, on the other hand, only two (joints 0 and 5) are in compression and the rest of four (joints 1, 2, 3 and 6) are in tension, making this decomposition more susceptible to joint failure than the decomposition in Figures 10. This is due to the fact that components 2 and 6 carry compressive load whereas components 3 and 7 carry tensile load, as a result of the downward P. Figures 12 and 12 show the decompositions that are “good” and “bad” for in-process adjustability of the critical dimension (horizontal length) indicated in the figures, respectively. Since all joints are adjustable only in the horizontal direction, the shown critical dimension of the structure can be adjusted in the decomposition in Figure 12, during the as-
critical dimension
1
3 9
3 6
10 7
2
8 0
4
5
6
4
14
5 2
0
(a)
11
7 1
AA AA AA
design domain
P
Figure 14. Mitchell’s truss like structure obtained via structural topology optimization (Zhou et al., 1999).
(b)
Figure 12. Four-component decompositions that are “good” for in-process adjustability: (a) the decomposed image and (b) the corresponding decomposition of the product topology graph. The joints are represented as dashed lines in (b). The shown critical dimension can be adjusted during the assembly process.
critical dimension
1
3 9
3
(a)
(b)
4
5
6
4
7
5
11
6
2
8 0
2
0
1
(c) (a)
(d)
(b)
Figure 13. Four-component decompositions that are “bad” for in-process adjustability: (a) the decomposed image and (b) the corresponding decomposition of the product topology graph. The joints are represented as dashed lines in (b). No adjustments during assembly process are possible for the shown critical dimension.
sembly of the component made of nodes 4 and 5 in the product topology graph. In the decomposition in Figure 13, on the other hand, no such adjustments are possible due to the fact that the critical dimension is completely determined by the geometry of the components made of nodes 1 and 4, and of nodes 0 and 5.
4.2 Example 2 Second example is the decomposition of the right image in Figure 14, a cantilever structure fixed at a circular boundary subject to downward load P. The output image is recovered from (Zhou et al., 1999). Figure 15 shows the results of the successive application of the transformation algorithms to the image. Although most of distinct “members” in the input image is successfully segmented, the algorithm failed to extract the complex topology near the cir-
(e)
(f)
Figure 15. Result of product topology extraction: (a) original image, (b) dilation, (c) skeletonization, (d) initial Hough transform (shown in θ-ρ space), (e) primary line extraction, and (f) topological segmentation.
cular boundary, as shown in Figure 15 (f). This is most likely due to the pixel re-assignment algorithm that tends to treat very short segments as isolated pixels and re-assign these pixels to neighbor segments. The algorithm should be improved to be able to distinguish short segments and isolated pixels by, for example, locally increasing the resolution of the Hough transform near the region of interests.
5 DISCUSSION AND FUTURE WORK This paper discussed a method for synthesizing assemblies of structural products where a complex structure obtained via structural topology optimiza-
tion is decomposed into an assembly made of multiple structural members with simpler geometries. The work presented here is our first attempt towards the development of a systematic method for the assembly synthesis of structural products, in order to to explore a large number of feasible decompositions prior to the detailed component design phase. A two-dimensional bitmap image of a structure obtained via structural topology optimization is transformed to a graph with the equivalent topology through the sequential application of image filters. The structure is decomposed interactively into multiple structural members through the decomposition of the resulting graph to subgraphs. Preliminary results are presented for example decompositions of Mitchell’s truss like structures that demonstrate the impact of decomposition to the overall structural stiffness and in-process dimensional adjustability of the resulting assemblies. Besides further improvements in the topology extraction algorithms discussed in Section 4.2, their difficulty in the complex image in Example 2 suggests the following. • Quantitative evaluation of decomposition quality. The criteria for evaluating a quality of a decomposition should be mathematically formulated to allow quantitative comparison among many feasible decompositions, including the choices of mating angles at each joints. The need of such quantitative measure becomes evident for the decomposition of complex images like the one discussed in Example 2 that would have a very large number of feasible decompositions and choices of mating angles. The evaluation of structural stiffness should be linked with the finite element analysis used for the structural topology optimization for precise estimation of the loss of stiffness due to a decomposition. The evaluation of in-process dimensional adjustability should be linked with geometric reasoning to quantify the difficulty in dimensional adjustment. In addition to the two criteria discussed in this paper, a decomposition should also be evaluated in terms of manufacturability and assembleability, based on the topology and preliminary geometry of each component. • Automated optimal decomposition. For a complex image with potentially a large
number of feasible decomposition, an automated selection of optimal decompositions would be desirable. Given a means of quantitative evaluation of a decomposition, this can be accomplished by coupling the evaluation system and the current implementation of decomposition system. The new system should be able to simultaneously select a decomposition and the corresponding choice of mating features at each joint from a given mating feature library. The presented decomposition method is to provide a designer with an efficient means to explore a large number of feasible decompositions prior to the detailed component design phase. It is desirable, therefore, to automatically generate multiple high-performance decompositions, rather than one single best decomposition, which provide a designer with design alternatives to be examined during the detailed component design phase. Addressing these issues would be a part of future work.
ACKNOWLEDGMENTS A partial support for this work has been provided by Toyota Motor Corporation and the Horace H. Rackham School of Graduate Studies at the University of Michigan. These sources of support are gratefully acknowledged.
REFERENCES Ballard, D. H. (1981). Generalizing the Hough transform to detect arbitrary shapes. Pattern Recognition, 13(2):111–122. Bendsøe, M. P. and Kikuchi, N. (1988). Generating optimal topologies in structural design using a homogenization method. Computer Methods in Applied Mechanics and Engineering, 71:197–224. Boothroyd, G. and Dewhurst, P. (1983). Design for Assembly Handbook. University of Massachusetts, Amherst. Bos´ak, J. (1990). Decompositions of Graphs. Kluwer Academic Publications. Bourjault, A. (1984). Contribution a une Approche M´ethodologique de L’Assemblage Automatis´e: Elaboration Automatique des S´equences Op´eratoires. PhD thesis, Universit´e de FrancheComt´e, Besanc¸on, France. Chapman, C. D., Saitou, K., and Jakiela, M. J.
(1994). Genetic algorithms as an approach to configuration and topology design. ASME Journal of Mechanical Design, 116:1005–1012. de Fazio, T., Edsall, A., Gustavson, R., Hernandez, J., Hutchins, P., Leung, H.-W., Luby, S., Metzinger, R., Nevins, J., Tung, T., and Whiteney, D. (1993). A prototype of feature-based design for assembly. ASME Journal of Mechanical Design, 115:723–734. de Fazio, T. and Whitney, D. (1987). Simplified generation of all mechanical assembly sequences. IEEE Journal of Robotics and Automation, RA– 3(6):640–658. Corrections on same journal, RA– 4(6):705–708, 1988. de Mello, L. H. and Sanderson, A. (1991). A correct and complete algorithm for the generation of mechanical assembly sequences. IEEE Transactions on Robotics and Automation, 7(2):228–240. Gonzalez, R. C. and Wintz, P. (1987). Digital Image Processing. Addision Wesley, Reading, Massachusessts, second edition. Hsu, W., Lee, C., and Su, S. (1993). Feedback approach to design for assembly by evaluation of assembly plan. Computer-Aided Design, 25(7):395– 410. Lee, S., Kim, G., and Bekey, G. (1993). Combining assembly planning with redesign: an approach for more effective DFA. In Proceedings of 1993 IEEE International Conference on Robotics and Automation, pages 319–325. Lee, S. and Shin, Y. (1990). Assembly planning based on geometric reasoning. Computer and Graphics, 14(2):237–250. Mantripragada, R. and Whitney, D. (1998). The Datum Flow Chain: a systematic approach to assembly design and modeling. Research in Engineering Design, 10(3). Mijar, A. R., Swan, C. C., Arora, J. S., and Kosaka, I. (1998). Continuum topology optimization for concept design of frame bracing systems. Journal of Structural Engineering, pages 541–550. Siva, E. C. N., Fonseca, J. S. O., and Kikuchi, N. (1997). Optimal design of piezoelectric microstructures. Computational Mechanics, 19:397– 410. Wang, C.-H. (1997). Manufacturability-Driven Decomposition of Sheet Metal Products. PhD thesis, Carnegie Mellon University. also available as Technical Report, CMU-RI-TR-97-35. Wang, C.-H. and Bourne, D. (1997). Concur-
rent decomposition for sheet-metal products. In Proceedings of 1997 ASME Design Engineering Technical Conference, Sacramento, CA. Zhou, M., Shyy, Y. K., and Thomas, H. L. (1999). Checkerboard and minimum member size control in topology optimization. In Short Paper Proceedings of the 3rd World Congress of Structural and Multidisciplinary Optimization, volume 1, pages 440–442, Buffalo, New York.