INTERNATIONAL JOURNAL OF RESEARCH IN COMPUTER APPLICATIONS AND ROBOTICS www.ijrcar.com
Vol.5 Issue 11, Pg.: 1-10
November 2017
INTERNATIONAL JOURNAL OF RESEARCH IN COMPUTER APPLICATIONS AND ROBOTICS ISSN 2320-7345
DEFINING FUZZY MEMBERSHIP FUNCTION USING BOX PLOT PPG Dinesh Asanka1, Amal Shehan Perera2 1
Department of Computer Science and Engineering, University of Moratuwa, Moratuwa, SRI LANKA
[email protected] 2 Department of Computer Science and Engineering, University of Moratuwa, Moratuwa SRI LANKA
[email protected]
Abstract: - Defining a Membership Function in fuzzy systems is complex thus the most important activity. Though there exist several ways to define membership function such as artificial neural networks, genetic algorithm, fuzzy clustering etc. they are time consuming and there are complexities in implementation of these methods. This research has identified simple, technique of using box plot to define fuzzy membership function with some constraints. Using the boxplot parameters, three-state and five-state membership functions can be defined. In this method, triangular semi-trapezoidal and trapezoidal functions are used. Couple of realworld implementations were identified to utilize this method. Major advantage of the box plot method is that it is less expensive than neural network and genetic algorithm.
Index Terms — Fuzzy Systems, Membership Function, Box Plot
1. Introduction Fuzzy logic is used to mitigate uncertainty in many domains such as agriculture [Ashraf, A., Akram, M., Sarwar M., 2014], medicine [Sapna S., Pravin K., 2015], [Dong W., Huang Z., Duan H., 2014], power systems [Wang Q., Wang Y., Zhang H., Sun Y., 2016], production [Bhargava A.K., Singh S.R., 2014], sports [Zeng W., Li J, 2014], transportation [Wang Y.C., Chien C.J., Wang C.H., 2016] etc. In those implementations, membership function plays a key role in the outcome of the results. In most cases, membership functions of semi-trapezoidal, trapezoidal and triangular shapes are used because they are in general the most appropriate shapes and the most widely used in fuzzy systems. Several techniques are used to define membership function and its parameters. Some of them are Horizontal Method of Membership Estimation, Vertical Method of Membership Estimation, Pairwise-Comparison Method of Membership Function Estimation, Problem Specification Based Membership Determination, Membership Estimation via Fuzzy Clustering, Artificial Neural Network and Genetic Algorithm etc. [George J., Klinn., Bo Tuan, 1995]. There are a growing number of research papers in the area of cognitive systems and artificial intelligence where methods like neural networks and reasoning systems like fuzzy systems. In these cases, the membership functions are generally tuned in a cyclic fashion and are closely tied to their associated rule structure [Hayashi et al., 1992]. In the case of Genetic Algorithms, there are few researched were done [Karr & Gentry, 1993; Takagi, 1993]. There are major improvements are made in the ability of genetic algorithms to find optimum solutions. Both
PPG Dinesh Asanka & Amal Shehan Perera
Page 1
INTERNATIONAL JOURNAL OF RESEARCH IN COMPUTER APPLICATIONS AND ROBOTICS www.ijrcar.com
Vol.5 Issue 11, Pg.: 1-10
November 2017
neural network and genetic algorithm approaches to determining membership functions generally make use of associated rules in the knowledge base. In Inductive reasoning, as long as the database is not dynamic the method will produce good results. When the database changes, the partitioning must be re-accomplished. When compared to neural networks and genetic algorithms, inductive reasoning has as advantages in the fact that the method may not require a convergence analysis, which is the case of neural network and genetic algorithms. Every method has its own advantages and disadvantages depending on the different scenarios. In this research paper, a new technique is introduced to build a fuzzy membership function using box plot. There are few constraints in this technique as well. Methods used to construct a membership function is uncertain to many reasons because of the terminologies used in defining the membership function of antecedent and consequent of rules mean different to different people, the training data set may be noisy and the classification used to define these words can be expressed by different people as different functions, i.e., trapezoidal, triangle, or Gaussian [Mendel J.M, 1999]. In this research, Type-II fuzzy membership functions were introduced to Nitrogen, Phosphorus, Potassium values of input surfaces. In (Dong W., Huang Z., Duan H, 2014), both semi-trapezoidal shape and triangular shapes were used as membership functions and the stated reason was that they are in general the most appropriate shapes and the most widely used in fuzzy systems. In research done to improve bakery production using Fuzzy Goal Programming (FGP), linear membership function or triangular fuzzy membership function is used [Bhargava A.K., Singh S.R., 2014]. However, these researches show that, in many cases, construction of fuzzy membership function is subjective or arbitrary and this research paper tries to identify a data driven technique to define a fuzzy membership function. In the other computational methods, duration to create fuzzy membership function is very high which defies fact of creating fuzzy membership function in effective manner. This paper is organized as follows. In section II. Basis of box plot technique is discussed. Three-state and five-state fuzzy membership function definitions are discussed in Section III and Section IV respectively. Section V discusses implementation of those membership fuzzy functions. Section VI discusses evaluation of the proposed implementation. Conclusion and future works are discussed in the Section VII. In the Section VIII, related references are listed for further details.
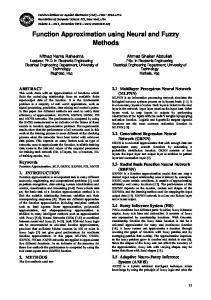
2. Box Plot Technique Typically, Box Plot is used to show distributional shapes and to detect unusual observations. This is also called five number property of a data set. Diagram of a Box Plot is shown in figure 1.
Figure 1: Box Plot [11]
As shown in Figure 1 above, the box shows the interquartile range (IQR). The IQR is the 25 to 75. Percentile also known as Q1 and Q3. The IQR is where the center 50% of your data points will fall. The whiskers add 1.5 times the IQR to the 75 percentile (aka Q3) and subtract 1.5 times the IQR from the 25 percentile (aka Q1). The whiskers should include 99.3% of the data if from a normal distribution. The Line which the median of the data.The Notch displays the a confidence interval around the median which is normally based on the median +/1.57 x IQR/sqrt of n. According to Graphical Methods for Data Analysis although it is not a formal test, if two boxes notches do not overlap there is ‗strong 95% confidence their medians differ [12].
PPG Dinesh Asanka & Amal Shehan Perera
Page 2
INTERNATIONAL JOURNAL OF RESEARCH IN COMPUTER APPLICATIONS AND ROBOTICS www.ijrcar.com
Vol.5 Issue 11, Pg.: 1-10
November 2017
3. Five State Fuzzy Membership Function Every inventory transaction identifies the date, product, In a fuzzy membership function, there can be multiple states depending on the domain which you select. In this research paper, two diffferent fuzzy membership types of functions were identified where the main diffrence is the number of states. As shown in figure 2 and figure 3, first memberhsip function has five states and the second fuzzy membership function has three states. Figure 2, shows the five-state fuzzy membership function using trignometric and trapzoidal functions (Zhao J., Bose B.K, 2002) where all the state of box plot is used in the fuzzy membership function.
Figure 2: Five State Fuzzy Membership Function
State five fuzzy membership function is defined below. mi – Minimum value Q1 - First Quartile m – Median Q3 – Third Quartile mx – Maximum value
PPG Dinesh Asanka & Amal Shehan Perera
Page 3
INTERNATIONAL JOURNAL OF RESEARCH IN COMPUTER APPLICATIONS AND ROBOTICS www.ijrcar.com
Vol.5 Issue 11, Pg.: 1-10
November 2017
During the implementaion of this fuzzy membership, different states can be apropriately assigned depending on the domain
4. Three State Fuzzy Membership Function As similar to the Five State fuzzy membership function, three state fuzzy membership can be defined. In this, first quartile and the third quartile are ignored. Figure 3, shows the three state fuzzy membership function with using trignometric and trapzoidal functions where only minimum, median and maximum values are used in the fuzzy membership function.
Figure 3: Three State Fuzzy Membership Function
Similar to five state membership function, three state membership function was defined as stated below.
During the implementaion of this fuzzy membership, different states can be assigned depending on the domain and the data set. In the defined fuzzy sets follows two properties [Ross T.J., 2010]. Cross over point: In both fuzzy sets, for all states cross over point is 0.5 which indicates these sets are symmetric. Height of the fuzzy set (hgt= max(MA(x)) : 1 in both fuzzy sets.
PPG Dinesh Asanka & Amal Shehan Perera
Page 4
INTERNATIONAL JOURNAL OF RESEARCH IN COMPUTER APPLICATIONS AND ROBOTICS www.ijrcar.com
Vol.5 Issue 11, Pg.: 1-10
November 2017
5. Implementation To evaluate proposed box-plot method, real world data set was used. Check-roll data set of a plantation sector was chosen as a sample data set. Main reason to use check-roll data is that, it is real world data and not many examples are available for check roll. Check roll system is used to manage employees who are working in the plantation sector. Sample data set was taken from a factory in hill country in Sri Lanka for 2012 – 2016. Before implementing fuzzy membership function, it is required to understand what the constraints to implement this method are. Firstly, it was decided to partition data to verify whether the data is uniform. Though, there are several partition variables can be selected, selected variable should not be biased. Most of the time, year can be selected as the partition variable. For example, when fuzzy membership function to be decided, employees age of a factory, minimum age of the employee for the year or in other words age at the first month of the year was selected for the boxplot. All the boxplots are drawn in same scale to identify the deviations of each boxplot as shown in Figure 4.
Figure 4: Range of Box Plots for Age Year Wise
Means of five values of Boxplot and stand deviation error is calculated in order to find out whether the data set can be applied to the boxplot mechanism as shown in Table 1. A standard error is the standard deviation of the sampling distribution of a statistic. Standard error is a statistical term that measures the accuracy with which a sample represents a population. In statistics, a sample mean deviates from the actual mean of a population; this deviation is the standard error. Table 1: Mean, Standard Deviation Box Plots
Mean
mi Q1 m Q3 mx
151.4 220.34 286.25 363.00 570.75
Std. Dev
0.81 34.40 28.67 37.72 78.19
Standard Error of the Mean 0.05 2.15 1.79 2.36 4.89
Next, the notch of the box plot needs to be validated. In the above example, notch ranges from 278 to 294. Range percentage is 5.33. Since all of the Standard Error of the Mean values ha less than 5 and notch range percentage is close to 5%, these data set can be considered to use box plot to define fuzzy membership function. After it was decided to use boxplot, next step is to find out five numbers for the final boxplot. As shown in table 1, mean values for five numbers are used to define the average or the effective box plot for the data set which is shown in figure 5.
PPG Dinesh Asanka & Amal Shehan Perera
Page 5
INTERNATIONAL JOURNAL OF RESEARCH IN COMPUTER APPLICATIONS AND ROBOTICS www.ijrcar.com
Vol.5 Issue 11, Pg.: 1-10
November 2017
Figure 5: Effective Box Plot for Age
After the effective box plot is defined for the entire data set, number of states for the fuzzy membership function should be defined. Depending the number of states, whether it is five or three, and relevant fuzzy membership function is selected. Figure 6 shows all the steps to define effective box plot.
Figure 6: Steps to Define Effective Box Plot
6. Evaluation Three state method was used define fuzzy membership function for the age of factory employees. Following is the membership function for three states. Values are rounded to fourth decimal point.
PPG Dinesh Asanka & Amal Shehan Perera
Page 6
INTERNATIONAL JOURNAL OF RESEARCH IN COMPUTER APPLICATIONS AND ROBOTICS www.ijrcar.com
Vol.5 Issue 11, Pg.: 1-10
November 2017
Using above definition, membership function was plotted using Matlab and fuzzy logic designer as shown in Figure 7.
Figure 7: Membership Function for Age
In the mentioned eaxmple, range dimension is used analysed range of ages shown in Table 2. Range Dimesiopns are typically used in data waerhosing systems which is a crisp data set. Table 2: Employee Age Range Dimension
Range Description Young
Start Range 1
End Range 300
Medium
301
540
Old
541
9999
When this was compared with the Figure 7: it can be observed that fuzzy membership function and range dimensions are closed to each other as shown in the below figure.
Figure 8: Membership Function for Age Comparison with Crisp Data Sets
This method was evaluated for other data attributes in the same set. As shown in the Figure 9, box plot distribution was drawn for attribute of the employee‘s permenency in months.
PPG Dinesh Asanka & Amal Shehan Perera
Page 7
INTERNATIONAL JOURNAL OF RESEARCH IN COMPUTER APPLICATIONS AND ROBOTICS www.ijrcar.com
Vol.5 Issue 11, Pg.: 1-10
November 2017
Figure 9: Box Plot Distribution for Permanent in Months
Above figure indicates that not every attribute can be adopted the discussed box plot technique as it has its constraints. Since there are other methods to develop membership function, it is necessary to compare and contrast proposed Box plot method with discussed methods at the start of the research paper. Fuzzy contributions need to be evaluated. Since fuzzy contributions has multiple states, it is a challenge to compare and evaluate with classical crisp state. It was assumed that tuple which has more than 0.5 contribution is the major contribution. Then the confusion matrix was built as shown in the following table. Table 3: Employee Age Range Dimension
Classic
High
Fuzzy Range High
Low
27,099
Medium
Grand Total
80,669
107,768
Low
79,104
Medium
13,546
113,060
126,606
92,650
193,729
313,478
Grand Total
27,099
79,104
Error = (121,275 +4,670) / 267,885 = 47.3% Correction Factor is = 52.7 %
7. Validation and Error Correction After the membership function is defined, next step is to define weightages for different data points. In this error correction step, for each value sum of weightage should be 1 as Height of the fuzzy set (hgt= max(MA(x)) : 1. However, Height is more than 1 for the range of 416 and 568 as shown in the below Figure.
Figure 10: Box Plot Distribution for Permanent in Months
PPG Dinesh Asanka & Amal Shehan Perera
Page 8
INTERNATIONAL JOURNAL OF RESEARCH IN COMPUTER APPLICATIONS AND ROBOTICS www.ijrcar.com
Vol.5 Issue 11, Pg.: 1-10
November 2017
When the data is generated, due to the multiple round ups there can be total weitages of more than 1 which should be invalid due to the definition of Height of the membership function. Main reason for this is that the three functions are active in this range. To satisfy the Height of the membership function, membership function is corrected as shown in the following figure.
Figure 11: Modified Membership Function After Error Correction
8. Conclusion & Future Work Major advantage of this method is that this is less computationally less expensive than the most popular method such as neural network and genetic algorithms. In this research, only trapezoidal and trigonometric functions are considered. There are other functions such as Sfunction, r-function, Gaussian function, Exponential like function. Possibilities of incorporating these functions to boxplot needs to be evaluated. In this research, simple method was identified to define three and five state fuzzy membership function using Boxplot. This technique will not be viable for every data set therefore, constraints were also identified.
9. REFERENCES [1] Ashraf, A., Akram, M., Sarwar M., ―Type-II Fuzzy Decision Support System for Fertilizer", Punjab University College of Information Technology, University of the Punjab, April 8, 2014. [2] Bhargava A.K., Singh S.R., A Fuzzy Goal Programming Model Mathematical Sciences IJCMS ISSN 2347 – 8527 Volume 3, Issue 4 June 2014. [3] Bhargava, A.K., Singh. S.R., Bansal, D., ―A Fuzzy Goal Programming Model for Bakery Production", International Journal of Computer & Mathematical Sciences, IJCMS, ISSN 2347 – 8527 Volume 3, Issue 4, June 2014. [4] Dong W., Huang Z., Duan H., A genetic fuzzy system for unstable angina risk assessment, Cardiology Department of Chinese PLA General Hospital, Beijing, China, 2014. [5] George J., Klinn., Bo Tuan, Fuzzy Sets and Fuzzy Logic, Theory and Applications, Prentice Hall, 1995. [6] Hayashi, I., Nomua, H., Yamasaki, H. & Wakami, N., Construction of fuzzy Inference rules by NDF and NDFL, Int J. Approx, Reasoning, 6, 241-266, 1992. [7] Karr, C.L., & Gentry, E.J., Fuzzy Control of pH using Genetic Algorithms, IEEE Trans. Fuzzy Set., 46-54, 1993. [8] Lee, M., & Takagi, H., Integrating Design Stages of Fuzzy Systems using Genetic Algorithms, IEEE Trans., Paper 0-7803—614-7/93. [9] Mendel J.M., ―Computing with words when words can mean different things to different people‖, ICSC congress on computational Intelligence: Methods and Applications, 3rd Annual Symp. on Fuzzy Logic and Application, 1999. [10] Sapna S., Pravin K., Integration of Fuzzy Clustering Technique with Big Data for Disease Diagnosis, International Journal of Electrical, Computing Engineering and Communication (IJECC) Vol. 1, Issue. 3, June – 2015 ISSN (Online): 2394-8310.
PPG Dinesh Asanka & Amal Shehan Perera
Page 9
INTERNATIONAL JOURNAL OF RESEARCH IN COMPUTER APPLICATIONS AND ROBOTICS www.ijrcar.com
Vol.5 Issue 11, Pg.: 1-10
November 2017
[11] Wang Y.C., Chien C.J., Wang C.H., A Fuzzy-Neural Adaptive Iterative Learning Control for Freeway Traffic Flow Systems, Proceedings of the International Multi Conference of Engineers and Computer Scientists 2016 Vol I, IMECS 2016, March 16 - 18, 2016, Hong Kong. [12] Wang Q., Wang Y., Zhang H., Sun Y., Load Forecasting Research of Power System Based on Fuzzy Sets Algorithm, International Journal of Signal Processing, Image Processing and Pattern Recognition Vol.9, No.6, 2016, pp.283-292, ISSN: 2005-4254. [13] Zeng W., Li J., Fuzzy Logic and Its Application in Football Team Ranking, Hindawi Publishing Cooperation, The Scientific World Journal, Volume 2014, Article ID 291650, 6 pages. [14] Zhao J., Bose B.K., Evaluation of Membership Functions for Fuzzy Logic Controlled Induction Motor Drive, IEEE, 2002. [15] Notched Box Plots, https://sites.google.com/site/davidsstatistics/home/notched-box-plots, Accessed On 2016-August-28.
PPG Dinesh Asanka & Amal Shehan Perera
Page 10