This paper describes the architecture, applications, and quality evaluation of ..... but it arrives at the decoder earlier than its precedents in the high-delay flow.
Delay Cognizant Video Coding: Architecture, Applications and Quality Evaluation Yuan-Chi Chang a,d, David G. Messerschmitt a, Thom Carney b,c and Stanley A. Klein b a
Department of Electrical Engineering and Computer Sciences University of California at Berkeley Berkeley, California, USA b
School of Optometry University of California at Berkeley Berkeley, California, USA c
d
Neurometrics Institute, Berkeley, California, USA
IBM Thomas J. Watson Research Center, Yorktown Heights, NY, USA ABSTRACT
This paper describes the architecture, applications, and quality evaluation of delay cognizant video coding (DCVC), a new type of coding algorithm for delaycritical network video applications. This new coding offers many potential advantages over a traditional algorithm like MPEG. With the assumption of differential delay network connections, which are named delay flows, a DCVC algorithm transmits delay-critical video data through the lowest delay flow to achieve low perceptual delay. Less critical data travels through higher delay flows for a lower connection cost. The DCVC decoder employs asynchronous video reconstruction by rendering the data upon arrival. We demonstrate that DCVC enables more efficient utilization of bandwidth and improves perceptual quality. DCVC represents a new type of layered coding targeted at multiple levels of delay services. Prior work on multi-rate and error resilient compression techniques separately address the other two quality-of-service parameters, rate and loss. We describe a networking architecture that links the three seemingly separate coding approaches into a single loosely coupled joint source-channel coding framework. The DCVC codec architecture includes delay segmentation and compression of segmented video data. Subjective quality evaluation was conducted to measure the quality of asynchronously reconstructed sequences. Finally, two DCVC applications are illustrated that take advantage of higher delay flows for quality improvement and network capacity gain.
1 Introduction An International Telecommunication Union (ITU) study concluded that telephony users find that a round-trip delay of greater than 300 ms is more like a half-duplex connection than a conversation ÿ[1]. One measurement of Internet latency1 reported the average one-way latency can be as much as 100 ms between two nodes in the US ÿ[2], and considering a longer propagation delay (~100 ms on fiber) in a global network, providing voice services over the Internet is clearly a great challenge. One solution taken by many switch developers is to differentiate voice and data packets and give voice traffic preferential treatment. The high priority traffic may be charged more for lower delay service. While voice over IP technology is being deployed, interactive video applications, such as videophone, will pose an even bigger challenge: 1.
Video, even after compression, requires a much higher bit rate than voice. Therefore, a video call requires more network resources.
2.
Voice and video should be perceptually synchronized, so that at least a part of the video data has to be presented with the same delay as voice.
3.
Compressed video is very bursty (> 15: 1, peak-to-average ratio) and with the stringent delay constraint, the bursts cannot be smoothed. This implies that far higher bit rate than the long-term average is required at times.
4.
The traditional video display model of frame-by-frame synchronous reconstruction requires jitter-free data alignment, which is often achieved by an artificial buffer at the receiver, also contriuting to delay. This further tightens the end-to-end network delay budget. We can reasonably assume a tighter delay budget requires greater network resources.
Although we cannot change the fact that video requires a higher bit rate than voice, we can reduce the magnitude of traffic bursts and relax the delay requirements partially with delay cognizant video coding (DCVC), a new type of coding algorithm for delay-critical network video applications. Abolishing the implicit assumption in conventional video coding that every bit in a
1
We use the term ‘latency’ to describe the time between when a packet or message is generated and when it is received. The term ‘delay’ is applied in a more general notion of the time between when information, such as audio and video, is generated and when it is presented.
2
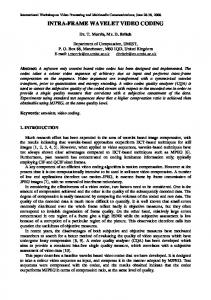
video stream has the same delay requirement, a DCVC encoder segments video information into multiple flows with different delay requirements. This has two implications: 1. The lowest delay flow, which determines the perceptual delay, consumes only a portion of the traffic. (The perceptual delay can be quantified by the relative delay to the associated audio signal for maintaining lip synchronization. The longer the perceptual delay, the worse the interactivity of the application. Another definition is the end-to-end delay of perceiving a motion event at the transmitting end, such as nodding or gestures.) 2. Bursty traffic in the flows with a relaxed delay requirement (other than the lowest delay flow) can be smoothed, resulting in more efficient use of network resources. Both implications would result in a lowered transport cost. A DCVC decoder applies a different mode of video reconstruction from the traditional, synchronous approach. Since video packets from the transmitter are carried by differential delay flows, they arrive at the receiver with different latencies. Rather than performing resynchronization, which would negate all benefits of delay segmentation, the decoder renders the data immediately upon arrival. Figure 1 illustrates an example of this asynchronous reconstruction, in which two video blocks acquired at the same instant in the transmitting terminal are assigned to different delay flows, arrive at the receiving terminal at different instants, and are displayed immediately. In the method described in this paper, segmentation is performed block-by-block. Nevertheless, DCVC is not restricted to any particular segmentation method. Since our work on DCVC relies on network delay flows, we will describe this networking framework next. With reference to this framework, Section ÿ3 presents an overview of DCVC to outline the scope and discuss its advantages. The full codec architecture is described in Section ÿ4. Results from subjective quality evaluation of DCVC video are discussed in Section ÿ5. Two DCVC applications are detailed in Section ÿ6 to demonstrate capabilities unachievable with traditional, single-stream video coding.
2 Source-network architecture DCVC is a form joint source-channel coding (JSCC) and hence cannot be understood outside the context of the presumed source-network architecture. The networks of the future will be heterogeneous with a typical path passing a number of links (including wireless) with orders of magnitude difference in quality of service (parameters like bit rate and bit error rate). This is an anathema to conventional “tightly coupled” JSCC, which would require source coding adapt to all
3
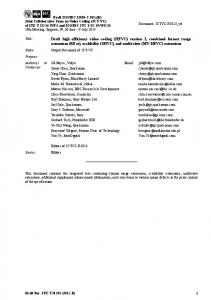
possible combinations of concatenated links. As shown in Figure 2, video coding can be tailored for a specific type of media; let it be Ethernet, asynchronous transfer mode (ATM) or code division multiple access (CDMA). Techniques such as error recovery, packetization, prioritization, and retransmission may be designed to match the characteristics of the target medium. However, when two or more links with sufficiently different quality-of-service (QoS) constitute a connection, this “tightly coupled” JSCC fails. We have proposed in ÿ[3] a “loosely coupled” JSCC framework with differential QoS flows by adding another layer of abstraction between source and channel coding. Its reference model is shown in Figure 3. Here is a brief description of the functionality of each layer in this model. •
Source coding: Compression and encryption of basic media types such as audio, video and data. A source coder generates a set of traffic-correlated flows and assigns each flow a unique flow specification. A flowspec contains an ID, a traffic descriptor (such as leaky bucket parameters), and the delay and loss requirements of the flow. This layer corresponds to an augmented presentation layer in the Open System Interconnect (OSI) seven layer model ÿ[5].
•
Source/transport interface: Service and cost negotiations for each flow. The flow data structure is maintained at this interface.
•
Transport: Networking, routing, scheduling and billing of an end-to-end flow connection. This layer corresponds to the transport and networking layers in the OSI model.
•
Transport/channel interface: Resource negotiation and impairment allocation of the end-toend flow spec to individual channels.
•
Channel coding: Control and transmission of a homogeneous physical channel. This layer corresponds to the link and physical layers in the OSI model. The reference model represents a limited decoupling of JSCC to trade off scalability and
modularity. QoS parameters shield the detailed networking implementations from upper-layer applications and yet preserve fine enough information to seize the benefits of JSCC. The communication system can still achieve much of the efficiency of “tightly coupled” JSCC by matching flow specs to optimized channel operations. For example, bits requiring high reliability are sent through reliable flows (possibly with forward error correction (FEC) in the channel) and others are carried by less reliable flows without FEC. Coordination and negotiation at the two interfaces require a lot of message passing among network entities. In ÿ[13], intelligent agents (a form of mobile code) were proposed to speed up the
4
process. In order to carry out the agreed QoS coordination, a subnet (channel) must also have the ability to reserve its own resource and keep track of the service received by each flow. Although today QoS guaranteed network connections are only experimental, the next generation Internet Protocol (IP) has incorporated a 28-bit priority field plus flow label into its packet header structure to support future deployment ÿ[14]. The Internet Resource ReSerVation Protocol (RSVP) ÿ[15] and similar efforts for ATM support forms of QoS guaranteed flows. Due to the limitation of space, we have omitted a number of issues not directly related to DCVC, such as modularity, scalability, mobility, and privacy, covered in ÿ[3]ÿ[4]. Even outside this QoS flow architecture, video coding research has proposed multi-flow coders, in the name of layered coding (targeted at rate scalability ÿ[7]-ÿ[10] and error resiliency ÿ[10]-ÿ[12]). Rate and error (loss/corruption) represent two of the three key QoS parameters. Just as rate scalability and error resiliency have been integrated, ultimately a fully QoS-adaptive video coding algorithm must incorporate all three parameters. Delay is an important contributor to network capacity and resource consumption. DCVC is a step in this direction.
3 Overview of delay cognizant video coding DCVC is a component of the source coding layer in the aforementioned networking model. The multiple flows shown in Figure 3 can have different delay and reliability attributes. In this paper, we focus on delay. Its impact on network capacity will be discussed in Section ÿ6.2. DCVC takes advantage of flow delay attributes provided by the network. The segmentation of video data into the flows can have a significant impact on perceived quality. To minimize the visible artifacts arising in asynchronous reconstruction, DCVC assigns the most visually significant information to the low-delay flow and the less visually significant information to the high-delay flow. Visual significance is, at the early visual processing level, characterized by the spatio-temporal masking properties of the human visual systems (HVS), and at the cognition level, characterized by image recognition and understanding. In our current DCVC design, we mainly exploit HVS masking. Traditional single-flow video compression, such as MPEG ÿ[21] and H.261/H.263 ÿ[22], is a special case of DCVC with two flows: one has the minimal (finite) delay and the other has the maximal (infinite) delay. The second flow simply never arrives and attributes to the quantization loss.
5
DCVC has a number of potential advantages over traditional, single flow video such as MPEG and H.261. These include an increase in video traffic capacity, the reduction of perceptual delay, and the flexibility of trading off capacity and delay. More precisely: 1. DCVC reduces the traffic in the lowest delay flow without increasing perceptual delay. The traffic reduction includes lowering both the magnitude of the traffic bursts and the average bit rate. For delay-critical network video, average bit rate alone does not accurately reflect the required bandwidth. Reducing the size of the bursts is sometimes more important. 2. DCVC puts a significant portion of the data to higher delay flows. Traffic in these flows can be smoothed to further reduce the magnitude of the bursts, increasing the effectiveness of statistical multiplexing. 3. For time-varying links such as wireless fading channels, higher delay flows can be buffered for the most opportune moment for transmission. For example, as channel fading strikes, the transmitter can put off the transmission of the high-delay flow and send the low-delay flow with stronger error correction codes at a lower rate. The highdelay flow can be served later when the channel condition returns to normal. Without the high-delay flow, traditional video coding is forced to take the common denominator of link rates at all fading conditions. This argument equally applies to non-bursty, constant bit rate video. While the above arguments have emphasized network resource cost reductions, these reductions can be redirected to further decrease the delay requirement of the lowest delay flow, thereby reducing perceptual delay. There is clearly a tradeoff between reducing network resource cost and decreasing perceptual delay (improving interactivity). The cost/quality tradeoff is left to negotiations at the source/transport interface in Figure 3.
4 Coding algorithm architecture We first discuss the performance objectives of a DCVC codec: minimizing the total cost by simultaneously minimizing the portion in the lowest delay flow and maximizing the delay difference. The discussion is followed by descriptions of segmentation and compression at the encoder, as well as rendering rules at the decoder.
6
4.1 Objectives DCVC has no hard objective measure of delay, since visual information is generally displayed without synchronization. The focus is thus on perceptual delay - the delay perceived by end users. With the lowest delay flow carrying the most visually significant information, the perceptual delay is determined by the delay in the lowest delay flow. Although the number of different delay flows is arbitrary, there is a tradeoff between the flow structure overhead and the benefits brought by multiple flows. We focus on two flows, lowand high-delay, recognizing that this can be easily generalized. Should quantization loss be counted as another flow with infinite delay, there would be three flows. A DCVC algorithm attempts to optimize the network cost function while satisfying the minimum quality constraint.
min C ( R1, R2 , d ) subject to Q( R1 , R2 , d ) > q0
R1 , R2 , d
R1 and R2 are the effective bit rates of the low-delay and high-delay flows, respectively. q0 is the minimal acceptable quality and d stands for the delay offset between the two flows, assuming the delay requirement of the low-delay flow is fixed. We assume the network cost function C increases with R1 and R2, and decreases in d. Similarly, the quality function Q is an increasing function of R1 and R2, and a decreasing function of d. Aside from their first order properties, based on rate-distortion theory, Q is concave in R1 and R2 when quality is defined as the negation of distortion. The above function characteristics lead to a conclusion about the optimal bit rate allocations of R1 and R2, as described in Appendix A: Delay flow bit rate optimization. It is not always advantageous to have both flows: under the condition that the two flows have positively correlated traffic and the marginal cost increases faster than the marginal quality, the optimum is to have just one flow. However, this condition is perhaps rare. In the other cases, having the second (high-delay) flow minimizes the cost. Specifically, we show the optimal condition can be achieved as follows: 1. Minimize the network cost of the total compressed traffic, while maximizing the portion in the high-delay flow and minimizing the portion in the low-delay flow. 2. Maximize the allowable delay offset that can be attained with acceptable quality. The first objective is to reduce traffic in the low-delay flow so that minimal network resources are reserved to support its tight delay and jitter requirements. Traffic in the high delay
7
flow has relaxed delay bounds, giving the transport layer the most flexibility in transmission prioritizing and scheduling. Note that an implicit assumption of this objective is that the bit rate requirement of the low-delay flow should be less than the bit rate of the conventional, single flow video with the same quality. The second objective is to ensure the delay relaxation is sufficient for traffic smoothing purposes. We added the constraint on acceptable visible artifacts because we expect artifacts to occur with asynchronous reconstruction. Note that DCVC is not just another form of compression. The minimal goal of compression is to remove all “invisible” video information subject to HVS properties. DCVC not only removes invisible information but also delays visible and yet less visually significant information. Therefore, asynchronous reconstruction is expected to generate visible artifacts. These artifacts become more noticeable as the delay offset increases. Unfortunately, prior HVS research has revealed little about the kinds of video information that has the most impact when delayed. It is an important issue in need of further research.
4.2 Prior work Our earlier work explored a number of different segmentation criteria, but they often failed to achieve an acceptable compression ratio ÿ[16]ÿ[17]. One unreported approach we tried was pixelbased segmentation by conditional replenishment, in which segmentation is performed pixel-bypixel. In segmenting head-and-shoulder scenes, less than 5% of the total pixels are carried by the low-delay flow. The delay offset could be as great as 330 msec without incurring noticeable quality degradation2 in our experiments when they were shown with the original video. The compression of the 5% pixels turns out to be rather inefficient, however, because of irregular shapes and spread. The additional overhead of communicating the locations of the lowdelay pixels significantly increases the amount of traffic and makes it impractical for DCVC. To reduce this overhead, the segmentation granularity has been enlarged from pixels to blocks as described in this paper.
2
We wish to clarify that there may be no noticeable quality degradation even if one can distinguish the differences between the segmented and the original. When asked for quality judgements, observers tend to give statistically equal ratings. Therefore, the video “fidelity” differs but with indistinguishable video “quality”.
8
4.3 Encoding: delay segmentation The main objectives of DCVC encoding are to maximize the portion of traffic in the highdelay flow, to minimize visual artifacts after asynchronous reconstruction, and to achieve compression comparable to state-of-the-art regular video encoders. The encoder block diagram shown in Figure 4 is divided into two stages: segmentation and compression, each of which is framed in shaded boxes. In the current design, the encoder first divides the captured video frame into blocks of size 8 by 8. Each block is then independently assigned to the low- or high-delay flow, based on its temporal-spatial frequency variations. There are a total of 128 test conditions, all of which must be satisfied for a block to be assigned to the high-delay flow. Violating any of the conditions sends the block to the low-delay flow. The 128 conditions are composed of two conditions each for each DCT coefficient of the tested block. Since each coefficient is independently tested, it suffices to look at just one pair of such conditions: Condition 1: Pi , j , n,t − Pi , j , n,t −1 < Vi , j Condition 2: Pi , j , n ,t − Pi , j , n ,update < Vi , j In the above expressions, PI,j,n,t is the (I, j)th DCT coefficient for block n at time t; PI,j,n,update is the (I, j)th coefficient of block n stored in a buffer for the latest update; VI,j is a fixed preset threshold for the (I, j)th coefficient. The 8x8 table of {VI,j} used in all the reported experiments is listed in Table 1 (for 8 bit-resolution pixels). Table 1The 8x8 {Vij} table of DCT coefficient thresholds; DC value is at the upper-left corner. 30 15 15 15 15 15 15 30
15 15 15 15 15 15 30 30
15 15 15 15 15 30 30 45
15 15 15 30 30 30 30 45
15 15 30 30 30 30 45 45
15 30 30 30 30 45 45 45
30 30 30 30 45 45 45 45
30 30 30 45 45 45 45 45
The first condition is to limit the variation of a spatial frequency in two consecutive frames. The subtraction operation can be viewed as a 2-tap high-pass Haar filter operating in the temporal dimension. The second condition is to limit the variation relative to the latest update that is the
9
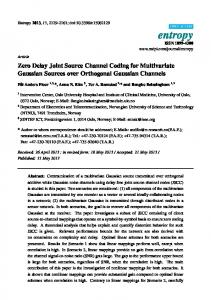
last block assigned to the low-delay flow. The two threshold blocks in Figure 4 are marked as Condition 1 (C1) and Condition 2 (C2). The temporal variation of a block typically consists of steep changes as well as small perturbations. Steep changes originate from movements of objects with sharp contrast while small perturbations may come from slow variations of textures. To minimize visible artifacts, DCVC cannot ignore steep changes and must act immediately by updating the block (region) with the low-delay flow. What DCVC can take advantage of are the small perturbations, which can be delayed in time. The first condition is to monitor steep changes of a coefficient and the second is to limit the size of perturbations. To see a simple example, we set the threshold to 15 for the following series. 40 40 40 40 40 40 40 50 60 60 76 75 … The numbers that trigger the thresholds are underlined. The choice of {Vi,j} directly affects the performance of DCVC. More blocks will be assigned to the high-delay flow, which is our objective, by simply increasing {Vij}. However, this would cause significant visible artifacts especially for low spatial frequencies. Through informal viewing experiments, we noticed higher spatial frequency components could tolerate a greater temporal variation without adversely affecting quality. This observation is consistent with early HVS studies on the roll-off of Contrast Sensitivity Function (CSF) at high spatial frequencies ÿ[6]. As indicated in the segmentation block diagram, two threshold units control the switch to selectively update blocks through the low-delay flow. The selected (low-delay) blocks are then inverse transformed back to the spatial domain and put into the low-delay image plane. An example is shown in Figure 5. For head-and-shoulder scenes, the low-delay image plane often consists of 10 to 20 percent of the total blocks. A corresponding high-delay image plane, consisting of the blocks going to the high-delay flow, is generated as a part of compression process to be described next.
4.4 Encoding: compression The compression stage as shown at the right shaded box of Figure 4, removes spatial and temporal redundancies from the segmented video. Since redundancy removal creates data dependency, the compression of the low-delay flow must not reference data in the high-delay flow. Should the condition be violated, low-delay data cannot be decompressed ahead of highdelay data, leading back to synchronous reconstruction.
10
The compression stage complies with the dependency requirement by using two separate coding loops. Our design adopts the motion estimation (ME) with discrete cosine transform (DCT) architecture ÿ[20]-ÿ[22]. The upper (lower) ME loop in the diagram corresponds to the compression of the high- (low-) delay flow. The reconstructed low-delay image plane in the ME loop is fed back to the segmentation stage as the latest update. It is also subtracted from the original video frame to obtain the high-delay image plane. Quantization errors in the low-delay ME loop are part of the input to the high-delay ME loop. Directly compressing the image planes does not turn in competitive compression performance because artificial block boundaries create many high frequency residues in differential coding. An effective solution, as we found, is to fill the empty regions (indicated by black areas) with the same blocks from the reference frame in the ME loop. Pixel values are simply copied over from the reference frame to the no-value regions. Since the first frame is always intra-coded, area filling guarantees all successive frames have no empty regions. This area filling technique is applied to both ME loops. Area filling improves compression performance by preserving the shapes of image objects and smoothing out artificial block boundaries. Blocks used in filling the empty area are not compressed for they are copied from the reference. A one-bit indicator per block is embedded in the output bitstream to inform the decoder if the coded block belongs to the low-delay flow. At the decoder, it has the same video history as the encoder does and thus area filling can be performed without any additional overhead. For the compression of the high-delay flow, the onebit indicator per block is not required because all blocks have high-delay components, some of which are quantization errors from the low-delay ME loop and some of which are normal video blocks. At the output of ME loops, rate control modules monitor output rates to ensure compliance with the QoS contract. As demonstrated later, the quantization steps of the two ME loops need not be the same and this flexibility can be exploited to further improve video quality. The rate control module in the low-delay ME loop performs adjustments of quantization steps in the conventional way. A more interesting opportunity is to make use of the module in the high-delay ME loop to control the number of high-delay blocks in a frame. With a fixed bit rate, decreasing the number of blocks to be compressed increases their coded quality. For the high-delay flow, blocks are selected based on their past history with the assumption of “delay inertia”. We presume those blocks that are less frequently updated through the low-delay flow tend to stay that way. These blocks stay on the receiver’s screen for a long time and thus need a higher quality (or
11
lower quantization error). The rate control module keeps an age record of blocks and prioritizes the selection in the descendent order of block ages. The age of a block, incremented at each frame, is reset to zero when it is either updated as a low-delay block or selected for the high-delay flow. The rate controlled encoding of blocks can be viewed as the video version of progressive image transmission. A block is updated through the low-delay flow to establish a coarse initial representation. It is then replenished through the high-delay flow with a better quality copy. Unlike image coding, video does not allow progressive coding for the whole frame. DCVC segments the video frame to regions with different updating frequencies. For high texture, slow varying regions, the rate controlled compression works well. Finally, we applied the quantization and entropy coding tables of the videoconferencing standard H.263 ÿ[22] to our design because videoconferencing is one of our target applications. The compression efficiency of both flows is listed in Table 2. Four test sequences of head-andshoulder scenes were encoded, all of which except the Carphone sequence have still backgrounds. The low-delay flow is approximately 50 to 80 percent of the total compressed traffic although it carries less than 20 percent of the blocks. The high portion is mainly because the compression of the high delay flow is far more effective. We expect further optimization in compression to reduce the total bit rate as well as the low-delay portion. Table 2 Average bits per pixel for the low- and high-delay flows; raw video is captured in 12-bit resolution or YUV9 format. As a comparison, H.263 outputs are listed at the last column. Video sequence
Low-delay flow
High-delay flow
H.263
Suzie
0.063
0.032
0.073
Salesman
0.035
0.018
0.043
Carphone
0.132
0.031
0.153
Miss America
0.028
0.024
0.034
4.5 Decoding The DCVC decoder follows a simple set of rules to display received blocks. Compressed bit streams from both flows are tagged with frame numbers as temporal references. The decoder maintains one table for each flow, in which each entry stores the temporal reference of the received block at the coordinates. The tables are initiated to zero and blocks from earlier frames are replaced with those from later frames. By comparing TRn, L, temporal reference of the nth
12
block from the low-delay flow, and TRn, H, temporal reference of the nth block from the highdelay flow, the decoder makes the following decision: 1. TRn,L > TRn,H , display the block from the low-delay flow; 2. TRn,L = TRn,H , display the sum of two blocks; 3. TRn,L < TRn,H, display the block from the high-delay flow. These rules lead to asynchronous display of blocks. These rules assume a block has a coarse representation in the low-delay flow and added details in the high-delay flow, and that the delay experienced by the low-delay traffic is always equal to or less than that of the high-delay traffic. It is possible that a block from a later frame may be transmitted through the low-delay flow but it arrives at the decoder earlier than its precedents in the high-delay flow. By the above rules, this block preempts its precedents and it is rendered upon arrival3. The occurrence of preemption is due to significant changes of some spatial frequency components, which the segmentation is designed to detect. Movements of objects and scene changes typically cause those changes.
5 Video fidelity and quality evaluation In spite of its promise of significant traffic capacity gain, DCVC must ensure the quality degradation to be acceptable even with a large delay offset. To verify that the performance of our coding algorithm is indeed satisfactory, we conducted both psychophysical and computational evaluation of DCVC video. Psychophysical studies rely on the participation of human subjects, who were shown video clips and were asked to judge their quality. For computational modeling, we used the traditional PSNR measure as well as a video quality metric developed by Lambrecht ÿ[30]ÿ[31]. In the following, we briefly describe the experiments on video fidelity and focus more on subjective quality tests.
5.1 Video fidelity In these experiments, the objective is to determine if sequences with nonzero delay offset between the two flows can be visually discriminated from the original, jitter free video rendering. 3
It is conceivable that further traffic capacity gain may be obtained by instructing the networks to stop forwarding those blocks in the high-delay flow, which are now obsolete. The annihilation of the blocks is, however, not possible in our reported design using differential coding. If they are dropped in the network, the motion compensation loop of the high-delay flow at the decoder will lose synchronization with the loop at the encoder. Annihilation can be made possible by removing the dependency and using non-differential coding for compression. Special packetization and application-aware routers must be deployed to take advantage of block preemption.
13
The video sequences used in the experiments were the luminance components of standard H.263 test clips: Suzie, Salesman, and Mother-daughter (see Appendix B: Video evaluation methods for details). Both compressed and uncompressed sequences were used. A standard self-paced psychophysical adjustment was used with 3 delay offsets (0, 1, and 2 frames) for the high delay flow. Each run consisted of 100-150 trials with correct response feedback provided after each trial. We found judgements of video fidelity to be unanimous: for both uncompressed and compressed video sequences, artifacts from asynchronous rendering are perceptible by all participating human subjects. Even a delay offset of one frame can be detected. This is not surprising since aggressive segmentation ought to create discriminable visual differences. While conducting the experiments, we also observed a learning effect. After a subject watched the same sequence 20 to 30 times, they learned to focus on specific details in the sequence for making the discrimination and ignored the rest of the image. A conferencing participant is not likely to watch the video more than once so this type of learning is unlikely to be a factor in practical application of DCVC. Therefore, we are less concerned about fidelity than perceived quality. Another interesting observation was that while delay offset was perceptible, the video quality of compressed sequences did not necessarily degrade. In fact, for some compressed sequences and some observers, the quality appeared to improve with relatively long delays. This effect appears to be related to a reduction of mosquito noise4 when delay is introduced. This observation prompted us to examine video quality in more detail.
5.2 Video quality Unlike the fidelity experiments, this set of experiments focused on evaluating the quality of compressed video. In particular, we are interested in the compression-introduced masking effect on delay segmentation artifacts. From the fidelity experiments, we know that nonzero delay offset and its accompanied asynchronous reconstruction introduce perceptual differences in uncompressed sequences. It is also known that lossy compression generates quantization noise. Furthermore, we observed that the noise contributed by compression seems to be stronger and dominates the perception of the overall video quality. Our goal in these experiments is to
4
In compressed video, distortion sometimes seen around the edges of moving objects, and characterized by moving artifacts around edges and/or by blotchy noise patterns superimposed over the objects, resembling a mosquito flying around a person's head and shoulders. (Quoted from Federal Standard 1037C, Glossary of Telecommunication Terms, 1996)
14
characterize the effect of delay on compressed video quality. The procedure of the experiments and the preparation of test sequences are described in Appendix B. Video Quality Ranking: The results from ranking the four simultaneously presented stimuli, steps 1 and 3 from Appendix B, are summarized in Table 3. The numbers in the table represent the frequencies of stimuli being ranked as the best, 2nd best, 3rd best and worst video quality when the four stimulus conditions are compared to each other. The table notations for the four stimulus conditions; high compression with no delay, high compression with twelve frame delay, low compression with no delay and low compression with twelve frame delay, are H0, H12, L0 and L12, respectively. The table frequencies represent the aggregated rankings given by the eleven subjects for the seven video sequences. Because every subject ranked each sequence four times in an experiment, the total number of data points per condition is 308. Table 3 Aggregated ranking results from 11 subjects and their choices on 7 test sequences Votes
L0
L12
H0
H12
Best
125
164
4
15
nd
134
106
25
43
rd
3 Best
39
32
106
131
Worst
10
6
173
119
2 Best
Larger numbers in this table are distributed in the upper-left and lower-right quadrants. As expected, the difference in compression level between first two columns and the second two columns had a significant impact on video quality. The impact of delaying part of the video stream on video quality is more subtle but nevertheless significant. The difference between the high compression conditions, with and without delay (H0 & H12) was significant (X2 = 23.8; p < 0.01). Similarly, the difference between the low compression conditions, with and without delay (L0 & L12) was also significant (X2 = 10.2; p < 0.05). Consider the high compression conditions, the response distribution in the H12 condition column is shifted up relative to the distribution in the H0 column which indicates the delayed video was favored over synchronous video. Similarly, for the video sequences with less compression, the response distribution in the L12 column is shifted up relative to the distribution in the L0 column which indicates the delayed video had higher quality than the normal or nondelayed video. This result is most surprising, delaying part of the video stream improved video quality for compressed H.263 video sequences. DCVC can improve network performance and improve video quality at the same time, a finding that has important implications for future low bit rate video coding.
15
Video Quality Ratings: The video quality ranking results were unexpected. If delay segmentation improves video quality for a fixed perceptual delay in side by side comparisons, would it still be observable when sequential video quality assessments are made? Two sets of quality ratings using the same stimuli were gathered about 30 minutes apart for each subject. Test-retest analysis of the two data sets indicates they can be safely combined into one data set.5ÿ[28]ÿ[29] Since video content might have impact on video quality for DCVC sequences, we evaluated the effect of DCVC separately for each sequence. A three-way repeated measures analysis of variance (treatments-by-treatments-by-subjects design) was performed on each of the seven video sequences. The results for each video sequence are shown in Table 4. The first three columns contain the F-ratios for the main effect factors: compression, delay, and subject respectively. Subject is incorporated in the analysis because observers applied different ranges of feedback scores. Some subjects like to use one to five while others like to use one to ten. Factors that had a significant effect on video quality are indicated by an asterisk. The last four columns contain the mean video quality rating for the four conditions. For all video sequences, the compression level has a significant effect on video quality. However, the delay factor was significant (p q 0
(Eq A1)
R1 , R2 , d
R1 and R2 are the average bit rates of the low-delay and high-delay flows, respectively. d stands for the delay difference (or delay offset) between the two flows. q0 is the minimal acceptable quality. As stated in (Eq A2), the perceived quality function Q marginally increases with R1 and R2, and marginally decreases with d. It is known that the rate-distortion curve is a convex function ÿ[32]. If we view quality as simply the negative of distortion, say Q = constant-D, in the range of normal viewing quality, we can conclude the quality function Q is concave as stated in (Eq A3). The concavity of Q means the marginal quality improvement decreases as the rate increases. ∂Q ∂Q ∂Q ≥ 0, ≥ 0, ≤0 ∂R1 ∂R2 ∂d
∂ 2Q ∂R1 2
≤ 0,
∂ 2Q ∂R2 2
≤ 0,
(Eq A2)
∂ 2Q ≤0 ∂R1∂R2
(Eq A3)
Theorem A1 For a given d = d0, Q is a concave function of R1 and R2.That is, Q( R1 , R 2 ) + Q( R1 + ∆R1 , R 2 + ∆R 2 ) ∆R ∆R 2 ) ≤ Q( R1 + 1 , R 2 + 2 2 2
(Eq A4)
Sketch of the proof of Theorem A1: First consider the case ∆R1 and ∆R2 are small. Take the two-variable Taylor series expansion on both sides of the equation. The zero order and first order terms are equal on both sides. When the second order derivatives are nonpositive as stated in (Eq A3), the lefthand side of (Eq A4) is smaller than its righthand side. Because of small ∆R1 and ∆R2 , one can ignore the contribution of higher order terms. Thus (Eq A4) holds. Since this is true for two neighboring points, the proof can be generalized to the case of two distant points by successively dividing the interval to smaller pieces. See ÿ[33] for the complete proof. From
the
above
theorem,
{(R1 , R2 ) Q( R1 , R2 , d ) = q 0 }
we
know
that
the
equi-quality
(EQ)
points
of
thus must form a decreasing, convex curve like the one shown in
Figure 10. Its convexity is assured because it is the inverse of an increasing concave function. Example: Coding two independent Gaussian sources It can be verified that EQ curves of coding two independent, discrete time, continuous amplitude Gaussian sources are convex. It is known that the rate-distortion function of a Gaussian source is: D ( R ) = 2 −2 R ⋅ σ 2
(Eq A5)
where σ 2 is the variance of the Gaussian distribution. Let Q( R1 , R 2 ) = k − D ( R1 ) − D ( R 2 ) be the total quality of the two independent sources. Then {(R1 , R2 ) Q ( R1 , R2 ) = q 0 } can be shown to satisfy the following condition. Its EQ curves are convex.
25
2 −2 R1 + 2 −2 R2 = const
(Eq A6)
Similar to the quality function, the network cost function C marginally increases with R1 and R2, and marginally decreases with delay offset, d. As stated in (Eq A7), the marginal cost of R1 is always greater than that of R2 because of higher connection cost to deliver low delay traffic. ∂C ∂C ∂C ≥ ≥ 0, ≤0 ∂R1 ∂R2 ∂d
(Eq A7)
It is less clear about the second-order structure of the cost function. Nevertheless, one can make reasonable assumptions about the shapes of equi-cost (EC) curves. With finite delay bounds, R1 and R2 should no longer be measured as long-term averages. Instead, they should be estimated as the effective bandwidth (EB) of individual flows ÿ[26] (also see Appendix C: Effective bandwidth of a two-state Markov modulated fluid model). The concept of effective bandwidth was proposed to address the bandwidth reservation issue of stochastic bursty sources such as video. Published work on EB addressed separately the scenario in which traffic sources are correlated with the same delay requirements, and the scenario in which independent sources with differential delay requirements in prioritized queues. In the two-flow DCVC case, their output traffic, with differential delay requirements, may be correlated. Since this scenario is yet to be studied, we can not reference published results to justify the following claims on the properties of EC curves. Instead, we try to make these assumptions reasonable. When the two flows are negatively correlated in traffic, meaning (loosely speaking) an increase in bit rate of one flow corresponds to the decrease of the other, and both have the same delay requirements, it is known that EB of both flows is smaller than the sum of EB of individual flows. To see a simple example, consider the case of two on-off traffic sources with their phases perfectly out of synchronization. When a source is in the on state, it transmits at rate Rp. When it is in the off state, it stops transmission. The EB of each source is greater than Rp/2 and therefore their sum is greater than Rp. However, since they are negatively correlated and out of sync, EB of the total traffic is just Rp. The same argument applies to positively correlated traffic sources. The two-flow DCVC case has differential delay requirements and thus the above observations on EB can not be directly applied. Nevertheless, we believe in most occasions, network carriers can take advantage of the positive/negative correlation and reflect it to costs. We assume the EC curves of negatively correlated flows are concave and the EC curves of positively correlated flows are convex. Figure 11 illustrates the two cases.
26
The optimization problem may be solved by the Lagrange multiplier method. When a positive multiplier exists, (Eq A8) states the sufficient condition for obtaining the optimal values of R1, R2, and d. ∂Q ∂Q ∂Q ∂R1 ∂R2 = = ∂d ∂C ∂C ∂C ∂R2 ∂d ∂R1
(Eq A8)
From (Eq A7) and (Eq A8), it is concluded that the marginal quality with respect to R1 is greater than the marginal quality with R2. ∂Q ∂Q ≥ ∂R1 ∂R2
(Eq A9)
Since Q is concave in rates, the optimal rate allocations of R1 and R2 must be unique and minimized. Furthermore, (Eq A9) indicates the optimal value is biased against R1. Further understanding of the optimal rate allocations can be approached by analyzing EC and EQ. As shown in Figure 12, the tangent points of a given EQ and its minimal EC may happen at the middle of the curve or at one of its end points. The three cases are summarized and discussed in below. Case (A1): Both EC and EQ are also convex. The curvature of EC is greater than that of EQ. The optimum is at an end point. Case (A2): Both EC and EQ are also convex. The curvature of EC is less than that of EQ. The optimum is at a tangent point in the middle of the curve. Case (B): Both EC and EQ are concave. The optimum is always at the middle of the curve. While (A2) and (B) encourage the addition of the second flow to reduce costs, case (A1) gives its preference to the single flow case. In (A1), the two flows are positively correlated and the marginal quality gain introduced by the second flow is less than the marginal cost increase. Hence, the use of the second flow is not justified. When both flows are applied, the optimization settles to the point that minimizes the bit rate allocation to the low-delay flow. Figure 13 illustrates that in the portion of the line R1+R2 above the EQ curve, the optimum has the smallest R1. Note that unless both flows have the same marginal costs, the optimum typically does not coincide with the value obtained by minimizing R1+R2 directly.
27
Appendix B: Video evaluation methods Eleven paid volunteer subjects from the UC Berkeley campus participated in the experiments in January, 1998. The seven raw video sequences used in the experiments are standard H.263 test clips: Carphone, Claire, Foreman, Miss America, Mother-daughter, Salesman, and Suzie. The test sequences are available from ITU and its members. They are stored in the 4:2:0 QCIF format (176 by 144 pixels). For both the fidelity and quality experiments, only the luminance component of the video was used. Each sequence was 2.5 seconds long (75 frames) and was presented on a Sony Trinitron monitor at 60 Hz (two scans per frame). MATLAB with the PC-MatVis (www.neurometrics.com) psychophysical testing and stimulus presentation extension were used to present the stimuli and gather the rating data. Among the encoded sequences, the number of low-delay blocks was between 10 to 20 percent of the total. The actual percentage is content dependent. For nonzero delay offset sequences, we applied the same amount of delay uniformly, in the units of frame display time (1/30th of a second), to the video data in the high-delay flow. The test sequences were generated with two independent variables, delay and compression. Each variable had two levels for a total of four stimulus conditions per sequence. We investigated not only the effects of delay offset but also the effects of compression-introduced masking. •
Compression level: The first frame (the only I frame) of all four stimulus conditions was compressed at the same quantization level and thus contained identical information. The amount of compression-introduced noise in subsequent frames is controlled by the quantization level (QL). All 64 DCT coefficients of inter-coded blocks are quantized with the same level. Increasing the quantization level decreases the video quality and vice versa. In stimulus conditions 1 and 2, QL was set to 10 for all seven sequences. In stimulus conditions 3 and 4, QL was set to 12 to compress Salesman, Mother-daughter, and Miss America while the other four were compressed with QL equal to 13. Depending on the video content, a decrease of QL from level 12 to 10 increases the compressed bit rate by 20 to 50 percent.
•
Delay level: Synchronous, zero-delay-offset video reconstruction was applied to conditions 1 and 3. A delay offset of 12 frames (~400 milliseconds) between the lowand high-delay flows was applied to stimulus conditions 2 and 4. Nonzero delay offsets lead to asynchronous video reconstruction.
The procedure of evaluating video sequence quality involves the following three steps.
28
1. Simultaneous Presentation Quality Ranking: All four stimulus conditions (video clips) were presented simultaneously, two across and two down on the screen. Stimulus locations were chosen randomly. The 2.5-sec long presentation was repeated ten times (additional viewing time was available as desired by the subject). The subjects were asked to rank order the four stimuli using their own subjective criteria for quality. 2. Successive Presentation Quality Rating: Each of the four stimulus conditions was presented individually in random order for a total of 20 trials, 5 for each condition. Each stimulus presentation lasted 5 seconds (two repeats). After each stimulus presentation, the subject was asked to rate the image quality on a scale of 0 to 9. Subjects were not told that only the four stimulus conditions seen earlier were being presented again. They were told that the four stimuli that appeared in step 1 bracketed the range of quality levels to be presented in this step of the experiment. 3. Repeat: Finally, step 1 above was repeated using the same stimulus conditions. Subjects were not informed that the stimulus conditions in steps 1 and 3 were in the same screen locations. To evaluate consistency of the subject responses, the three steps above were performed for all seven sequences and then repeated. It took each subject about an hour to finish the experiment. The most often received comment from our subjects was the difficulty in rating video quality in step 2. With highly compressed sequences, different patterns of noise appeared in different parts of the image and were varying over time. In preliminary studies, when step 2 was performed alone subject rating criteria for video quality appeared to shift over time generating “inconsistent” results. We found that step 1 helped in reducing the inconsistency by presenting four stimuli simultaneously. The longer viewing time gave subjects an opportunity to study the stimuli and establish stable criteria.
Appendix C: Effective bandwidth of a two-state Markov modulated fluid model In the following, one effective bandwidth formulation is briefly described. Significant amount of research on effective bandwidth in recent years leads to a number of different formulations and proposals ÿ[23]-ÿ[26]. While these work differ in the stochastic models for traffic streams, they are essentially based on large deviation estimates of the loss probability in the asymptotic regime of large buffers. As the buffer size increases, the loss probability approaches zero at an exponential rate. As one might have expected, for a fixed buffer size, the effective bandwidth of a source approaches its peak rate when this probability decreases to zero.
29
Consider a Markov-modulated model for a video stream with different bit rates in different states. Let the required loss probability be expressed as e-δB, where B is the buffer size. It is shown in ÿ[25] that the effective bandwidth of the model can be expressed as Λ(δ)/δ, where Λ(δ) is the log spectral radius function of the matrix [Pijeδµi]. Pij is the transition probability from state i to state j and µi is the bit rate at state i. The compressed video streams used in our experiments can be approximated by a two-state Markov-modulated model. The above stochastic matrix can be shown to be:
[P e ] =
(1 − p12 )eδµ1 p21eδµ 2
δµ i
ij
p12 eδµ1 ÿ (1 − p21 )eδµ 2
(Eq C1)
Its log spectral radius function is the logarithm of the largest positive eigenvalue, which has a simple closed form solution for this 2x2 matrix. Λ (δ ) = log
b(δ ) + b 2 (δ ) − 4a(δ )
(Eq C2)
2
a (δ ) = (1 − p12 − p 21 ) e δ ( µ1 + µ 2 ) ; b (δ ) = (1 − p12 ) e δµ 1 + (1 − p 21 ) e δµ 2
(Eq C3)
One set of values for these parameters are given in Section ÿ6.
Figures
DCVC Encoder
Network
DCVC Decoder
Figure 1 An illustration of differential delay flows and asynchronous reconstruction; the top path is shorter and thus the block arrives earlier than the other.
Video over LAN
Video over ATM
Video over wireless
Channel: Copper/ Ethernet
Channel: Fiber/ SONET
Channel: Radio/ IS-95
Figure 2 An example of tightly coupled joint source-channel coding. Published research on video illustrates designs tailored for specific media such as video over LAN, ATM, or wireless.
30
Source coding (audio, video, data)
Flows Source/Transport Interface Flow specification {delay, loss, rate}
Transport (networking, routing, scheduling, billing) Channel: Copper/ Ethernet
Channel: Fiber/ SONET
Transport/Channel Interface Link QoS
Channel: Radio/ IS-95
Figure 3 The three-layer architecture reference model for loosely couple joint source-channel coding. Compression Video source frame
DCT+Q
AF
RC
High delay loop Q-1+DCT-1
ME
Segmentation DCT-1
DCT
RC
DCT+Q
AF
C1
Low delay loop
DCT C2
Q-1+DCT-1
ME
AF-1
DCT
AF-1
DCT
Discrete cosine transform
ME
Motion estimation
AF
RC
Rate control
Threshold
Delay/buffer
Area filling
Figure 4 DCVC encoder block diagram; the two stages are framed in shaded boxes; -1 appeared in a function block represents inverse operations.
31
Figure 5 The original (left), the low-delay (center) , and the high-delay (right) image planes of three consecutive frames of the Suzie sequence. The empty regions are shown in black. Note that for clarity in comparison, area filling was not applied to these images.
Original
Jitter free
Long delay
Figure 6 A qualitative illustration of the condition when delayed video looks better.
32
Source 1 Case a: Source 2 Ta Source 1 Case b: Source 2 Tb Figure 7 An illustration to show the availability of the residual rate depends on traffic behavior of incoming sources. Solid lines represent actual traffic arrivals and dotted lines represent their effective bandwidths. Residual rate becomes available when neither of the two sources are sending bursts. As the two cases illustrate, Source 1 cannot predict in advance the length of the available period.
Two-flow video
Low-delay-flow only video
38 37 36
PS N 35 R 34 in dB 33 32 31 30
1
22 43 64 85 10 12 14 16 19 21 23 25 27 29 31 33 35 37 40 42 44 6 7 8 9 0 1 2 3 4 5 6 7 8 9 0 1 2
Frame number
Figure 8 PSNR comparison in video quality of the low-delay-flow-only vs. DCVC two-flow video sequences.
33
Single-flow traditional video
Two-flow DCVC
34
PSNR in dB
33
32
31
442
421
400
379
358
337
316
295
274
253
232
211
190
169
148
127
106
85
64
43
22
1
30
Frame number Figure 9 PSNR plots of H.263 and DCVC video to show comparable quality with 30% less bandwidth saving for DCVC.
R1
R2 Figure 10 An equi-quality function that satisfies Q(R1, R2, d) = q0.
R1
R1 Positive Correlation Negative Correlation
R2 Figure 11 Equi-cost functions that satisfy C(R1, R2, d) = c0.
34
R2
Equi-quality R1
R1
Equi-cost
(A1) (B) (A2) R2
R2
Figure 12 Use equi-cost (dotted line) and equi-quality (solid line) curves to find the optimal rate allocations. The three possible optimal operating points are marked with black dots. R1 (low-delay flow)
Equi-quality Equi-cost R1 + R2 = total bit rate R2 (high-delay flow) Figure 13 The minimization of the total bit rate and its low-delay portion. The marked point has the lowest bit rate for the low-delay portion.
35