Dense Multi-Stereo Matching for High Quality Digital Elevation. Models. NORBERT HAALA & MATHIAS ROTHERMEL, Stuttgart. Keywords: DEM, surface, point ...
Dense Multi-Stereo Matching for High Quality Digital Elevation Models NORBERT HAALA & MATHIAS ROTHERMEL, Stuttgart Keywords: DEM, surface, point cloud, image matching, geometry Summary: Until recently, the acquisition of high quality digital elevation models was dominated by the use of airborne lidar. However, meanwhile the increasing quality of digital airborne cameras in combination with recent improvements in matching algorithms allow for an automatic image-based acquisition as a suitable alternative. Within the paper, this progress will be demonstrated on the example of photogrammetric DEM generation using the semi-global matching (SGM) stereo method. Since this approach aims at pixel-wise matching, dense 3D point clouds can be generated. The tests described in the paper are based on data collected from different digital airborne cameras at various flight scenarios during a recent test on photogrammetric 3D data capture. Thus, the impact of different stereo configurations on the quality of the final outcome can be evaluated and compared to test results already available. Special interest is also paid to the combination of multiple stereo pairs with different base-to-height ratios, which can be used efficiently to increase the precision and reliability of the matching results. Zusammenfassung: Hochwertige Digitale Höhenmodelle aus dichter Mehrbildstereozuordnung. Die Erzeugung digitaler Höhenmodelle wurde bis vor kurzem durch den Einsatz von Lidar dominiert. Durch die verbesserte Qualität von Kamerasystemen und die voranschreitende Entwicklung bildbasierter Zuordnungsverfahren stellt die Datenerfassung mittels Luftbildkameras mittlerweile eine ernstzunehmende Alternative dar. In diesem Artikel wird dieser Fortschritt anhand des Beispiels der photogrammetrischen DEM Generierung durch Semi-Global Matching (SGM) aufgezeigt. Mittels dieser Methode werden pixelweise Zuordnungen zwischen zwei Bildpaaren erhalten, so dass extrem dichte Oberflächenmodelle generiert werden können. Für die in diesem Artikel durchgeführten Tests wurde Bildmaterial unterschiedlicher Kamerasysteme und Flugkonfigurationen untersucht. Dabei wurde unter anderem auf Daten im Rahmen kürzlich durchgeführter Tests zur Untersuchung photogrammetrischer Datenerfassung zurückgegriffen. So kann der Einfluss von flugspezifischen Parametern auf die erhaltene Resultate evaluiert, und selbige mit bestehenden Ergebnissen verglichen werden. Spezielle Beachtung findet außerdem die Fusion mehrerer Stereomodelle resultierend aus Bildpaaren unterschiedlicher Basis-Höhenverhältnisse. Dies ermöglicht eine Steigerung hinsichtlich der Genauigkeit und der geometrischen Qualität.
1 Introduction For a considerable period, the acquisition of high quality digital elevation models (DEM) was dominated by the use of airborne lidar. Meanwhile, automatic image-based data collection has been revived as a suitable alternative. This development was triggered by the increasing quality of digital airborne cameras as well as recent innovations in matching algorithms. Airborne imagery of good dynamic range and signal-to-noise ratio as it is generated by digital aerial cameras is highly beneficial for automatic image matching. This is especially true for surfaces with relatively little surface texture. Consequently, the quality and precision of image-based point transfer as the basis for 3D surface reconstruction has been improved considerably. Recent tests have already demonstrated the feasibility of image matching as a valid alternative to airborne lidar (HAALA et al. 2010, LEBERL et al. 2010). Commercial image matching software tools used for DEM generation are still based on algorithms established a relatively long time ago. Usually, they apply standard feature and intensity-based matching. However, standard feature-based approaches can suffer from regions of a rather limited number
of matched points in areas of low image texture. On the other hand, with intensity-based approaches, the minimum size of correlation windows frequently results in smoothing effects. This is especially disadvantageous at object borders and height discontinuities. These limitations of traditional approaches can be overcome by current algorithms aiming at a high resolution DEM computation. One example is the semi-global matching (SGM) stereo method as proposed by (HIRSCHMÜLLER 2008), which provides a match for each image pixel. Thus, a computation of dense 3D point clouds and DEM at resolutions similar to the ground sampling distance of the available imagery is feasible. The potential of the SGM algorithm was already demonstrated for different applications and datasets, including aerial images, satellite data or video sequences. This was our motivation to implement and use SGM for our evaluations on dense image matching. In addition to suitable stereo matching algorithms, the quality of image-based surface reconstruction mainly depends on the proper combination of multiple image information. Multi-view stereo reconstruction has a considerable tradition in photogrammetry (GRÜN & BALTSAVIAS 1988) as well as for close range applications in the computer vision community. As also documented by the performance evaluation of multi-view stereo reconstruction algorithms (SEITZ et al. 2006), a number of highquality algorithms are available and the state-of-the-art still improves rapidly. Similarly, airborne scenarios also benefit from multiple overlapping stereo pairs. This enables a reliable elimination of outliers and reduction of high frequency noise in DEM generation. In our investigations, dense image matching was evaluated for multiple stereo configurations as available from highly overlapping image flights. The multi-stereo matching algorithm is briefly introduced in the section 2, whereas the quality of our dense DEM generation is presented in section 3. For this purpose, two different test areas are used. First, matching results for a planar sports field are investigated. For this area, datasets from a recent project on digital photogrammetric camera evaluation, initiated by the German Society for Photogrammetry, Remote Sensing and Geoinformation (DGPF) are available (CRAMER 2010). The data contain imagery from several large format aerial cameras, thus the potential of our dense matching for different camera systems and illumination conditions can be demonstrated. Furthermore, existing results from the DGPF project produced with commercial software tools and generated from the lidar data can be used as benchmark for our approach. The second test demonstrates the benefit of highly overlapping imagery for consistency checks and quality evaluation for built-up test regions of higher geometric complexity. For this purpose, a test flight with nominal forward and side laps of 80% and 70%, respectively, was evaluated.
2 High-resolution DEM from Multi-Stereo Matching The determination of 3D point clouds at densities corresponding to the resolution of the available stereo images requires matching results for each image pixel. Since such a per-pixel measurement is highly ambiguous, additional constraints such as the assumption of a smooth surface are usually introduced. Algorithms that globally minimize matching costs between corresponding pixels and the respective smoothness constraints are called global image matching techniques. These algorithms provide good results in terms of quality and resolution, but usually suffer from a high complexity and large computational effort. However, this computational complexity can be reduced significantly by the semi-global matching (SGM) stereo method. This approach, used for our investigations, approximates a global approach by minimizing matching costs by aggregating them along a certain number of 1D paths in several directions through the image. In this way, the pixel-wise SGM approach provides a dense point distribution, while the approximation of global cost optimization by cost aggregation on 1D paths allows a reasonable runtime on large images.
2.1 Semi-Global Matching Our implementation of the SGM algorithm is similar to (HIRSCHMÜLLER 2008) to a large extent. In all tests a combination of the census and the mutual information matching cost was used. Both costs have been proven to perform well in (HIRSCHMÜLLER & SCHARSTEIN 2009). As the census cost can be
computed without any initial disparity estimation, it is utilized in our implementation for matching the low-resolution images during the implemented coarse-to-fine matching. The final matching step at the highest resolution level is the realized by exploiting the mutual information matching cost.
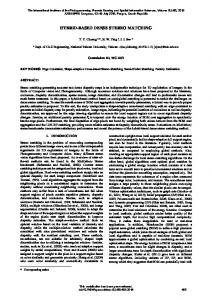
Fig. 1: Base image of stereo pair with corresponding parallax image. Fig. 1 depicts an exemplary result of the matching process. Base and search image are normalized into epipolar geometry. The parallax image produced by SGM is shown on the right. It provides the disparity for each pixel in the base image (left) with respect to the search image. Within this disparity image, black areas are visible. They correspond to wrong parallaxes of the raw SGM results that were eliminated by a filter algorithm. This filter was realized by a simple consistency check with changed roles of base and match images during matching. Only disparity estimations consistent to this forward-backward matching are then considered as valid. Additional erroneous disparity estimations are removed by filtering speckles in the disparity images and a subsequent occlusion check (HIRSCHMÜLLER 2008).
2.2 Object Point Triangulation The matching process provides parallaxes, which link corresponding pixels between two images. After parallax estimation, object point coordinates are computed by spatial intersection using the corresponding pixel coordinates in the stereo pair as defined by the disparity images. In our implementation, the spatial intersection method described by (HARTLEY & ZISSERMAN 2004) is used, which allows for a computationally efficient solution. There the transformations x = (x,y,1)T = PX and x´ = (x´,y´,1)T = P´X of object points X into the two image planes are given by the projection matrices P and P´. These matrices represent the respective orientation parameters from bundle block adjustment. The projections are reformulated to x × (PX) = 0 and x´ × (P´X) = 0. In (1) and (2) the equations are formulated explicitly.
x p3T X p1T X 0 y p3T X p 2T X 0
x ' p '3T X p '1T X 0
x p X y p X 0 2T
y ' p '3T X p '2T X 0
(1)
1T
xp3T p1T yp3T p 2T A 3 T 1 T x 'p ' p ' 3T 2T y 'p ' p '
x 'p ' X y 'p ' X 0 2T
(3)
1T
(2)
In (1) and (2) the term piT denotes the i’th row in the 3×4 camera matrix. Using these equations, a linear system of equations of the form AX = 0 can be generated with A given in (3). This system is solved using an SVD to compute the coordinates of object point X.
2.3 Multi-Stereo Matching Traditional airborne photogrammetry used to limit the cost for film material and the effort for manual stereo measurement by minimizing the number of images to be collected and evaluated. This was realized by the typical 60% forward and 20% sideward overlap of images. In this way, the availability of one stereo image pair for each object point and a block geometry of suitable stability could be guaranteed. Meanwhile, extra costs for additional image acquisition can almost be neglected by using digital photogrammetric cameras. Thus, 80% forward overlap can be easily generated. In contrast, the increase of available side lap requires additional flight lines, which will increase the costs since more flying time is required. However, flights with 60% side lap are already realized for applications such as true orthophoto generation (BRAUN 2003). In this context, multiple overlapping images are required especially in dense urban areas to fill areas that are occluded in some of the images.
Two image pairs
Four image pairs
Six image pairs
Fig. 2: Potential multiple stereo configurations in a 80%/70% overlapping image block. Overlaps of 80% along track and 60% across track will result in at least 10 images per object point. This is a considerable increase of redundancy compared to two image rays as available for imagebased surface reconstruction from traditional photogrammetric blocks. These multiple image rays can be used to eliminate mismatches by suitable filter processes and increase the accuracy of image-based 3D point cloud generation. In our implementation, the link between pixels in multiple images representing the same object point is established by defining a central image as the base image, which is then matched with the surrounding images. Depending on the respective flight and camera parameters, different configurations are feasible. Fig. 2 gives some exemplary configurations, which presume imagery captured with 80% forward and 70% side lap. The blue rectangle with the bold outline in Fig. 2 represents the base image in the centre. This base image is then matched with the respective search images, which are also represented by blue rectangles. Fig. 2 (left) thus represents a configuration, where the base image is matched with its two nearest neighbours in flying direction. These two match images thus define two stereo image pairs with the base image. Fig. 2 (middle) shows a configuration where the base image is matched with all possible images of the same strip. For 80% forward lap, this results in four image pairs. Finally, Fig. 2 (right) includes two additional images from the upper and lower adjacent strips. Sufficient overlap with respect to the base image is available due to the 70% side lap. Matching n images to a common base image results in 2(n+1) pixel coordinates to determine the object point Xi . The corresponding measurements consist of pixel coordinates xb in the base image and the respective pixel coordinates xmi in the multiple match images. Consequently, matrix A for calculating the object point Xi in (3) changes to
xbpb 3T pb1T 3T 2T ybpb pb 3 T x p p m11T m1 m1 A ym1 p m1 3T p m1 2T 3T 1T xm2 p m2 p m2
(4)
Now, A contains two rows for the base image pixel xb and two rows for each of the match images xmi. Each additional search image matched with the base image will add one image ray per point and thus improves the geometric quality of the object points. In this configuration n stereo pairs showing the same object point will provide 2(n+1) observations. Object point triangulation is again realized by solving the system AX = 0. In principle, this provides an intersection of image rays defined by the corresponding pixel coordinates and projection matrices. However, errors both from aerial triangulation and disparity measurement by SGM will result in small deviations of these image rays from the estimated object point. Thus, the least-squares solution of the linear system AX = 0 can be used to measure the uncertainties of the point Xi in object space, with its accuracy derived from the diagonal elements σX2, σY2 and σZ2 of the covariance matrix σ2(ATA)-1 . Despite of the fact that this method is comparably fast, one has to keep in mind that only an algebraic error is minimized. Therefore, the influence of ray geometries resulting from the different camera configurations might not be handled optimally. Matches from stereo pairs with larger baselines provide a better intersection geometry and thus are advantageous for the determination of the point elevation. To take this into account more properly, one topic of our future work will be the integration of strategies minimizing the geometric error by using the Levenberg-Marquardt algorithm or an alternative linearization of the spatial intersection problem. The disparity images still contain outliers. Based on the redundant determination of the object points the outliers are removed. The system AX = 0 using (4) is solved for all available measurements xmi. The resultant object point is re-projected into each match image according to x ˆ im Pmi X and afterwards, the residuals rmi xim x ˆ im
are calculated. The measurement corresponding to the largest 2
rmi is removed if this largest value r is greater than a stereo model-dependent threshold ti. The object point coordinates are then determined from the remaining measurements. This procedure is repeated until all remaining residuals fulfil the threshold condition. If less than two detections xmi remain, the triangulation is aborted. The thresholds t i are computed for each matched image individually by propagating the average expected object point accuracy to the respective image, considering the parameters of the stereo model that image forms with the base image. In a first step all object points Xi are computed from all corresponding matches without removing any outliers. Then the standard deviations σZi2 of all Xi are derived by the covariance matrices and averaged. Object points with σ Zi2 > 3∙σZmean are discarded, and σZ,mean of the remaining object points is recalculated and propagated into each match image. With focal length f, stereo base B and height over ground H the standard deviation σI in image space is
I
f B Z,mean . H2
The final thresholds are then derived by t = 3σI
(5)
3 Performance of Semi-Global Matching In order to evaluate 3D point cloud generation by dense matching, test data available from the DGPF project on digital photogrammetric camera evaluation (CRAMER 2010) are used. These data have already been used to evaluate commercial matching software (HAALA et al. 2010). Thus, a comparison with our implementation is feasible. The DGPF dataset includes lidar point clouds as a reference as well as imagery from several different airborne camera systems with nominal ground sample distances (GSD) of 20 cm and 8 cm. For reasons of simplicity our tests presented in section 3.1 were limited to 8 cm GSD imagery. The test area is defined by a planar soccer field, which eases the respective accuracy evaluations. In section 3.2, multiple image matching formerly proposed in (HAALA 2011) is investigated for an area of higher geometric complexity. The benefits of multiray photogrammetry are demonstrated by a test flight with 80% forward and 70% side laps, respectively. For this purpose, aerial imagery captured by Vexcel’s UltraCamXp at a GSD of approximately 10 cm is used.
3.1 Investigations at a Planar Test Area
DMC
UltraCamX
RMKTop15 Fig. 3: Test region ‘sports ground’ with horizontal surface and homogenous texture. The first test area, ‘sports ground’ depicted in Fig. 3, is a planar soccer field, which was also used for the investigation of commercial matching tools (HAALA et al. 2010). This allows for the comparison of our results to those achieved by the commercial software tool MATCH-T DSM. Since the test area features rather low surface texture, it is also well-suited for evaluating the performance of matching approaches in potentially challenging areas. Thus, in a first test, the precision, accuracy and robustness of SGM regarding different sensors and varying flight-specific conditions, e.g. with respect to illumination, is evaluated.
3.1.1 Robustness and Noise Regarding Varying Sensors and Illumination Conditions In order to examine the performance of SGM for different sensors and varying illumination conditions, the matching success rate and sub-pixel accuracies are analysed. Stereo models of the planar sports ground were generated using imagery of the three camera systems UltraCamX, DMC and RMKTop15. Obviously, the quality of 3D point clouds at planar areas like the soccer field can be influenced positively by specifying large smoothness constraints for SGM. This is avoided in our investigations by using the same standard set of penalty settings for all camera platforms. Tab. 1: SGM for single stereo pairs at test area ‘Sportsground’ for 8 cm GSD imagery. DMC UltraCamX ALS Sensor Base-to-height ratio 0.29 0.26 Matching success rate (%) 99.9 99.9 Point density (pts/ m2) 143.3 141.5 11.2
r before filtering (cm)
4.20
3.57
1.52
r after filtering (cm)
4.12
3.19
1.50
I (pix)
0.14
0.10
-
Tab. 1 provides the results of SGM matching for DMC and UltraCamX imagery. In order to obtain comparable results, stereo image pairs of similar base-to-height ratios of 0.29 and 0.26, respectively, were used. In order to determine the accuracy of the generated 3D point clouds at the planar sports field, an approximating plane was estimated and the respective point-to-plane residuals were computed to provide the RMS errors σr. Mismatches were eliminated by removing points with residuals >3σr. After this filtering the standard deviation of object-point-to-plane residuals were recalculated to provide r after filtering. These errors in object space were then propagated to image space using (5) to compute the accuracies σI in image space after filtering. For comparison, Tab. 1 additionally includes point cloud quality parameters of lidar measurements obtained from an ALS50 scanner. As can be seen in Tab. 1, stereo matching provides rather complete surface reconstructions at matching success rates larger than 99% and point densities larger than 140 pts/m2. The number of points is significantly larger than the one provided by the ALS50. As expected, the lidar data is more accurate than SGM results, which nevertheless provide accuracies better than 5 cm. As mentioned before, image-based precision measures were derived by error propagation; the image-based measures obtained for SGM are smaller than 0.14 pixels. Tab. 2: Results for single stereo pairs at test area ‘sports field’ based on SGM and 8 cm GSD imagery, base-to-height ratios 0.51 – 0.57. Sensor
DMC
UltraCamX
RMK
Base-to-height ratio
0.57
0.51
0.56
Matching success rate (%)
99.9
97.6
99.9
r before filtering (cm)
2.35
2.05
2.86
r after filtering (cm)
2.16
1.97
2.68
I (pix)
0.15
0.12
0.19
In the DGPF project, RMK imagery is only available at base-to-height ratios of 0.56. Therefore also image pairs of DMC and UltraCamX where matched providing base-to-height ratios of 0.57 and 0.51 respectively. As shown in Tab. 2 the matching success rates of RMK imagery amounts to 99.9%
which is in the same range as for the digital systems. Again σr represents the standard deviation of object-point-to-plane residuals, I accuracies in image space derived by error propagation of σr after removing outliers. The point densities of surfaces derived by UltraCam imagery are little lower than for DMC imagery. This is because of some low-textured areas in the UltraCam images where the matching fails. The standard deviations of point-to-plane residuals of the RMK data are slightly higher and a value of 2.9 cm is obtained, which corresponds to a matching accuracy of 0.19 pixels. It has to be mentioned, that the DMC and RMK images were recorded almost simultaneously at identical atmospheric and illumination conditions during the same flight. In contrast, the UltraCam flights were captured two months later. Thus, differences of the illumination that influenced the matching quality could not be avoided. This e.g. happened in areas of little texture such as the sports field. It must also be kept in mind that errors based on a comparison to approximating planes as presented in Tabs. 1 and 2 mainly represent the internal matching precision. A comparison to the lidar data shows that the differences between the respective planes are in the range of errors induced by the bundle block adjustment. For the datasets of the DGPF projects the vertical errors are in the order of 1/2 GSD (JACOBSEN et al. 2010). 3.1.2 Comparison with Tests using Commercial Software Systems For comparison, point clouds of the test area ‘sports ground’ were also computed using the commercial software MATCH-T DSM, which solves the correspondence problem using feature-based and least-squares matching techniques (LEMAIRE 2008). Similar to MATCH-T DSM, which uses all available images for object point generation, our SGM results are based on all available stereo pairs of one image strip. Depending on the available overlap for the respective datasets, this provided two image pairs for the DMC, five image pairs for the UltraCamX and one image pair for the RMK. SGM was again parameterized by the standard values. Object points were triangulated from all available measurements and accuracies were evaluated by comparing the point-to-plane residuals after removing the outliers.
DMC
UltraCamX
RMK
Fig. 4: Reconstructed point clouds for the test area ‘sports ground’ from SGM (left) and MATCH-T (right) using multiple stereo configurations. Fig. 4 shows the resulting point clouds from SGM (left) and MATCH-T DSM (right). Whereas the matching success rate of MATCH-T significantly decreases for RMK imagery, SGM seems to be pretty robust against the reduced signal-to-noise ratio of the analogous camera system. It provides a rather complete reconstruction and a standard deviation of 3.0 cm for the respective point clouds. Despite of the homogenous texture our algorithm yields point densities of 135.4 pts/m2 for the UltraCamX imagery. A standard deviation of 2.3 cm was achieved, which is slightly worse than the results of the stereo evaluation in section 3.1.1. This is caused by using stereo models with smaller base-toheight ratios for the object point triangulation. Again, some low textured areas could not be matched. In comparison, MATCH-T DSM provides point densities of 16.0 pts/m2 with a standard deviation of 7.1 cm. The highest point densities for both methods were obtained for the DMC imagery. MATCH-T yields a reconstruction at a point density of 23.9 pts/m2 with a standard deviation of 3.4 cm. Again, SGM provided a complete reconstruction with 141.6 pts/m2 and an accuracy of 2.1 cm. One has to keep in mind that due to MATCH-T’s black-box character, parameterization is limited, and therefore, the software might not perform at its optimum level. Furthermore, due to different weather and illumination conditions during acquisition of the DMC and UltraCamX imagery, this does not allow for a comparison of the different digital camera systems, but demonstrates the capability of the matching algorithms at areas of very homogenous texture.
UltraCamX: Base-to-height ratio 0.12
UltraCamX: Base-to-height ratio 0.37
UltraCamX: Base-to-height ratio 0.51
RMK: Base-to-height ratio 0.56
Fig. 5: Reconstruction of more complex surfaces, GSD 8 cm. Besides rather homogenous intensities, which aggravate matching problems, the sports ground is a very special test scenario since its simple planar geometry can be modelled perfectly by the smooth-
ness constraints. As a consequence, disparity estimations might be in large parts dominated by the penalty terms and not by distinctive cost minima. This might result in misleading values for sub-pixel accuracies. In order to demonstrate matching results for non-planar surface, Fig. 5 depicts a 3D point cloud at a building which was already examined in (HAALA 2009). The stereo models were generated using UltraCamX image pairs at base-to-height ratios of 0.125, 0.25 and 0.5, respectively. As can be seen in Fig. 5, image pairs with shorter baselines are better suited for stereo matching compared to large baseline imagery. Greater distances between the camera stations result in larger variation in the image content. As it can be seen in Fig. 5, this results in more mismatches and thus lower point densities, especially at complex geometries like buildings. Fig. 5 additionally shows a result from the RMK image pair at the base-to-height ratio of 0.56. Whereas tests on the sports ground resulted in comparable point densities for digital and analogous camera systems, in common 3D scenarios the impact of the worse signal-to-noise ratio is immediately noticeable.
3.2 Influence of Varying Base-to-Height Ratios - Test at Complex Areas In order to further investigate the benefits of multiray photogrammetry, a test flight with 80% forward and 70% side lap was used. The aerial imagery was captured by Vexcel’s UltraCamXp at a height above ground of 1600 m with a GSD of approximately 10 cm. Fig. 6 shows a test area selected from this block which is used in the following investigations. It includes several potentially problematic regions for image matching, marked by solid rectangles. These areas contain low texture (yellow), varying shadows due to illumination changes (purple), periodic patterns (red and green), vegetation of varying appearance in different images (orange), smaller structures as cars (blue) and a planar area (dashed rectangle). In contrast to the investigations in section 3.1, matching is not restricted to the planar region. Still, no assumption on underlying object geometry is required for error analysis and filtering. In contrast, point accuracies and the ratio of successfully matched points are determined using the redundancy from multiple stereo image pairs as already described section 2.3.
Fig. 6: Test area with rectangles defining problematic areas for image matching. As shown in Fig. 7, two image pairs with different base-to-height ratios were combined in a first investigation. For stereo measurement, configuration 1 uses the direct neighbours in flight direction. The corresponding base-to-height ratio of 0.12 for these image pairs is also represented in the left image of Fig. 7. In configuration 2, the base-length of the respective stereo pairs increases by a factor of two. While configuration 1 and 2 are based on images of the same strip, configuration 3 uses search images from the upper and lower neighbouring strips. As represented in Fig. 7 (left), configurations 2 and 3 feature stereo pairs of the same base-to-height ratios of 0.24.
Base-to-height ratios
Configuration.1
Configuration.2
Configuration.3
Fig. 7: Base-to-height ratios and configurations for multi-stereo matching. The resulting point clouds from multiple image matching using the configurations 1 – 3 are shown in Fig. 8. During processing, outliers were eliminated using the standard deviation of each object point Xi . As discussed in section 2.3 the respective point accuracy can be computed in spatial intersection of the three image rays, which resulted from matching the base image with two match images, respectively. To eliminate erroneous matches the vertical standard deviation σZi obtained from the covariance matrix was used. For this purpose, a threshold is defined using the standard deviation 3σσZall. This value is computed from the error σZi of all 3D point measurements in the test area as described in section 2.3. In this test, a valid 3D point thus requires two successful matches. These successful matches are represented by the colour coded point clouds in Fig. 8. Areas with no valid point measurements occur as black regions.
Config. 1
σZ = 4.27 cm nPoints = 81.4%
Config. 2
σZ = 1.94 cm nPoints = 72.8%
Config. 3
σZ = 1.91 cm nPoints = 60.1%
Fig. 8: Matching results for configurations 1 – 3. Similar to the example already given in Fig. 5, the number of successfully matched points decreases if the base-to-height ratio is increased. For the combination of the stereo pairs with base-to-height ratio of 0.12 (configuration 1), successful matches were generated for 81.4% of all points. This corresponds to an average point density of 86 pts/m2 for the available imagery. The percentage of successful matches decreases to 72.8% for the base-to-height-ratio of 0.25 in configuration 2. Compared to percentages of successfully matched points in section 3.1, the respective values are lower in this experiment. However, here a point requires valid matches in two stereo pairs. Furthermore, measurements in section 3.1.1 were restricted to a planar region, whereas now complex 3D geometry and problematic areas for image matching are present. The distribution of no-point areas in Fig. 8 shows problems for all configurations at the repetitive pattern of the building roof marked by the green rectangle in Fig. 6. For the larger base-to-height ratios of configuration 2 and 3, additional problems occur especially at the bushes and trees marked by the orange rectangle in Fig. 6. Such objects are difficult for stereo matching because their appearance in the aerial images is especially sensitive to viewpoint changes. The number of matched points is even lower for configuration 3, which has the same base-to-height ratio as configuration 2, but uses images from different image strips. There, the larger differences between the times of exposure results in shadow movement, which again affects the
matching process in a negative way. Fig. 8 gives an average vertical accuracy σZ = 4.3 cm for points from configuration 1. In contrast, σZ is better than 2 cm for configurations 2 and 3 due to the improved geometric configuration. It must be kept in mind that these values just represent the internal precision from the intersection of image rays. However, even if the additional error from bundle block adjustment is considered, the geometric quality of the generated point clouds is remarkable. A further increase of both accuracy and density or completeness of 3D point clouds is feasible if multi-stereo matching is extended to even more image pairs. This is demonstrated in Fig. 9, which displays results of four and six image pairs. For the left example, which defines configuration 4, five images of one strip are used to form four stereo image pairs. The second example given by configuration 5 additionally includes two neighbouring images from the upper and lower image strips to generate two more stereo pairs. Compared to configuration 2 and 3 in Fig. 8 the vertical errors σZ slightly increase after the additional imagery is included. This holds true for both configurations 4 and 5. This is due to the fact that an increasing number of image rays for point determination gives a better evidence on remaining errors in image orientation from bundle block adjustment. However, the use of additional stereo pairs considerably increases the percentage of successfully measured 3D points. These values increase to 89.5% and 91.5% for configuration 4 and 5, respectively. Although the increase of successfully matched points between configurations 4 and 5 is rather low, the additional computation is still useful. The two additional stereo pairs in configuration 5 provide rays from images of different strips. Thus they enhance the point clouds mainly in areas that were previously occluded, such as facades. Furthermore, point determination at the building roofs, which is aggravated by the periodic patterns is improved. Config. 4 σZ =2.89cm nPts=89.5%
Config. 5 σZ =2.78cm nPts=91.5% C Configuration 4
Configuration 5
Fig. 9: Matching results for configuration 4 and 5 with for four and six image pairs.
4 Conclusions In our investigations, SGM proved to be a robust and easy-to-parameterize matching algorithm. Best matching results were obtained for stereo images with short baselines, good texture and small signalto-noise ratios. Obviously, matching performance depends on the image content, since homogenous intensities and large signal-to-noise ratios can limit the quality of the generated 3D point clouds. Still, matching accuracies better than 0.2 pixels at high point densities were feasible even for areas with very little texture. Potentially, the matching accuracy and reliability decreases for large base-to-height ratios due to changes in perspective and illumination. Nevertheless, the beneficial geometric properties for larger baselines during point determination by spatial intersection at least partially compensate the reduced matching accuracy. Mismatches, which occur more frequently for large baseline images, can be eliminated efficiently during the implemented multi-stereo matching. However, this outlier filtering reduces the density of the generated point clouds. For this reason, the combination of several stereo image pairs for multiple parallax estimation is especially beneficial. The combination of multiple measurements in triangulation increases the accuracy of the generated 3D point clouds, whereas their completeness can be increased by multi-stereo matching of imagery with varying perspective. Even more important, the redundancy available from the combination of stereo matches from different image pairs allows a very efficient accuracy analysis. This enables an efficient elimination of
erroneous matches and results in a considerable reliability of the 3D points at vertical accuracies well at the sub-pixel level. Furthermore, multiple viewpoints also provide a good coverage in complex urban areas, which further increases the already large number of potential applications for multi-ray photogrammetry from dense image matching.
References BRAUN, J., 2003: Aspects on True-Orthophoto Production. Photogrammetric Week '03, Herbert Wichmann Verlag, Heidelberg. CRAMER, M., 2010: The DGPF-Test on Digital Airborne Camera Evaluation – Overview and Test Design. – PFG 2/2010: 75–84. GRÜN, A. & BALTSAVIAS, E., 1988: Geometrically Constrained Multiphoto Matching. – Photogrammetric Engineering and Remote Sensing 54 (5): 633–641. HAALA, N., HASTEDT, H., WOLFF, K., RESSL, C. & BALTRUSCH, S., 2010: Digital Photogrammetric Camera Evaluation – Generation of Digital Elevation Models. – PFG 2/2010: 99–115. HAALA, N., 2011: Multiray Photogrammetry and Dense Image Matching. – Photogrammetric Week 2011: 185–195, Wichmann. HARTLEY, R.I. & ZISSERMAN, A., 2004: Multiple View Geometry in Computer Vision, Cambridge University Press, Cambridge, Chap.12. HIRSCHMÜLLER, H., 2008: Stereo Processing by Semi-Global Matching and Mutual Information. – IEEE Transactions on Pattern Analysis and Machine Intelligence 30 (2): 328–341. HIRSCHMÜLLER, H. & SCHARSTEIN, D., 2009: Evaluation of Stereo Matching Costs on Images with Radiometric Differences. – IEEE Transactions on Pattern Analysis and Machine Intelligence 31 (9): 1582–1599. JACOBSEN, K., CRAMER, M., LADSTÄDTER, R., RESSL, C. & SPRECKELS, V., 2010: DGPF-Project: Evaluation of Digital photogrammetric Camera Systems – Geometric Performance. – PFG 2/2010: 85–98. LEBERL, F., IRSCHARA, A., POCK, T., MEIXNER, P., GRUBER, M., SCHOLZ, S. & WIECHERT, A., 2010: Point Clouds: Lidar versus 3D Vision. – Photogrammetric Engineering and Remote Sensing, 76 (10): 1123–1134. HAALA, N., 2009: Comeback of Digital Image Matching. – Photogrammetric Week 2009: 289–301, Wichmann. LEMAIRE, C., 2008: Aspects of the DSM Production with High Resolution Images. – IAPRS XXXVII (B4): 1143–1146. SEITZ, S., CURLESS, B., DIEBEL, J., SCHARSTEIN, D. & SZELISKI, R., 2006: A Comparison and Evaluation of Multi-View Stereo Reconstruction Algorithms. – IEEE Computer Society Conference on Computer Vision and Pattern Recognition (CVPR'2006). Address of the Authors: Apl. Prof. Dr. NORBERT HAALA, Dipl.-Ing. MATHIAS ROTHERMEL Institut für Photogrammetrie, Universität Stuttgart, Geschwister-Scholl-Str. 42D, D-70174 Stuttgart, Tel.: +49-711-685-83383, {norbert.haala},{mathias.rothermel}@ifp.uni-stuttgart.de
Manuskript eingereicht: Oktober 2011 Angenommen: März 2012