Density Estimation with Mercer Kernels William G. Macready Research Institute for Advanced Computer Science NASA Ames Research Center MailStop 269-4 Moffett Field, CA 94035
[email protected]
Abstract We present a new method for density estimation based on Mercer kernels. The density estimate can be understood as the density induced on a data manifold by a mixture of Gaussians fit in a feature space. As is usual, the feature space and data manifold are defined with any suitable positive-definite kernel function. We modify the standard EM algorithm for mixtures of Gaussians to infer the parameters of the density. One benefit of the approach is it’s conceptual simplicity, and uniform applicability over many different types of data. Preliminary results are presented for a number of simple problems.
1
Introduction
Kernel methods have proven themselves to be an efficient and effective method for a wide class of machine learning problems. Kernel methods work by mapping data in some space X non-linearly into some feature space F , and applying relatively simple learning methods in the feature space. Historically, most kernel methods have been applied to supervised learning tasks (e.g. support vector machines [1], Gaussian processes [2]), but recent work has expanded their scope into unsupervised problems as well (e.g. kernel PCA [3], support estimation [4], etc). The prototypical unsupervised learning task is density estimation where we wish to infer a 1 probability density pX (x|DX ) that accounts for a data set DX = {xi }N i=1 (with xi ∈ X) . To date there has been relatively little use of kernel methods for density estimation. Recent exceptions include the use of support vector methods to estimate cumulative distribution functions [5]. Kernel ideas have also inspired improved variations of traditional Parzen window density estimation algorithms [6]. We describe a new approach to density estimation which combines the flexibility and modularity of kernel methods with the simplicity of EM for Gaussian mixtures in order to infer probability densities over any data space, even those having data elements with mixed type (e.g. discrete and continuous). In kernel methods we assume a mapping Φ : X 7→ F taking each datum to a point in a d F φ i }N dimensional Euclidean space F . We indicate the mapped data by DF = {φ i=1 where 1
Scalar values are indicated by variables in regular font, while vectors and matrices are in bold font and indicated by lower- and upper-case letters respectively.
φi = Φ(xi ). If X has dimension dX then Φ maps X into a dX -dimensional manifold embedded in F (assuming dF > dX ); we call this the data manifold. If the inference algorithm used in the feature space uses only inner products, then the only knowledge required of Φ is contained in the kernel function K(x, x0 ) ≡ hΦ(x), Φ(x0 )i.2 An important advantage of kernel methods is that even though the inference algorithm at work in F operates on vectors in RdF , the method applies to any type of data X so long as we can identify a Φ mapping the data to F . By now there exist kernels for mapping many types of data, e.g. graphs, trees, symbol sequences, etc., and thus the method proposed here may be used to infer probability densities over all these types of data [7]. If the mapping Φ is suited to the learning task (i.e. the features defined by Φ are relevant), then the inference algorithm at work in F can be very simple. For the density estimation task considered here, we fit a mixture of Gaussian distributions to perform density estimation in the feature space. This choice offers the benefits of modelling flexibility (with enough Gaussians we can approximate any density), and an efficient EM algorithm for determining the parameters of the Gaussians. However, as we will show, even a single φ) ∼ G(φ φ|µ µ, Σ ) with µ and Σ estimated from DF is often sufficient to model Gaussian pF (φ complex structure in pX . The density pX is obtained from pF by simply setting pX to the the density induced by pF on the data manifold. This choice does mean the pX will not be normalized, but we can sample efficiently from pX (even if it is highly multi-modal)3 , and thus estimate the normalization by Monte Carlo when it is needed. The paper is organized as follows. In section 2 we derive an EM algorithm to fit mixture of Gaussian densities in feature space by expressing the means and covariances of the Gaussians as linear combinations of φ i . Optimization of an objective expressible in terms of kernel evaluations gives an update rule to identify the best linear combination. Section 3 then considers how the Gaussian density in F is mapped to a density in X, and section 4 demonstrates some results on simple problems. We conclude in section 4 with a discussion of work in progress and a few open problems.
2
Gaussian Mixture Density Estimation in Feature Space
φ|θθ ) = With M mixture components, the density model in feature space has the form pF (φ ¢ ¡ PM −1/2 > −1 φ − µ m )/2 . φ|θθ m ) where G(φ φ|θθ m ) = |2πΣ Σm | φ − µ m ) Σ m (φ exp −(φ m=1 ρm G(φ The parameters of the mth mixture are θ m ≡ (ρm , µ m , Σ m ), and we group all parameters into the vector θ ≡ (θθ 1 , · · · , θ M ). The mixture probabilities must sum to 1, i.e. PM m=1 ρm = 1. The EM algorithm is a convenient method to determine the parameters θ of this mixture model. It is an iterative method in which an existing guess for the parameters (call this θ g ) is updated by maximizing the average log posterior of the data DF . The averaging is done over N hidden variables, zi , which indicate which mixture was responsible for each observation. If p(z|DF , θ g ) is the the current estimate for the probability of¡the hidden variables given ¢ a guess for the mixture parameters, then define Q(θθ |θθ g ) ≡ E ln p(DF , z|θθ ) + ln p(θθ ) where the expectation is performed with respect to p(z|DF , θ g ). For Gaussian mixtures this is calculated as [8] g
Q(θθ |θθ ) = 2
M X
m=1
(
ln p(θθ m ) +
N X i=1
g
φi |θθ m )p(m|φ φi , θ ) ln(ρm G(φ
)
P F φ, φ 0 i is the usual inner product dα=1 hφ φ(α)φ0 (α) where φ(α) is the αth component of φ . If F is infinite dimensional the sum is replaced by an integral. 3 Work in progress.
where using Bayes rule φi , θ g ) = P p(m|φ
φi |θθ gm ) ρgm G(φ g φi |θθ gm0 ) m0 ρm0 G(φ
(1)
is the probability that φ i was generated by the mth mixture. Given the existing guess θ g a better guess is obtained by maximizing Q(θθ |θθ g ) with respect to θ . In this formulation we have allowed for prior probabilities, p(θθ m ), on the mixture parameters. This inclusion is essential in order to guarantee that we obtain positive-definite covariance estimates. For many kernels, dF > N so that naive estimation of Σ m would result in singular covariances. We will not have need of priors over the means and mixture weights, and we employ an inverse Wishart distribution for the prior over each Wishart distribu¡ Σ m [9].−1The inverse ¢ β/2 Σm |α, β, J ) ∝ |Σ Σ−1 Σm J)/2 . The role of Wishart tion is given by p(Σ exp −α tr(Σ m | parameters can be seen by maximizing the inverse Wishart distribution. The mode occurs at Σ m = αJ/β. In what follows we will take J = I, the identity in feature space. Up to −1 Σm ) = (β ln |Σ Σ−1 irrelevant constants, log p(Σ m | − α tr Σ m )/2. Defining ngm ≡
N X
φi , θ gm ) p(m|φ
and
i=1
Sm ≡
a standard calculation yields
N X i=1
φi − µ m )(φ φi − µ m )> p(m|φ φi , θ g ) (φ
(2)
¾ M ½ X ngm + β 1 −1 −1 −1 g Σm ) . Σm | − tr(Σm Sm + αΣ ln |Σ nm ln ρm + Q(θ|θ ) = 2 2 m=1 g
Since the EM algorithm only has access to inner products in F we must express Q in terms of the kernel K. To this end we write the mean and covariance as: µ m = Vam φ1 · · · φ N ]. The parameters ²m , am and and Σ m = ²m I + VBm V> where V = [φ Bm that we need to determine are respectively a scalar, an N -vector and a positive definite N × N matrix. With a slight abuse of notation we set θ m = (²m , am , Σ m ) which we will determine by maximizing Q. We include a multiple of the identity to ensure that Σ m is positive-definite. It is easily verified that the inverse of the covariance is given by ˜ m V> if Σ m = ²˜m I + VB ²˜m = 1/²m
and
1/2 1/2 −1 1/2 ˜ m = −˜ B ²m B1/2 Bm m (²m IN + Bm KBm )
where IN is the N × N identity matrix, K is the symmetric positive definite N × N Gram 1/2 matrix given by K = V> V = [Ki,j ] with Ki,j = K(xi , xj ), and Bm is the Cholesky decomposition of Bm . For future reference we also note the identities ˜ m + ²˜m Bm + Bm KB ˜ m = 0. ˜ m + ²˜m Bm + B ˜ m KBm = ²m B ²m B From these equations we may derive ˜ m = (²m K+KBm K)−1 ²˜m K−1 + B
and
˜ m K)−1 (3) ²m K−1 +Bm = (˜ ²m K+KB
which generalizes from inverses to pseudoinverses. With the assumed representations for µm and Σm , the argument of the exponential in the φx − µ m ) = (φ φx − φx − µ m )>Σ −1 mth Gaussian when evaluated at φ x ≡ Φ(x) is (φ m (φ ˜ m V> )(φ φx − Vam ) which is equal to V am )> (˜ ²m I + V B ˜ m (kx − Kam ) + ²˜m (Kx,x − 2k> am + a> Kam ) = (kx − Kam )> B m x > −1 > ˜ −1 = ²˜m (Kx,x − k K kx ) + (kx − Kam ) (Bm + ²˜m K )(ki − Kam ) x
> where we have defined Kx,x ≡ K(x, x), and k> x ≡ φ x V = [K(x, x1 ) · · · K(x, xN )]. > −1 If x is the ith data point then ki K ki = Ki,i = K(xi , xi ) so that using Eq. (3) the argument of the exponential can be written as
φi − µ m ) = (ki − Kam )> (²m K + KBm K)−1 (ki − Kam ). φi − µ m )>Σ −1 (φ m (φ
(4)
Σ−1 Returning to the expression of Q in terms of inner products, we can show that |Σ m | = dF −N −1 −1 g ˜ m |. Thus ln |Σ Σm | which contributes to Q(θθ |θθ ) is ²˜m |K||˜ ²m K + B ˜ m| Σ−1 ln |Σ ˜m + ln |K| + ln |˜ ²m K−1 + B m | = (dF − N ) ln ²
Further, exploiting Eq. (3) in Eq. (1) we see that
¡ ¢ φi − µ m )>Σ −1 φi − µ m ) ρgm |²m K + KBm K|−1/2 exp − 21 (φ m (φ ¡ ¢ (5) φi , θ ) = P g p(m|φ −1/2 exp − 1 (φ φi − µ m ) φi − µ m )>Σ −1 m (φ m ρm |²m K + KBm K| 2 g
with the arguments of the exponentials given by Eq. (4). Thus, the posterior probabilities φi , θ g ) can be evaluated in terms of kernel values so that Sm defined in Eq. (2) can be p(m|φ determined. Σ−1 Σ−1 Finally, we consider tr(Σ m Sm + αΣ m ) which also appears in Q. From the defining −1 equation for Σ m ˜ m V> ) = ²˜m dF + tr(B ˜ m V> V) = ²˜m dF + tr(B ˜ m K). ˜m tr I + tr(VB tr Σ −1 m =²
˜ m V> Sm = ²˜m tr Sm +tr B ˜ m V> Sm V. Using Σ−1 Similarly, tr(Σ ˜m tr Sm +tr VB m Sm ) = ² the definition for Sm , and the fact that µ m = Vam we find tr Sm =
N X i=1
=
N X i=1
φi , θ g ) tr(φ φi − Vam )(φ φi − Vam )> = p(m|φ
M X i=1
φi − Vam )> (φ φi − Vam ) p(m|φi , θ g )(φ
¡ ¢ φi , θ g )(ki − Kam )> K−1 (ki − Kam ) = tr K−1 Mm . p(m|φ
P φi , θ g )(ki − Kam )(ki − where we have defined the N × N matrix Mm ≡ i p(m|φ > > ˜ m V Sm V, is expressed by noting that V> Sm V = Ka final term, tr B P m ) . The g > φi , θ )V (φ φi − Vam )(φ φ − Va )> V = Mm . Combining these results we i p(m|φ ¡ i −1 m ¢ −1 −1 ˜ m )(Mm + αK) + α˜ Σm Sm + αΣ Σm ) = tr (˜ find tr(Σ ²m K + B ²m (dF − N ) so that g ˜ Q(θθ |θθ ) is equal to (up to constants independent of ²˜m , am , Bm ) M n X
¢ ng + β ¡ dF −N α(dF − N )˜ ²m ˜ m| − + m ln ²˜m + ln |˜ ²m K−1 + B 2 2 m=1 ¡ ¢o 1 ˜ m )(Mm + αK) tr (˜ ²m K−1 + B (6) 2 ˜ m. Maximizing this with respect to θ determines the update formulas for ²˜m , am , and B Q(θθ |θθ g ) =
2.1
ngm ln ρm −
Maximization of Q
To P update ρm we maximize Eq. (6) with respect to ρm subject to the constraint that m ρm = 1. This yields ρm
N 1 X ngm φi , θ gm ). p(m|φ = = N N i=1
(7)
Similarly setting variations dQ of Q with respect to variations dMm equal to zero gives 1 ¡ ˜ m )dMm ). ²m K−1 + B dQ = − tr (˜ 2 Thus the optimal am is determined definition of Mm we find am P by dMmg = 0.> Using the φi , θ )(am K − k> is determined from dMm = 2 i p(m|φ i )dam = 0 which has solution X p(m|φ X p(m|φ φi , θ gm ) φi , θ gm ) Kam = ki or am = ei . (8) g nm ngm i i
where ei is a unit vector in the ith direction. ˜ m to find the parameters for the covariance. Rather Next we maximize Q with respect to B ˜ m we consider equivalently than consider variations in Q with respect to variations in B −1 ˜ variations in T ≡ ²˜m K + Bm : ¢ ng + β 1 ¡ dQ = m d(ln |T|) − tr (dT)(Mm + αK) . 2 2 ¡ ¢ The variation in the log determinant is given by d(ln |T|) = tr T−1 (dT) so that ¢ ¢ 1 ¡¡ dQ = tr (ngm + β)T−1 − Mm − αK) (dT) . 2 ˜ m we find Thus T−1 = (Mm + αK)/(ngm + β). Recalling that T = ²˜m K−1 + B 1 ˜ m )−1 = ²m K + KBm K = g (˜ ²m K−1 + B (Mm + αK) nm + β where we have utilized identity Eq. (3). Maximizing Q with respect to ²m yields ²m = α/(ngm + β). This last result for ²m gives a simple expression for Bm , N X φi , θ gm ) p(m|φ Bm = (ei − am )(ei − am )> . (9) g n m+β i=1 The complete EM updates are thus specified with equations Eqs. (7), (8), (9). The EM iterations can be initialized with a K-means algorithm in feature space.
Singular K: In many cases the above equations may not be directly applicable because K is singular (i.e. some φ i are linearly dependent, e.g. when N > dF ). Thus V is effectively a dF ×r matrix where r < N is the number of linearly independent φ i vectors (and the rank of K). This means that rather than using the full inverse of K we use it’s pseudoinverse. Since Eq. (3) also holds for pseudoinverses, we perform all calculations in an r dimensional subspace of F corresponding to the non-singular eigenvectors of K rather than the full N dimensional subspace. φi } are far from the origin in feature space, Shifting the Origin in Feature Space: If the {φ the Gram matrix conveys much less useful information. In some applications, shifting the PN origin in feature space to the center of mass c = i=1 φ i /N can improve performance [10]. This is accomplished in the present context by expanding the mean and covariance matrix in terms of φ ci ≡ φ i − c. Because translations preserve inner products, the argument of the exponentials is unaltered if c is absorbed into am . Thus the EM algorithm can be applied as before with new definitions for Kc and kcx .
3
From Feature Space to Data Space
Having determined the density pF in feature space we obtain the¡density¢in X by evaluating pF on the data manifold in F .4 Explicitly, pX (x|DX ) ∝ pF Φ(x)|θθ . As noted earlier 4
¡ ¢ R φ δ x − Φ− (φ φ) pF (φ φ) We might have induced a density on the data manifold as pX (x) = dφ where Φ− is a surjection from F to the data manifold, but this would result in non-analytic forms.
(a)
(b)
(c)
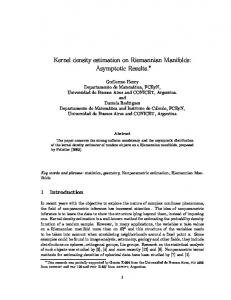
Figure 1: (a) Probability density obtained with two Gaussians fit to 100 noisy samples (white dots) centered at the origin and in a circle of radius 2. Blue regions are low probability and high regions are red. (b) Classification boundary obtained from the posterior φx ); red indicates class 1 (white samples) while blue indicates class 2 probability p(m|φ (black samples). The pair of Gaussian densities in feature space. The 2 dimensional data manifold is shown in the wire mesh with black dots representing the data samples. Four isosurfaces of constant probability are shown in varying translucencies of red. this density is not normalized. In fact, for kernel functions which are local and defined over infinite spaces, i.e. K(x, x0 ) → 0 as kx − x0 k → ∞ the density asymptotes to a tiny but finite value and cannot be normalized. In spite of this unpleasant property we have found good results even for Gaussian kernels.
4
Experiments
As a first example we demonstrate the geometry underlying our approach for X = R 2 . In order to visualize the results we select the quadratic kernel K(x, x0 ) = [x(1)x0 (1) + x(2)x0 (2)]2 where x(i) is the ith component of x. For this kernel√one choice for the mapping to feature space is Φ(x) = [Φ(1) Φ(2) Φ(3)]> = [x(1)2 2x(1)x(2) x(1)2 ]> for which dF = 3. In Figure 1(a) we plot the density obtained using a 2 component Gaussian mixture fit to a simple illustrative data set of 100 data points (white dots of Figure 1(a)). One Gaussian captures data near the origin while the other captures the halo around the origin, see Figure 1(c). Regularization of the density is controlled by the α and β parameters of the inverse Wishart prior over the covariance. In this example α = β = 1. Larger values of these parameters result in more spherical covariance matrices and smoother density esφx ) for varying x. High values (red) indicate timates. In Figure 1(b) we also plot p(m = 1|φ points assigned to the cluster at the origin and low values (blue) indicate points assigned to
0.1 0.09 0.08 0.07
X
p (x)
0.06 0.05 0.04 0.03 0.02 0.01 0 0
(a)
20
40
60
x
80
100
120
(b)
Figure 2: (a) Fit obtained with a single Gaussian in feature space to 200 samples from two Gaussians and a Laplace distribution. (b) Fit obtained to a sample of 30 bit strings drawn from a mixture of 2 equally weighted Bernoulli distributions. The solid black line is the fit with shaded circles showing where data points were located, and the true density is shown as dashed blue. The spiky nature of the plot is due to representing each bit string by its decimal equivalent. the halo. The data has been colored white or black according to its true class label. Next, we consider 200 samples from a mixture density in R2 consisting of two Gaussians (with means −[2 2] and [2 2], weights 0.3 and 0.3, and identity covariance), and one Laplacian density (with weight 0.4) at the origin, pL (x) = |C−1 | exp(kC−1 xk1 )/2dX with covariance C = [1 − 0.6; −0.6 1]. A single Gaussian in feature space with α = 15 and β = 1 and the kernel K(x, x0 ) = exp(−kx − x0 k2 )) results in the estimate shown in 2(a). The estimate captures the sharp peak and fat tails of the Laplacian. As a final example we apply the method to estimate a density over a discrete space. For easy visualization5 we chose X = B7 , and used the kernel K(x, x0 ) = ρd(x,x) where d(x, x0 ) is the Hamming distance between the bit strings x, and x0 , and −1 ≤ ρ ≤ 1 is a hyperparameter [7]. The results are not terribly sensitive to the value of ρ (as long as ρ is positive). In Figure 2(b) we plot the fit obtained with two Gaussians to 30 samples (19 of which are distinct) from a mixture of two equally weighted Bernoulli distributions 6 ρ and β were arbitrarily set to 0.6 and 0.5 respectively, and α was set to 2.6 by leave one out cross-validation. The fit is very good, even where the estimate is high or low, it captures the change in probability as bits are flipped accurately.
5
Discussion
We have developed a conceptually simple density estimation procedure which works by fitting a mixture of Gaussian distributions in feature space, and using the density induced on the data manifold. The EM algorithm can be modified to easily determine the parameters of the Gaussians. Preliminary results on simple test problems are encouraging. The method scales well with the dimensionality of the data space dX , but poorly with the number of training examples N . It would be useful to adapt methods from other kernel methods to 5 Higher dimensions dX only affect the scaling of the algorithm through evaluation of the kernel function. 6 The probability of bit i being 1 was [0.9501 0.6068 0.8913 0.4565 0.8214 0.6154 0.9218] and [0.2311 0.4860 0.7621 0.0185 0.4447 0.7919 0.7382] for the two mixtures.
choose good subsets of the data to improve the scaling with N [11]. The other important improvement that should be made concerns the determination of hyperparameters. Currently, this is difficult because we do not have access to the normalization of the density which depends on the hyperparameters. For general applicability, a method to overcome this difficulty to automatically identify hyperparameters is desirable. Though we have not outlined the details here, it is straightforward to modify the algorithm to account for data spaces having mixed types, e.g. discrete and continuous elements. This generalization will be reported elsewhere. The Gaussian description in feature space brings with it significant advantages. Firstly, because Gaussians are simple to sample from, we may be able use this to sample efficiently from pX (x). We are currently fleshing this idea out. Secondly, classification/regression can be done by fitting a single Gaussian to the joint φy |φ φx ). This induces a (typically non-Gaussian) space x and y, and determining pFy |Fx (φ density pY |X (y|x) over the data manifold. Acknowledgements We would like to thank E. Bandari, A. Srivastava and D. Wolpert for helpful suggestions.
References [1] Nello Cristianini and John Shawe-Taylor. An Introduction to Support Vector Machines. Cambridge University Press, 2000. [2] C. K. I. Williams. Prediction with gaussian processes: From linear regression to linear prediction and beyond. In M. I. Jordan, editor, Learning and Inference in Graphical Models. Kluwer, 1998. [3] B. Sch¨olkopf, A. Smola, and K. R. M¨uller. Nonlinear component analysis as a kernel eigenvalue problem. Neural Computation, 10:1299 – 1319, 1998. [4] B. Sch¨olkopf, B. Platt, J. ShaweTaylor, A. Smola, and R. Williamson. Estimating the support of a high-dimensional distribution. Neural Computation, 13:1443 – 1471, 2001. [5] V. Vapnik and S. Mukherjee. Support vector method for multivariate density estimation. In S. Solla, T. Leen, and K.-R. Muller, editors, Advances in Neural Information Processing Systems, volume 8, pages 659 – 665. MIT Press, 2000. [6] M. Girolami and C. He. Probability density estimation from optimally condensed data samples. IEEE Transaction on Pattern Analysis and Machine Learning, 2003. In press. [7] R. I. Kondor and J. Lafferty. Diffusion kernels on graphs and other discrete structures. In Machine Learning: Proceedings of the 19th International Conference, 2002. [8] J. A. Bilmes. A gentle tutorial of the em algorithm and its applications to parameter estimation for gaussian mixture and hidden markov models. Technical Report TR97-021, International Computer Science Institute, Berkeley, Ca., 1998. [9] H. Snoussi and A. Mohammad-Djafari. Penalized maximum likelihood for multivariate gaussian mixture. In R. L. Fry and M. Bierbaum, editors, Bayesian Inference and Maximum Entropy Methods in Science and Engineering. American Institute of Physics, 2001. [10] M. Meila. Data centering in feature space. In C. M. Biship and B. J. Frey, editors, Proceedings of the Ninth International Workshop on Artificial Intelligence and Statistics, volume 8, pages 331–337, 2003. [11] M. Seeger, C. K.I. Williams, and N. D. Lawrence. Fast forward selection to speed up sparse gaussian process regression. In C. M. Biship and B. J. Frey, editors, Proceedings of the Ninth International Workshop on Artificial Intelligence and Statistics, volume 8, 2003.