Deriving Quantitative Constraints on T Cell Selection from Data on the Mature T Cell Repertoire1 Vincent Detours,*†‡ Ramit Mehr,§ and Alan S. Perelson2* The T cell repertoire is shaped in the thymus through positive and negative selection. Thus, data about the mature repertoire may be used to infer information on how TCR generation and selection operate. Assuming that T cell selection is affinity driven, we derive the quantitative constraints that the parameters driving these processes must fulfill to account for the experimentally observed levels of alloreactivity, self MHC restriction and the frequency of cells recognizing a given foreign Ag. We find that affinity-driven selection is compatible with experimental estimates of these latter quantities only if 1) TCRs see more peptide residues than MHC polymorphic residues, 2) the majority of positively selected clones are deleted by negative selection, 3) between 1 and 3.6 clonal divisions occur on average in the thymus after completion of TCR rearrangement, and 4) selection is driven by 103–105 self peptides. The Journal of Immunology, 2000, 164: 121–128.
T
he T cell repertoire is shaped in the thymus by three processes. First, TCR V-region coding genes are generated by randomly rearranging V(D)J segments and inserting random nucleotides between them. This mechanism creates the diverse repertoire of TCRs needed for the immune system to cope with unpredictable pathogens. Second, positive selection (1, 2) promotes the differentiation to a further developmental stage of cells bearing receptors with a sufficiently large affinity for peptides presented on molecules of the MHC expressed in the thymus. This confers to T cells the property of self MHC restriction: they recognize peptides presented in the groove of host MHC molecules, but ignore them when presented on foreign MHC (3–7). Third, negative selection (8, 9) deletes cells whose TCRs bind thymic MHC-peptide complexes with very high affinity, thus preventing the emergence of self reactive T cells. Overall, only about 3% of thymocytes have the intermediate affinity needed to fully mature (10). In addition to self MHC restriction, the mature repertoire is also characterized by a high alloreactivity. Typically, 1–24% of T cells react against the product of a given foreign MHC allele (11, 12). This high response frequency is hard to reconcile with the fact that only one T cell in 104–106 of the naive repertoire recognizes a given pathogen (13, 14). What should the quantitative properties of the processes driving TCR generation and selection be to produce the experimentally observed levels of self restriction, alloreactivity, and Ag response? Previously, we developed a mathematical model relating these latter quantities to the parameters driving affinity-based selection (15) and showed that this model gives a reasonable quantitative account of self MHC restriction, alloreactivity, and Ag response frequency (16). In particular, we found that the difference between alloreactivity and Ag response frequencies is satisfactorily explained by *Theoretical Biology and Biophysics, and †Center for Nonlinear Studies, Los Alamos National Laboratory, Los Alamos NM 87545; ‡Santa Fe Institute, Santa Fe NM 87501; and §Department of Molecular Biology, Princeton University, Princeton, NJ 08544 Received for publication May 18, 1999. Accepted for publication October 18, 1999. 1 Portions of this work were performed under the auspices of the U.S. Department of Energy. This work was supported by National Institutes of Health (NIH) Grants RR06555 and AI28433 (A.S.P.), NIH Grant GM20964-25 for the study of genetics and regulation of autoimmunity, and NIH Grant AI10227-01 (R.M.). 2 Address correspondence and reprint requests to Dr. Alan S. Perelsun, Theoretical Biology and Biophysics, MS K710, Los Alamos National Laboratory, Los Alamos, NM 87545. E-mail address:
[email protected].
Copyright © 2000 by The American Association of Immunologists
the affinity model. We go one step further in the present paper by determining what ranges of parameters driving repertoire generation are implied by the observed properties of the mature repertoire. The parameters of our model fall into three categories. TCR/ MHC-peptide interaction is quantitatively controlled by the numbers of peptide and of MHC residues involved in binding to TCR. At the level of sets of molecules, peptides and MHCs are characterized by their respective diversity. Finally, the stringencies of positive and negative selection are expressed as affinity selection thresholds. The stringency of positive selection can be inferred from data on the overall stringency of selection and on the amount of thymic clonal expansion following TCR rearrangement (16). Our analysis consists of calculating the levels of self MHC restriction, alloreactivity, and foreign Ag response frequencies for all the combinations of parameter values that could be inferred from experimental data. Although a significant portion of the parameter space thus defined is consistent with the generation of a repertoire with realistic properties through affinity-based selection, some measurements reported in the literature are incompatible with it.
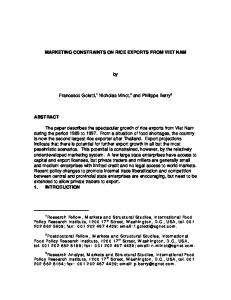
Quantitative Model of T Cell Selection We give a concise verbal description of the concepts underlying our model of T cell selection. A rigorous mathematical definition of this model can be found in Refs. 15 and 16. A computer implementation is also available (a software package in C language implementing the model and related simulations can be downloaded from ftp://ftp-t10.lanl.gov/pub/detours/abs-lab-1.1.tar.gz). Protein shapes and binding affinities The features of two proteins that determine their binding can be described with a relatively small number of parameters, such as their geometric shape, charges, and hydrophobicity. All these parameters combine to form the protein’s “generalized shape” as defined in Ref. 17. As in previous simulation studies (reviewed in Ref. (18), we model the generalized shape of a protein as a string of digits, from an alphabet of up to 255 digits. (The size of the alphabet does not affect the results, as long as it is large enough (15).) The strength of binding of two proteins is then defined as the degree of complementarity between the digits representing their generalized shapes (Fig. 1). Only the interface between TCRs and MHC-peptide complexes (framed region in upper diagram in Fig. 0022-1767/00/$02.00
122
QUANTITATIVE CONSTRAINTS ON T CELL REPERTOIRE SELECTION (6, 26) according to which the TCR senses peptide-induced structural features of the MHC rather that the peptide itself. Positive and negative selection
FIGURE 1. Digit-string representation of MHC-peptide and TCR interaction. MHC-peptide complexes are constructed by inserting a peptide string of length lp digits in an MHC string of length lm digits. TCRs are sequences of lm 1 lp digits chosen randomly. The interaction strength, I, between two facing digits in the two aligned strings, is a measure of their complementarity (see text). Affinity, K, is the sum of interaction strengths of contacting digits in the two aligned strings.
1) is represented in the model. We define the affinity, K, between two digit string proteins, as the sum of their individual digit interactions. Our model describes residues at the interface between TCRs and MHC-peptide complexes, not the full structure of these molecules. MHC and peptide are random strings, lm and lp digits long, respectively. In computing binding interactions the strings are aligned so that the central digits of a TCR always contact a peptide, and the digits at the extremities contact MHC. This modeling choice follows from studies according to which TCRs bind MHCpeptide complexes with a common orientation (19). The model is independent of the linear arrangement of digits. In particular, it is equivalent to a model with digits arranged in a two dimensional array mimicking the solvent accessible surface of proteins (as proposed in Refs. 20 and 21).
Selection is implemented by introducing two affinity thresholds for positive and negative selection, KP and KN (KP , KN). Clones binding at least one self MHC-peptide complex with affinity K larger than KP survive positive selection. Negative selection deletes clones binding one or more self MHC-peptide complexes with affinity K larger than KN. The values of KP and KN are derived from experimental data by considering the fractions of clones surviving the different stages of selection. Thus, a clone will become part of the peripheral repertoire if its affinity K falls between KP and KN. The fraction f of clones allowed to reach the periphery is:
f 5 f P z fN
(1)
where fP is the fraction of clones surviving positive selection (a similar parameter is used in Ref. 27), and fN is the fraction of positively selected clones that survive negative selection (27–30). The values of f and fN can be inferred from recent experimental data (see below). T cell activation and self-tolerance The activation of selected T cells has to be defined in our model in order to study alloreactivity and Ag response frequency. A clone is considered activated by a set of MHC-peptide complexes if the affinity of binding between its TCR and at least one MHC-peptide complex in this set is greater than KN. The repertoire in the model is thus self tolerant by construction, because no clone having an affinity larger than KN to a self MHC-peptide complex can survive negative selection.
TCRs, MHCs, and peptides
Parameter Ranges for Affinity-Driven Selection
In our model, it is assumed that lm and lp are the same for all MHCs and peptides. This assumption is reasonable because we restrict our analysis to class I MHC, which present peptides of fixed length. The number of MHC alleles expressed in an individual is nm. A given MHC allele can present a panel of np distinct self peptides. We also assume that because of allele-specific binding motifs, MHC molecules of different haplotypes present different subsets of self peptides (22). This is mathematically equivalent to presenting the same peptides in different conformations (15, 16), a property that we used in our previous modeling (16). Thus, a TCR is selected by a self environment composed of nm 3 np MHC-peptide complexes. Our goal is to measure self restriction and alloreactivity, which depend, by definition, on MHC polymorphism and on the specificity of TCRs. Therefore, MHC polymorphism-independent effects do not need to be part of the model. Hence we make the following simplifications. The effect of T cell coreceptors is omitted. Conserved MHC residues are not represented, i.e., the nm MHC segments are interpreted as the polymorphic parts of MHC molecules accessible to TCRs. To our knowledge, there is no evidence for a germline-encoded bias of TCRs toward recognition of some particular peptides, and bias toward recognition of MHC most likely results from interaction with MHC conserved residues (23–25), which are not taken into account here. Thus, assuming that preselection TCRs are random is justified in the context of the model (see Ref. 16 for a more extensive discussion of this issue). The peptide does not influence the MHC in the model. Thus, we exclude from our scope of investigation the altered self hypothesis
Seven parameters (Table I) determine mature repertoire properties (see Table II) in the model. All can be estimated from biological data, except one, the number of possible digits, dmax, used in the string representation of TCR, MHC, and peptides. This latter parameter controls the discretization of the model and has no effect on it as long as it is chosen large enough (15). Diversities of self MHC products and self peptides Essentially all progress in the identification and characterization of self peptides in alloreactivity has involved MHC class I systems (31). Thus, we focus on class I MHC in this paper. There are three class I loci in mice (32). Alloreactivity and self restriction experiments use inbred mouse strains (33), thus only one allele is present at each locus. Therefore, we set nm 5 3. (The analysis for class II can be done in an analogous way.) Because the number of class I loci is known with absolute certitude and is not subject to variation among inbred animals, nm is not varied. About 103–104 different peptides can be eluted from molecules of a given MHC allele (34 –37). Accordingly, Bevan (38) suggests that 103–104 self peptides drive selection. Thus, unless specified otherwise, the number of self peptides presented by a given self MHC string is set to np 5 104. However, the effect of varying np is also explored. Because there are about 105 genes in mammals, assuming that all of them are expressed and encode proteins of average length 300 aa, leads to the conclusion that np , 3 3 107. Thus, 108 is a theoretical upper bound for np, and consequently we study np in the range 102–108.
The Journal of Immunology
123
Table I. Parametersa Name
Definition
nm np
Number of MHC class I loci Number of self peptides
lm lp
Number of MHC digits Number of peptide digits
f fN
Fraction of selected clones Fraction of positively selected clones that survive negative selection
dmax
Largest digit
Default
Explorationb
3 104
3 {102, 103, . . . , 108}
4 6
{2, 3, . . . , 8} {4, 5, . . . , 11}
0.75% 37%
{0.19, 0.37, 0.75, 1.5, 3}% {20, 37, 95}%
255
255
a
Default values are used unless specified otherwise. All the parameter combinations that can be generated using the values in the “Exploration” column are investigated in this paper. b The parameter nm is known with absolute certitude and is not subject to variation in the congenic mice used in alloreactivity and self restriction experiments. dmax has no effect on the model’s results if chosen large enough (15).
Contribution of peptide and MHC polymorphic residues to binding The number of peptide residues and MHC polymorphic residues in contact with TCRs, lp and lm, respectively, are derived from crystallographic data. The structure of TCR/MHC-peptide complex A6/HLA-A2-Tax (39) reveals 7 peptide and 5 MHC polymorphic residues in contact with TCR A6, which gives lp 5 7 and lm 5 5 digits. Performing a similar measurement for B7/HLA-A2-Tax (40), 2C/H2-Kb-dEV8 (41), and 2C/H2-Lb-QL9 (42), gives an average of 5.75 peptides and 3.5 MHC residues in contact with TCR. Because lp and lm must be integers, we set lp 5 6 and lm 5 4. A6, B7, and 2C are all known to be positively selected when expressed in the relevant MHC background. Consequently, the above estimate might not reflect a property of the preselection repertoire. Counting solvent-accessible peptides and MHC polymorphic residues in a class I MHC-peptide crystal structure gives lp 5 11 and lm 5 5 (43). This approach is independent of any selection-induced bias, but has its own caveat because only part of the solvent-accessible surface of the MHC-peptide complex is covered by the TCR (39 – 41, 44). In the absence of conclusive data, (lp, lm) 5 (6, 4) will be used as default value, but lp will be varied in the range 4 –11, and lm in 2– 8. Stringencies of selection processes About 20 –50% of positively selected thymocytes survive negative selection (23, 24, 45– 48). Interestingly, earlier probabilistic models of clonal deletion based on the hypothesis that evolution optimizes the size of the repertoire predicted a very compatible value, fN 5 37% (28 –30). (These three models do not consider positive a
Table II. Quantities to be fitted with the model Name
R
a
r a b
Definition
Range
Ref.
Frequency of clones responding to a foreign peptide presented on self MHC Frequency of clones responding to MHC molecules of a given foreign haplotype Restriction ratio
1026–1024
13, 14
selection, but assume implicitly that the repertoire submitted to negative selection is constituted exclusively of functional Ag receptors, i.e., of receptors that have been positively selected. Therefore it is legitimate to establish a connection between the fraction of deleted clones in these models and fN.) Alternatively, Laufer et al. (49) estimated that fN , 95% by counting the number of apoptotic cells in the thymic medulla. The lower bound fN 5 20% (46), the intermediate value fN 5 37% (28 –30), and the upper bound fN 5 95% (49) will be investigated here. Three percent of T cells produced in the thymus reach the periphery (50). However, the fraction of clones, which our model deals with, and the fraction of cells differ because a significant portion of mature T cells divide before emigrating to the periphery (51–53). Scollay and Godfrey (52) suggest that one division occurs before emigration to the periphery. Division also occurs earlier in clonal development, with the fraction of CD41CD81TCR1 cells that proliferate estimated as being 1.5- to 2-fold larger than the fraction of dividing mature thymocytes (10, 51, 54, 55). Overall these data suggest that TCR1 cells go through one to three divisions in the thymus. Thus, if 3% of thymocytes survive selection, the fraction of clones reaching the periphery lies between f 5 3% and f 5 1⁄8 3 3% ' 0.33%. In the absence of more precise information, we assume that two divisions occur on average and hence each clone consists, on average, of four cells. Here, f 5 0.75% will be used as the default setting, but the effect of this parameter will be explored in the range 0.19 –3%. Hare et al. (56) report that up to six clonal divisions could take place in the thymus (i.e., f 5 3% 4 26 5 0.047%). This upper estimate will also be discussed.
Results Calculations were done for all the 5880 parameter combinations that can be obtained from Table I. The likely operating parameter regime of affinity-driven selection is determined by fitting data on Ag response frequency, alloreactivity, and possibly self restriction (experimental ranges of these quantities are given Table II). High alloreactivity implies stringent negative selection and a moderate number of thymic clonal divisions
1–24%
11, 12
.1b
13
See Ref. 15 for a mathematical derivation of these quantities. Conflicting experimental estimates (see text).
Alloreactivity, a, is the fraction of clones in the selected repertoire that are activated by a complex of self peptides associated with any of the nm MHCs of a foreign haplotype. Any peptide driving repertoire selection is considered as part of “self” in our model. We showed elsewhere (15, 16) that under the hypotheses stated in the “Model” section, a 5 f z (1/fN 2 1). Alloreactivity is given in Table III as a function of f and fN. Increasing the positive selection threshold, KP, either by reducing
124
QUANTITATIVE CONSTRAINTS ON T CELL REPERTOIRE SELECTION
Table III. Alloreactivity, a, for different values of f and fNa fN\f
3
1.5
0.75
0.37
0.19
20 37 95
12 5.1 0.16
6 2.6 0.08
3 1.3 0.04
1.5 0.64 0.02
0.75 0.32 0.01
a All numbers are expressed in percent. Italic font indicates that a is in the physiological range 1–24%.
f or by increasing fN, lowers alloreactivity. The alloreactivity is in the experimental range (1–24%) only when fN # 37%. Thus the model is not compatible with the upper bound fN 5 95% proposed by Laufer et al. (49). In addition, realistic alloreactivity levels could be obtained only when f $ 0.25%. Thus, the average clone size should be at most 12 cells, and the average number of thymic clonal divisions at most 3.6. The estimate of Hare et al. (56) that up to six clonal divisions occurs in the thymus, i.e., f 5 3% 4 26 5 0.047%, implies a # 0.19% if fN 5 20%, a # 0.08% if fN 5 37%, and a # 0.0025% if fN 5 95%. Therefore, we conclude that the lower bound f # 0.047% (56) is incompatible with high alloreactivity in the context of affinity-driven selection. According to Hare et al. (56) the average clone size of single positive thymocytes should be 9 –12 cells, which is compatible with the upper bound of 12 predicted by our model. (We obtained this range by averaging data from figures 2c and 2d in Ref. 56.) Response frequency to foreign peptides is inversely proportional to self peptide diversity The response frequency to foreign peptides, R, is defined in our model as the frequency of TCRs in the mature repertoire recog-
nizing a given foreign peptide. We find that the impact of f, fN, lm, and lp on R is weak within the explored region of the parameter space. Varying f within the range given in Table I never leads to a variation of R greater than 1.1 log10, whatever the values of fN, np, lm, and lp. Similarly, the difference in R between fN 5 20% and fN 5 95% never exceed 1.6 log10. Finally, varying lm or lp changes R at most by 1.6 and 1.7 log10 respectively. By contrast, R varied over at least 4.6 log10 when np was changed. We conclude that, within the explored region of the parameter space, R is affected mostly by np. This is apparent in Fig. 2, where R is plotted as a function of f, fN, lm, and np. Changing lp only translates the plots along the lm axis (data not shown), a behavior consistent with our claim that relative, rather than absolute contributions of MHC and peptide to TCR binding influence the model (15). Using the default parameters in Table I, we previously found that R is inversely proportional to np (16). To check the generality of this result, we measured for each value of f, fN, lm, and lp how well R could be approximated by linear regression on np. The fits were always excellent (error ,0.5%). Although the parameters of the regression line depend on f, fN, lm, and lp, the slope remains in a narrow range (21.2 to 20.8). Data on alloreactivity and foreign peptides response frequency implies that 103–105 self peptides drive selection Response frequencies in the experimental range 1026–1024 (13, 14) are possible only if np , 105. Low self peptide diversity, np 5 102, implies R in the biological range only if fN 5 95%, a value incompatible with an alloreactivity a $ 1% (see above). If fN # 37%, then np must be greater or equal to 103 for R to be in the range 1026–1024. Thus, considering together the constraints on a and R leads to the conclusion that the number of self peptides that
FIGURE 2. The logarithm of foreign peptide response frequency, log10(R) is visualized using gray scales. Light shades represent high values of log10(R) and dark shades low values. Different scales are used for each value of fN investigated (bars at the right hand side of the diagram). Big dots indicate parameter sets that imply R in the experimental range 1026–1024. Parameters lm and np are varied within each square diagram, and each diagram corresponds to a particular setting of f and fN. For example, the value of log10(R) resulting from f 5 3%, fN 5 37%, np 5 104, and lm 5 5 is shown by the dot of coordinates [5, 104] in the first diagram of the second row. lp is set to 6 in all diagrams. Calculations were performed for the other values of lp given Table I and for f 5 0.19%, but are not plotted here.
The Journal of Immunology
125
FIGURE 3. Restriction ratio r. See Fig. 2 for explanations. Large dots indicate that repertoire is self MHC restricted (r $ 1). lp is set to 6. Calculations were performed for other values of lp given Table I and for f 5 0.19%, but are not plotted here.
drive thymic selection must be in the range 103 # np # 105. This range is compatible with the estimate 103–104 proposed by Bevan (38) and corroborates earlier elution studies (34 –37). Self MHC restriction increases with the number of thymic clonal divisions but decreases with the stringency of negative selection Experiments based on the comparison between allogeneic and syngeneic immune responses demonstrated strong restriction in some instances (4, 5, 57–59), but weak or absent restriction in others (58, 60 – 64). Thus, it is difficult to draw any conclusion on the average level of self restriction from experimental data. Here, we make the minimal assumption that T cells are better activated, by any amount, by peptides presented on self MHC than by peptides presented on foreign MHC. The extent of self MHC restriction has typically been estimated by comparing the effector activity against foreign peptides presented by self MHC with the activity against foreign peptides presented by foreign MHC. There are no effector functions in our model, but it is reasonable to assume that response intensity is proportional to the number of responding clones, which is measurable in the model. Stockinger et al. (13) assessed self restriction levels by comparing the frequency of precursors against Ags presented in the context of self and foreign MHCs (also see Ref. 6). This protocol is closely related to our approach because the frequency of responding precursors is expected to relate closely to the frequency of responding clones. We define Ra as the response frequency to a foreign peptide presented on foreign MHC, and the self MHC restriction ratio, r, as R/Ra. A restriction ratio greater than one indicates that on average a larger number of clones in the selected repertoire recognize a foreign peptide if it is presented on self MHC than if it is presented on a foreign MHC. Stockinger et al. (13) gives r in the range 6 –10. The relation f 5 fP z fN (see “Model” section) implies that either decreasing f or increasing fN result in a decrease in fP, i.e., making positive selection more stringent. The result is a higher restriction
ratio, r. This effect is clearly apparent in Fig. 3. The relative contribution of peptide to TCR binding, cp 5 lp/(lm 1 lp), and self peptide diversity, np, also have a major impact on r. The repertoire cannot be restricted if np is large and cp small, or if cp is large and np small. Compatibility with precursor frequency based estimate of self MHC restriction implies at least one clonal division in the thymus We showed above that a $ 1% could be obtained only if f $ 0.25% (i.e., 3.6 or less clonal divisions in the thymus on average). Further, a value of r $ 6 could not be obtained with f 5 3%. Thus if r $ 6 reflects biological conditions, as suggested by Stockinger et al. (13), then f should lie in the range 0.25–1.5%; i.e., between 1 and 3.6 clonal divisions should occur on average in the thymus. Complying further with Stockinger et al. (13) by imposing r # 10 does not imply more stringent constraints on parameter ranges. Combined peripheral repertoire data imply that TCRs contact more peptide residues than MHC polymorphic residues It is possible to obtain physiological values for alloreactivity, i.e., 1% # a # 24%, the restriction ratio, i.e., r . 1, and the foreign peptide response frequency, i.e., 1026 # R # 1024, for any of the explored values of lm provided that other parameters are set properly. The same is true for lp. However, the relative contribution to TCR binding by peptide, cp 5 l/(lm 1 lp), is completely determined by the above constraints: we find that the model meets the above experimental requirements only if cp is in the range 36 – 85%. Experimental estimates of the level of self restriction range from weak to absolute restriction (63). The most minimal requirement for self restriction is r . 1. Requiring r to exceed 6, the lower range reported by Stockinger et al. (13), narrows the admissible interval for cp to 50 – 80%. Thus our model suggests that if T cell
126
QUANTITATIVE CONSTRAINTS ON T CELL REPERTOIRE SELECTION
selection is affinity-driven, then the contribution of peptide residues to TCR binding should be greater than that of MHC polymorphic residues.
Discussion We proposed estimates of the parameters driving TCR generation and selection (Table I) from the data on the mature T cell repertoire (Table II). The model underlying this analysis is based on the central hypothesis that thymocyte selection is affinity driven. Therefore, the results discussed in the following are predicated on the correctness of the affinity model. Although it plays a major role in current immunological thinking, the view that affinity controls T cells behavior remains controversial (25, 65). Our analysis provides information on the average behavior of the T cell repertoire; it does not give a full account of the diversity of biological situations. Alloreactivity frequency is, by definition, a global property of the T cell repertoire, not the property of any particular TCR/MHCpeptide ternary complex. Our model is a first step in bridging the gap between microscopic molecular events controlling T cell selection and activation and their effect on macroscopic properties of the repertoire. We show that if alloreactivity lies in the range 1–24% (11, 12), one T cell in 104–106 recognizes a given pathogen (13, 14), and if the repertoire is self MHC restricted (by any amount), then the relative contribution of peptide (as opposed to MHC polymorphic) residues to TCR binding, on average, should be in the range 36 – 85%. In other words, if a TCR contacts on average 4 peptide residues, as suggested by several MHC-peptide crystal structures (66 – 69), then it should also contact an average of 0.7– 6.5 MHC polymorphic residues. Assuming that the number of T cells activated by a foreign peptide presented on self MHC is on average at least 6-fold larger than the number of T cells activated by a foreign peptide presented on foreign MHC (as suggested in Ref. 13) implies a relative peptide contribution of 50 – 80%. That is, if four peptides residues mediate TCR binding, then one to four MHC polymorphic residues should also be involved in TCR binding. Thus our analysis suggests that more peptide residues than MHC polymorphic residues should interact on average with TCR. The contribution of conserved MHC residues is not addressed by the current version of our model. We established elsewhere (15) that alloreactivity both prior to and after selection is given by f z (1/fN 2 1), where fN is the fraction of positively selected clones also surviving negative selection, and f is the fraction of clones surviving the overall selection process. Examining this relation provides insights into the stringency of negative selection. The fraction fN has been estimated using three different approaches. The first consists of counting the number of apoptotic cells in the thymic medulla, where negative selection is supposedly taking place. Doing so, Laufer et al. (49) found that a minimum of 5% of positively selected cells undergo negative selection (i.e., fN , 95%). The second approach consists in generating T cells in an environment in which only one peptide sequence is covalently attached to all MHCs. Measuring the number of cells produced in this single peptide environment that also respond to APCs harboring a normal diverse array of self peptides, provides an estimate for the number of cells that would have been deleted by negative selection in a normal animal. This protocol leads to fN in the range 20 –50% (45– 48). Rescuing thymocytes with anti-CD3 (23), or anti-TCRab (24) Abs instead of MHC molecule with a covalently bound peptide, gives similar estimates. Finally, theoretical models based on the assumption that evolution minimizes the size of the preselection repertoire, suggest fN ' 37% (27–30). Our analysis supports these latter estimates by showing
that a repertoire in which more than 1% of the clones are alloreactive can be obtained only if a large fraction of the cells is deleted by negative selection. Low negative selection, fN 5 95% (49) coupled with 3% survival of thymocytes, implies high affinity thresholds for positive selection, which in turn implies high self MHC restriction, and therefore low alloreactivity. The advent of highly active antiretroviral therapy raised considerable interest about immune system regeneration capabilities. The thymus plays an important role in this process (70), especially for restoring the diversity of the T cell repertoire, because peripheral proliferation in not believed to be associated with TCR rearrangement. Our analysis makes it possible to estimate the extent of clonal proliferation occurring in the murine thymus, which is crucial to the understanding of how the number of cells produced in the thymus relates to the number of new clonal specificities generated, as well as to determining the fraction of recent emigrants that carry T cell receptor excision circles (70). Recent evidence shows that the TCR a-chain (71–74) gene rearrangement may not stop after a productive receptor gene has been formed and expressed. Rearrangement appears to continue until the cell is either positively selected or dies (75, 76). The result may sometimes be the maturation of a T cell with two productively rearranged TCRa genes, both of which may be expressed (77, 78), and multiple TCR excision circles. These results have no direct bearing on the study presented here, because we are dealing with the repertoire of TCRs rather than of actual T cells. If a cell makes a secondary rearrangement, it is equivalent, from the point of view of our model, to the deletion of its previous TCR and the introduction of a new TCR. However, any future model of T cell selection that attempts to deal with the population dynamics of T cell clones, will have to take secondary rearrangements into account. The fraction of clones surviving the overall selection, f, is equal to the fraction of cells surviving selection, which is well established (;3%; Ref. 50), divided by the average size of a T cell clone in the thymus. Estimating thymic clonal expansion from the incorporation of 5-bromo-29-deoxyuridine (BrdU) leads to the conclusion that thymocytes undergo one to three divisions after completion of TCR rearrangement, which corresponds to a clone size of two to eight cells in the naive repertoire. Alternatively, one can measure the dilution of 5- (and 6-) carboxyfluorescein diacetate succinimidyl ester (CFSE), a membrane binding dye, on the surface of dividing thymocytes. Using this technique, Hare et al. (56) found that the clone size of mature thymocytes could be as high 64 cells, and an additional analysis of their data show that it averaged 9 –12 cells. According to our model, an alloreactivity $1% implies that, on average, no more than 3.6 clonal divisions occur in the thymus, which means that average clone size should be #12 cells. Also, we find that at least one division is required to get a restriction ratio $6. Thus, thymocytes should undergo 1–3.6 clonal divisions on average, and the average clone size should be 2–12 cells. This prediction of the model is consistent with estimates based on BrdU and CFSE experiments. Thus, the upper bound of six thymic divisions (56) should hold only for a minority of thymocytes. We found that if affinity drives selection, then the frequency of clones responding to a foreign peptide presented on self MHC is inversely proportional to the number of distinct self peptides controlling thymocyte development. The model predicts that a response frequency in the experimental range 1026–1024 (13, 14) is possible only if any given self MHC presents 103–105 self peptides. This range is supported by elution studies, in which self peptides were eluted from the surface of APC and separated by mass spectroscopy or HPLC (34 –37). Given that as many as 108 distinct self peptides could in principle be extracted from all self
The Journal of Immunology proteins (see section on parameters), the range 103–105 implies that the overall process of protein cleavage, and peptide transport and presentation is extremely selective. Only one peptide in 103– 105 would be presented on a given MHC. These latter numbers are disturbingly small considering that only ;3 3 103 different peptides can be extracted from a virus of ;104 base pairs, such as HIV-1. (For example, the 9 genes of HIV-1 strain HXB2 (GenBank accession number txid11706) encode 9 proteins with a total of 3034 aa. For each protein nonamers can be generated ending at position 9, 10, . . . . Thus, 3034 2 (9 3 8) 5 2962 nonamers can be extracted from HXB2.) T cell development has been investigated from a variety of perspectives encompassing, on the one hand, molecular events underlying T cell selection and activation, and on the other hand, dynamics of thymic cell populations. However, the two levels of observation are not independent: molecular processes control population dynamics, and both determine T cell repertoire properties. A thorough understanding of T cell selection cannot be achieved without revealing the quantitative relationships between the these two levels of description of thymic selection. Our study is a first step toward such a unification. It reveals how quantitative parameters inferred from data on cellular and molecular level experiments contribute to the shaping of the mature T cell repertoire.
References 1. Fowlkes, B. J., and E. Schweighoffer. 1995. Positive selection of T cells. Curr. Opin. Immunol. 7:188. 2. Jameson, S. C., K. A. Hogquist, and M. J. Bevan. 1995. Positive selection of thymocytes. Annu. Rev. Immunol. 13:93. 3. Bevan, M. J. 1977. In a radiation chimaera, host H-2 antigens determine immune responsiveness of donor cytotoxic cells. Nature 269:417. 4. Waldmann, H. 1978. The influence of the major histocompatibility complex on the function of T-helper cells in antibody formation. Immunol. Rev. 42:202. 5. Zinkernagel, R. M. 1978. Thymus and lymphohemopoietic cells: their role in T cell maturation in selection of T cells’ H-2-restriction-specificity and in H-2 linked Ir gene control. Immunol. Rev. 42:224. 6. Schwartz, R. H. 1984. The role of gene products of the major histocompatibility complex in T cell activation and cellular interactions. In Fundamental Immunology, 1st Ed., W. E. Paul, ed. Raven Press, New York. p. 379. 7. von Boehmer, H. 1990. Developmental biology of T cells in T cell-receptor transgenic mice. Annu. Rev. Immunol. 8:531. 8. Nossal, G. J. 1994. Negative selection of lymphocytes. Cell 76:229. 9. Sprent, J., and S. R. Webb. 1995. Intrathymic and extrathymic clonal deletion of T cells. Curr. Opin. Immunol. 7:196. 10. Shortman, K., D. Vremec, and M. Egerton. 1991. The kinetics of T cell antigen receptor expression by subgroups of CD4181 thymocytes: delineation of CD41813(21) thymocytes as post-selection intermediates leading to mature T cells. J. Exp. Med. 173:323. 11. Bevan, M. J., R. E. Langman, and M. Cohn. 1976. H-2 antigen-specific cytotoxic T cells induced by concanavalin A: estimation of their relative frequency. Eur. J. Immunol. 6:150. 12. Ashwell, J. D., C. Chen, and R. H. Schwartz. 1986. High frequency and nonrandom distribution of alloreactivity in T cell clones selected for recognition of foreign antigen in association with self class II molecules. J. Immunol. 136:389. 13. Stockinger, H., K. Pfizenmaier, C. Hardt, H. Rodt, M. Rollinghoff, and H. Wagner. 1980. H-2 restriction as a consequence of intentional priming: T cells of fully allogeneic chimeric mice as well as of normal mice respond to foreign antigens in the context of H-2 determinants not encountered on thymic epithelial cells. Proc. Natl. Acad. Sci. USA 77:7390. 14. Zinkernagel, R. M. 1996. Immunology taught by viruses. Science 271:173. 15. Detours, V., R. Mehr, and A. S. Perelson. 1999. A quantitative theory of affinitydriven T cell repertoire selection. J. Theor. Biol. 200:389. 16. Detours, V., and A. S. Perelson. 1999. Explaining high alloreactivity as a quantitative consequence of affinity-driven selection of thymocytes. Proc. Natl. Acad. Sci. USA 96:5153. 17. Perelson, A. S., and G. F. Oster. 1979. Theoretical studies of clonal selection: minimal antibody repertoire size and reliability of self-nonself discrimination. J. Theor. Biol. 81:645. 18. Perelson, A. S., and G. Weisbuch. 1997. Immunology for physicists. Rev. Mod. Phys. 69:1219. 19. Wilson, I. A., and K. C. Garcia. 1997. T-cell receptor structure and TCR complexes. Curr. Opin. Struct. Biol. 7:839. 20. Weinand, R. G. 1990. Somatic mutation, affinity maturation and the antibody repertoire: a computer model. J. Theor. Biol. 143:343. 21. Lancet, D., E. Sadovsky, and E. Seidemann. 1993. Probability model for molecular recognition in biological receptor repertoires: significance to the olfactory system. Proc. Natl. Acad. Sci. USA 90:3715.
127 22. Madden, D. R. 1995. The three-dimensional structure of peptide-MHC complexes. Annu. Rev. Immunol. 13:587. 23. Merkenschlager, M., D. Graf, M. Lovatt, U. Bommhardt, R. Zamoyska, and A. G. Fisher. 1997. How many thymocytes auditions for selection? J. Exp. Med. 186:1149. 24. Zerrahn, J., W. Held, and D. H. Raulet. 1997. The MHC reactivity of the T cell repertoire prior to positive and negative selection. Cell 88:627. 25. Jameson, S. C., and M. J. Bevan. 1998. T cell selection. Curr. Opin. Immunol. 10:214. 26. Zinkernagel, R. M., and P. C. Doherty. 1974. Immunological surveillance against altered self components by sensitised T lymphocytes in lymphocytic choriomeningitis. Nature 251:547. 27. Nowak, M. A., K. Tarczy-Hornoch, and J. M. Austyn. 1992. The optimal number of major histocompatibility complex molecules in an individual. Proc. Natl. Acad. Sci. USA 89:10896. 28. De Boer, R. J., and A. S. Perelson. 1993. How diverse should the immune system be? Proc. R. Soc. London B 252:343. 29. Whitaker, L. and A. M. Renton. 1993. On the plausibility of the clonal expansion theory of the immune system in terms of the combinatorial possibilities of aminoacids in antigen and self-tolerance. J. Theor. Biol. 164:531. 30. Nemazee, D. 1996. Antigen receptor “capacity” and the sensitivity of self-tolerance. Immunol. Today 17:25. 31. Frelinger, J. A., and M. McMillan. 1996. The role of peptide specificity in MHC class I-restricted allogeneic responses. Immunol. Rev. 154:45. 32. Janeway, C. A., and P. Travers. 1995. Immunobiology. Garland, New York. 33. Klein, J. 1982. Immunology, The Science of Self-Nonself Discrimination. Wiley, New York. 34. Chicz, R. M., R. G. Urban, W. S. Lane, J. C. Gorga, L. J. Stern, D. A. Vignali, and J. L. Strominger. 1992. Predominant naturally processed peptides bound to HLA-DR1 are derived from MHC-related molecules and are heterogeneous in size. Nature 358:764. 35. Cox, A. L., J. Skipper, Y. Chen, R. A. Henderson, T. L. Darrow, J. Shabanowitz, V. H. Engelhard, D. F. Hunt, and C. L. Slingluff, Jr. 1994. Identification of a peptide recognized by five melanoma-specific human cytotoxic T cell lines. Science 264:716. 36. Hunt, D. F., H. Michel, T. A. Dickinson, J. Shabanowitz, A. L. Cox, K. Sakaguchi, E. Appella, H. M. Grey, and A. Sette. 1992. Peptides presented to the immune system by the murine class II major histocompatibility complex molecule I-Ad. Science 256:1817. 37. Engelhard, V. H. 1994. Structure of peptides associated with class I and class II MHC molecules. Annu. Rev. Immunol. 12:181. 38. Bevan, M. J. 1997. In thymic selection, peptide diversity gives and takes away. Immunity 7:175. 39. Garboczi, D. N., P. Ghosh, U. Utz, Q. R. Fan, W. E. Biddison, and D. C. Wiley. 1996. Structure of the complex between human T-cell receptor, viral peptide and HLA-A2. Nature 384:134. 40. Ding, Y., K. J. Smith, D. N. Garboczi, U. Utz, W. E. Biddison, and D. C. Wiley. 1998. Two human T cell receptors bind in a similar diagonal mode to the HLAA2/Tax peptide complex using different TCR amino acids. Immunity 8:403. 41. Garcia, K. C., M. Degano, L. R. Pease, M. Huang, P. A. Peterson, L. Teyton, and I. A. Wilson. 1998. Structural basis of plasticity in T cell receptor recognition of self peptide-MHC antigen. Nature 279:1166. 42. Manning, T. C., C. J. Schlueter, T. C. Brodnicki, E. A. Parke, J. A. Speir, K. C. Garcia, L. Teyton, I. A. Wilson, and D. M. Kranz. 1998. Alanine scanning mutagenesis of an ab T cell receptor: mapping the energy of antigen recognition. Immunity 8:413. 43. Silver, M. L., H. Guo, J. L. Strominger, and D. C. Wiley. 1992. Atomic structure of a human MHC molecule presenting an influenza virus peptide. Nature 360:367. 44. Garcia, K. C., M. Degano, R. L. Stanfield, A. Brunmark, M. R. Jackson, P. A. Peterson, L. Teyton, and I. A. Wilson. 1996. An ab T cell receptor structure at 2.5 Å and its orientation in the TCR-MHC complex. Science 274:209. 45. Ignatowicz, L., J. Kappler, and P. Marrack. 1996. The repertoire of T cells shaped by a single MHC/peptide ligand. Cell 84:521. 46. Surh, C. D., D. S. Lee, W. P. Fung-Leung, L. Karlsson, and J. Sprent. 1997. Thymic selection by a single MHC/peptide ligand produces a semidiverse repertoire of CD41 T cells. Immunity 7:209. 47. Tourne, S., T. Miyazaki, A. Oxenius, L. Klein, T. Fehr, B. Kyewski, C. Benoist, and D. Mathis. 1997. Selection of a broad repertoire of CD41 T cells in H-2Ma0/0 mice. Immunity 7:187. 48. van Meerrwijk, J. P. M., S. Marguerat, R. K. Lees, R. N. Germain, B. J. Fowlkes, and H. R. MacDonald. 1997. Quantitative impact of thymic clonal deletion on the T cell repertoire. J. Exp. Med. 185:377. 49. Laufer, T. M., J. DeKonig, J. S. Markowitz, D. Lo, and L. H. Glimcher. 1996. Unopposed positive selection and autoreactivity in mice expressing class II MHC only on thymic cortex. Nature 383:81. 50. Shortman, K., M. Egerton, G. J. Spangrude, and R. Scollay. 1990. The generation and fate of thymocytes. Semin. Immunol. 2:3. 51. Ernst, B., C. D. Surh, and J. Sprent. 1995. Thymic selection and cell division. J. Exp. Med. 182:961. 52. Scollay, R., and D. I. Godfrey. 1995. Thymic emigration: conveyor belts or lucky dips? Immunol. Today 16:268. 53. Penit, C., and F. Vasseur. 1997. Expansion of mature thymocyte subsets before emigration to the periphery. J. Immunol. 159:4848. 54. Egerton, M., R. Scollay, and K. Shortman. 1990. Kinetics of mature T-cell development in the thymus. Proc. Natl. Acad. Sci. USA 87:2579.
128
QUANTITATIVE CONSTRAINTS ON T CELL REPERTOIRE SELECTION
55. Lucas, B., F. Vasseur, and C. Penit. 1994. Production, selection, and maturation of thymocytes with high surface density of TCR. J. Immunol. 153:53. 56. Hare, K. J., R. W. Wilkinson, E. J. Jenkinson, and G. Anderson. 1998. Identification of a developmentally regulated phase of postselection expasion driven by thymic epithelium. J. Immunol. 160:3666. 57. Zinkernagel, R. M., and P. C. Doherty. 1974. Restriction of in vitro T cellmediated cytotoxicity in lymphocytic choriomeningitis within a syngeneic or semiallogeneic system. Nature 248:701. 58. Bevan, M. J., and P. J. Fink. 1978. The influence of thymus H-2 antigens on the specificity of maturing killer and helper cells. Immunol. Rev. 42:3. 59. Sprent, J. 1978. Role of H-2 gene products in the function of T helper cells from normal and chimeric mice in vivo. Immunol. Rev. 42:108. 60. Swain, S. L., P. E. Trefts, H. Y. Tse, and R. W. Dutton. 1977. The significance of T-B collaboration across haplotype barriers. Cold Spring Harbor Symp. Quant. Biol. 41:597. 61. Howard, J. 1980. MHC restriction, self-tolerance and the thymus. Nature 286:15. 62. Doherty, P. C., and J. R. Bennink. 1980. An examination of MHC restriction in the context of a minimal clonal abortion model for self tolerance. Scand. J. Immunol. 12:271. 63. Matzinger, P. 1993. Why positive selection? Immunol. Rev. 135:81. 64. Nanda, N. K., and E. E. Sercarz. 1995. The positively selected T cell repertoire: is it exclusively restricted to the selecting MHC? Intl. Immunol. 7:353. 65. Janeway, C. A. 1995. Ligands for the T-cell receptor: hard times for avidity models. Immunol. Today 16:223. 66. Young, A. C. M., W. Zhang, J. C. Sacchettini, and S. G. Nathenson. 1994. The three-dimentional structure of H-2Db at 2.4 Å resolution: implications for antigen-determinant selection. Cell 76:39. 67. Matsumura, M., D. H. Fremont, P. A. Peterson, and I. A. Wilson. 1992. Emerging principles for the recognition of peptide antigens by MHC class I molecules. Science 257:927. 68. Wang, C. R., A. R. Castan˜o, P. A. Peterson, C. Slaughter, K. F. Lindahl, and J. Deisenhofer. 1995. Nonclassical binding of formylated peptide in crystal structure of the MHC class Ib molecule H-2M3. Cell 82:655.
69. Fremont, D. H., M. Stura, E. A. Matsumura, P. A. Peterson, and I. A. Wilson. 1995. Crystal structure of H-2Kb-ovalbumine peptide complex reveals the interplay of primary and secondary anchor positions in the major histocompatibility complex binding groove. Proc. Natl. Acad. Sci. USA 92:2479. 70. Douek, D. C., R. D. McFarland, P. H. Kieser, E. A. Gage, J. M. Massey, B. F. Haynes, M. A. Polis, A. T. Haase, M. B. Feinberg, J. L. Sullivan, et al. 1998. Changes in thymic function with age and during the treatment of HIV infection. Nature 396:690. 71. Casanova, J. L., P. Romero, C. Widman, P. Kourilsky, and J. L. Maryanski. 1991. T cell receptor genes in a series of class I major histocompatibility complexrestricted cytotoxic T lymphocyte clones specific for a Plasmodium berghey nonapeptide: implications for T cell allelic exclusion and antigen-specific repertoire. J. Exp. Med. 174:1371. 72. Borgulya, P., H. Kishi, Y. Uematsu, and H. von Boehmer. 1992. Exclusion and inclusion of a and b T cell receptor alleles. Cell 69:529. 73. Malissen, M., J. Trucy, E. Jouvin-Marche, P. Cazenave, R. Scollay, and B. Malissen. 1992. Regulation of TCR a and b gene allelic exclusion during T-cell development. Immunol. Today 13:315. 74. McCormack, W. T., M. Liu, C. Postema, C. B. Thompson, and L. A. Turka. 1993. Excision products of TCR Va recombination contain in-frame rearrangements: evidence for continued V(D)J recombination in TCR1 thymocytes. Int. Immunol. 5:801. 75. Petrie, H. T., F. Livak, D. G. Schatz, A. Strasser, I. N. Crispe, and K. Shortman. 1993. Multiple rearrangements in T cell receptor a chain genes maximize the production of useful thymocytes. J. Exp. Med. 178:615. 76. Kouskoff, V., J. L. Vonesch, C. Benoist, and D. Mathis. 1995. The influence of positive selection on RAG expression in thymocytes. Eur. J. Immunol. 25:54. 77. Padovan, E., G. Casorati, P. Dellabona, S. Meyer, M. Brockhaus, and A. Lanzavecchia. 1993. Expression of two T cell receptor a chains: dual receptor T cells. Science 262:422. 78. Zal, T., S. Weiss, A. Mellor, and B. Stockinger. 1996. Expression of a second receptor rescues self-specific T cells from thymic deletion and allows activation of autoreactive effector function. Proc. Natl. Acad. Sci. USA 93:9102.