Science of the Total Environment 627 (2018) 852–859
Contents lists available at ScienceDirect
Science of the Total Environment journal homepage: www.elsevier.com/locate/scitotenv
Design and application of a web-based real-time personal PM2.5 exposure monitoring system Qinghua Sun a, Jia Zhuang b, Yanjun Du a, Dandan Xu a, Tiantian Li a,⁎ a b
National Institute of Environmental Health Sciences, Chinese Center for Disease Control and Prevention, Beijing 100020, China College of Environmental Sciences and Engineering, Peking University, Beijing 100871, China
H I G H L I G H T S
G R A P H I C A L
A B S T R A C T
• The RPPM2.5 system obtains personal PM2.5 exposure data at low cost. • The system is low labor and technical requirements. • The system provides relatively accurate real-time personal PM2.5 exposure data. • The system facilitates large-scale and real-time personal exposure assessments.
a r t i c l e
i n f o
Article history: Received 6 December 2017 Received in revised form 24 January 2018 Accepted 28 January 2018 Available online xxxx Editor: P. Kassomenos Keywords: Personal exposure assessment Real-time PM2.5 RPPM2.5 system Big data
a b s t r a c t Growing demand from public health research for conduct large-scale epidemiological studies to explore health effect of PM2.5 was well-documented. To address this need, we design a web-based real-time personal PM2.5 exposure monitoring system (RPPM2.5 system) which can help researcher to get big data of personal PM2.5 exposure with low-cost, low labor requirement, and low operating technical requirements. RPPM2.5 system can provide relative accurate real-time personal exposure data for individuals, researches, and decision maker. And this system has been used in a survey of PM2.5 personal exposure level conducted in 5 cities of China and has provided mass of valuable data for epidemiological research. © 2018 Elsevier B.V. All rights reserved.
1. Introduction Compositions of PM2.5 include toxic compounds, such as trace toxic organic pollutants: dioxins, polychlorinated naphthalene, chlorinated and brominated polycyclic aromatic hydrocarbons and so on (Jin et al., 2017a; Jin et al., 2017b; Zhang, 2015; Zhu et al., 2016). They all lead to ⁎ Corresponding author. E-mail address:
[email protected] (T. Li).
https://doi.org/10.1016/j.scitotenv.2018.01.299 0048-9697/© 2018 Elsevier B.V. All rights reserved.
diverse impacts on human health. According to global disease burden report of 2010, ambient particulate matter pollution was the ninth risk factor of disease burden in global, and the fourth in East Asia and China (Lim et al., 2012). It is imperative to conduct large-scale epidemiological studies to explore health effect of PM2.5. Exposure assessment is important in the epidemiological studies and health risk assessment (Zou et al., 2009). A lot of researches have proved the adverse impact of PM2.5 on human health (Pope et al., 2002; Lin et al., 2017; Wang et al., 2017). The exposure data of PM2.5 in these previous epidemiologic
Q. Sun et al. / Science of the Total Environment 627 (2018) 852–859
studies mainly came from fix site monitoring stations (Cao et al., 2011; Kan et al., 2007). However, the personal exposure concentration of PM2.5 will not only be affected by the concentration of outdoor environment, but also by other PM2.5 sources in indoor microenvironments (Gauvin et al., 2002; Rodes et al., 2001). In addition, the relationship between personal exposure levels and environmental monitoring sites may vary depending on population, location, seasons and analytical methods studied (Burke et al., 2001). It is inaccurate to make equal between personal exposure levels and data from fix site monitoring stations. As the method of personal exposure is the most accurate one that had be accepted among exposure measurement methods (Hu et al., 2017; Setton et al., 2011). Various technical have developed to improve the accuracy of air pollution exposure, for example using geographic information systems (Gumrukcuoglu, 2011), remote sensing techniques (Hashim and Sultan, 2010), land-use regression model (Hoek et al., 2008; Johnson et al., 2010), and machine learning model (Hu et al., 2017). These methods may improve the accuracy of exposure assessment. But time-activity patterns researches showed that people spend most of their time indoor, for example, residents in Suzhou urban area spend over 65% of time at home and 90% indoors, National Human Activity Pattern Survey in the United States respondents reported spending an average of 87% of their time in enclosed buildings (Klepeis et al., 2001; Zhu and Wang, 2015), the concentration of air pollution indoor are different from outdoor (Branis et al., 2005; Siddiqui et al., 2009). So the topic of accurate assessment of personal exposure monitoring is still considered as a significant issue. Apart from the accurate personal exposure is necessary, timely information about exposure level is also crucial. Getting real-time PM2.5 exposure level will help individuals especially the vulnerable individuals to take protective measurement and help health practitioners and decision makers to monitor potential health risk and initiate mitigation strategies (Wiemann et al., 2016). Meanwhile monitoring of personal exposure level has a disadvantage of expensive and laborious. And ask for a good compliance of subject. So it's difficult to conduct large-scale personal exposure level monitoring. Some small-scale personal exposure assessments were conducted (Habil et al., 2016; Janssen et al., 2011). But up to date, there was no large scale real-time personal exposure level survey. So a set of low-cost, low labor requirement, and low operating technical requirements systematic method was required. Therefore, we explore a personal exposure evaluation system, which can meet these requirements, based on mobile internet real-time transmission. The development of PM2.5 real-time monitoring technology and wearable device based on GPS laid the foundation for the development for it. Firstly, China has developed the National Urban Air Quality Realtime Publishing Platform. So the real-time outdoor PM2.5 concentration can be collected. Secondly, a new generation portable PM2.5 monitor has upgraded to low noise, small size, low weight, and low-cost. Using the new generation portable PM2.5 monitor, we can monitor the real-time PM2.5 concentration of indoor continuously. Thirdly, with the development of Global Position System (GPS) technology, many wearable devices can receive the real-time coordinates of wearer, so that the time-activity pattern of wearer can be collected. Based on these foundations, we explored a suit of real-time monitoring system of individual PM2.5 exposure. On the one hand we provide relative accurate exposure date for large-scale epidemiological studies based on this system. On the other hand we provide real-time personal exposure data for individuals, researches, and decision maker. To do this, this system was designed to collect three kind of real-time data: personal location information, indoor PM2.5 concentration, and outdoor PM2.5 concentration. Indoor PM2.5 concentration was monitored and uploaded to data platform every 5 min. Outdoor PM2.5 concentration come from national air pollution monitoring station was crawled from internet per hour and upload to data platform. We used GPS to get the real-time location information of individual, and
853
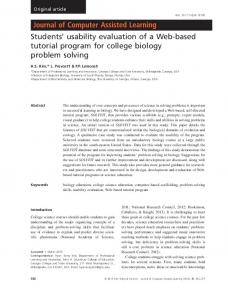
then matching real-time PM2.5 concentration of the location for the individual. 2. Technical frameworks RPPM2.5 system was design to run projects according to the management requirement of panel research. To meet the requirements, RPPM2.5 system includes three parts: network platform, PC terminal, and mobile phone terminal. The maximum allowable concurrent user number (research subjects) of this system is 300. The framework of RPPM2.5 system was shown in Fig. 1. The network platform has three modules: data collection module, data computing module, and data visualization module. Data collection module collects data of outdoor PM2.5 concentration from National Urban Air Quality Real-time Publishing Platform, data of indoor PM2.5 concentration from portable PM2.5 monitoring equipment, data of real-time location from wearable device. Data computing module matches spatiotemporal data, monitors the status of hardware, and evaluates personal exposure. Data visualization module offers interface of spatio-temporal data visualization, statistical data, and personal exposure feedback reports. PC terminal was used to manage and supervise the research project running in the system. Mobile phone terminal was installed different APP for researcher and research subjects separately. The researcher APP was used to manage the project and the research subjects was used to view the real-time location and exposure concentration. 2.1. Related hardware 2.1.1. Portable PM2.5 monitoring equipment in indoor micro-environment When the system is running, portable PM2.5 monitoring equipment (air quality monitor B3, Hike Inc.) can be used to monitor PM2.5 concentrations, temperature, humidity and other indicators in the resident indoor environment of research objects, such as home and office. We compare the data from the portable PM2.5 monitoring equipment with microPEM, and found a high correlation (Wang et al., 2016). The frequency of data acquisition is 5 min. In addition, the device can be connected to the Internet and can transport captured data to the monitor platform in real time. 2.1.2. Wearable device (including sim card) Wearable devices need to support the android system or IOS system, and has installed the applied APP for positioning. Each research subject wears a wearable device when the system is running. Basing on GPS's positioning technology about exposure behavior mode, wearable devices are mainly used for collecting data about individual location information. At the same time, wearable device have the function in connecting to the Internet, so that real-time information of location can be uploaded to the data collection module. Wristwatch and mobile are both optional wearable device. 2.1.3. Wi-Fi in indoor environments The indoor environments of each research subject often remaining will be equipped with Wi-Fi, so that the portable PM2.5 monitoring equipment in indoor environment can upload the data in time. Furthermore, wearable device can distinguish whether research subject has entered the indoor environment according to the MAC address of Wi-Fi. 2.2. Software framework 2.2.1. Network platform 2.2.1.1. Introduction of data collection module. Data collected by data collection module includes three types: real-time data about indoor PM2.5 concentrations, real-time data about outdoor PM2.5 concentrations and personal location data in indoor and outdoor environment.
854
Q. Sun et al. / Science of the Total Environment 627 (2018) 852–859
Fig. 1. The framework of RPPM2.5 system.
After opening the positioning function of the APP in wearable device, the system can identify and distinguish the identity of each individual according to the unique MAC address of each wearable device, and then interacts with the data platform of the server to obtain unique MAC address of Wi-Fi Router installed in homes, offices and other residents of research objects. At the same time, the positioning APP of the wearable device will scan the information of Wi-Fi Router nearby automatically to judge whether the research object is in indoor or outdoor environment. Among them, the positioning of individuals in indoor environment is realized when procedures below are all done. First, APP's background services need to detect the Basic Service Set Identifier (BSSID) matching with indoor Wi-Fi Router, and then match with the BSSID obtained from server database and upload the BSSID matching with Wi-Fi Router. Finally, realizing the positioning of indoor environment through Wi-Fi Router typed in early in library. While the positioning of outdoor environment will need to be provided with positioning interface by Baidu map (Baidu, Inc.), and use dual positioning mode of the network and GPS to obtain latitude, longitude, poi and other relevant location information of the individual. Collection of data about indoor PM2.5 concentrations: Previous research described that among various indoor location, people spend most of the time in home and work place (Wiemann et al., 2016). So the portable PM2.5 monitors are installed in office and home to monitor PM2.5 concentrations, temperature, and humidity in real time. After opening the monitor and setting up the connection of the network, the PM2.5 monitor will transmit the latest concentration value of every monitoring item to data collection module by 5 min via network transmission. The program of system back-end service will transmit the data to the system database after obtaining it. Collection of data about outdoor PM2.5 concentrations: Nowadays, a huge number of online air quality monitoring data are available (Habil
et al., 2016). Our system crawls opening real-time PM2.5 concentration data from internet. The monitoring data of national control monitoring site is published every hour in the National Urban Air Quality Real-time Publishing Platform. Data collection module crawls data from the platform through VPN network and sends directly to the database of our system in real-time. In addition, the positioning data will be temporarily stored in the buffer memory of wearable device and upload to the server at 18:00 every day when the SIM3G/4G network is instable and failed to upload data. The server will also update individual positioning data again, so that it can obtain and replenish outdoor PM2.5 concentrations data. 2.2.1.2. Introduction of data computing module. Data computing module has three main functions: hardware status monitoring, spatiotemporal data matching, and personal exposure evaluating. Hardware status monitoring: If the hardware was offline, the module will give a warning. Spatiotemporal data matching: if the research subject was indoors, the computing module will call the monitoring data of portable monitor of indoor. If the research subject was outdoors, the data of nearest fix-site monitor station will be called. Personal exposure evaluating: using the concentration data and time-activity data, data computing module evaluates personal exposure of PM2.5. 2.2.1.3. Introduction of data visualization module. Based on the Internet and the technology of Internet of things, the system builds a center platform of mass data about personal exposure to manage personal exposure mass data's real-time transmission, real-time storage, real-time view, spatial visualization, real-time call and so on. At the same time, the internet platform reserved a docking interface to external environment health data, so that it can realize the
Q. Sun et al. / Science of the Total Environment 627 (2018) 852–859
2.2.2.1. Home page. Home page shown the on line/off line status of different kind of hardware in all research projects with statistical table and map. The statistical table shows the number of device in different status. The map shows the location of device in different status. By looking at the home page, the researcher can master all the running projects. The home page was shown in Fig. 3.
Porjecting setting Home page Authority setting Project management Dynamic monitoring Detach devices Wi-Fi Router Device management
Monitor Wearable device
PC terminal
Personal information registration Reserach subjects management
Personal feedback report Data query Data management
855
Data visualization Data statistics
Researcher management
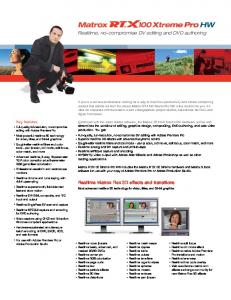
Fig. 2. The frame of PC terminal website.
sharing and application of mass real-time exposure parameters. Data visualization module includes: individual positioning data in indoor and outdoor environment, real-time data about indoor PM2.5 concentrations and real-time data about outdoor PM2.5 concentrations. Among them, average personal exposure concentrations of indoor and outdoor PM2.5 can be intuitively displayed on the map. Research subjects in one study area, wearable device having been assigned, the situation of online or offline of Wi-Fi Router, the positions of individuals and corresponding PM2.5 concentrations can be looked over when click on “Details”. All information about individual positions uploaded can be displayed on map and form travel tracks, then we can distinguish whether the research subject is at home, in outdoor or at the office through icons on the map. 2.2.2. PC terminal The interface on PC terminal include the system home page, project management, device management, research subjects management, data management and researcher management. The frame of PC terminal website was shown in Fig. 2.
2.2.2.2. Project management. This system runs projects according to the management requirement of panel research. The modules in project management include project setting, authority setting module, dynamic monitoring and detach device. In project setting module, the project can be divided into different phase according to the requirement of research project. Starting and ending time of each phase and the research subjects of each phase were manageable. The progress and status of each phase display in project setting module. In authority setting module, administrator can add several managers or deleted manager for each project. Manager has the authority of managing the project. In dynamic monitoring module, the total online time and online rate of research subjects (judging by wearable device) and the corresponding portable monitors can be queried. The real-time status of all devices can be queried and the system will give the warning information when the status of device was abnormality. This function can help researchers to distinguish misconfigurations or equipment failures. In detach device module, all devices attached to one or several research subjects can be detached by one key operation. This function help researchers to detach devices quickly and easily after the project was finished. 2.2.2.3. Device management 1. Indoor monitors' management module The information about indoor monitors' input and the monitor assigned to the individual can be looked over when getting into the PM2.5 personal exposure research integration platform-indoor monitor management module. Indoor PM2.5 monitors' management module includes: associated individual number, associated monitors number, indoor PM2.5 concentrations, and situation of whether the device is online, distribution condition and so on.
Fig. 3. Home page of website in PC terminal.
856
Q. Sun et al. / Science of the Total Environment 627 (2018) 852–859
2. Wearable device’ management module The information about wearable device’ input and the device assigned to the individual can be looked over when getting into the PM2.5 personal exposure research integration platform-wearable device’ management module. Wearable device’ management module includes: device name, device model, device number, wlanmac, service provider information and number of SIM card, situation of whether the device is online, distribution condition and so on. The MAC address from wearable gadget is a unique identifier that can be used to identify the identity of research subject. 3. Wi-Fi Router management module The information about Wi-Fi Router device's input and the device assigned to the individual can be looked over when getting into the PM2.5 personal exposure research integration platform-Wi-Fi Router management module. Wi-Fi Router management includes: device number, device model, device name, MAC address, maximum transfer rate, coordinate information, service provider information and number of SIM card and so on. A positioning point to the Wi-Fi Router device is needed to be assigned when configuring Wi-Fi Router information, which represents the position of home or office of the monitored individual. The MAC address belonging to Wi-Fi Router device is a unique identifier in identification of Wi-Fi Router, for example, the individual wearable device is identified by recognizing the Wi-Fi Router-MAC installed in home, office of individual to confirm that the individual is in corresponding environment.
(a) APP for researchers
2.2.2.4. Research objects management. Research objects management include module of personal information registration and personal feedback report. Personal information includes: name, age, sex, address, healthy condition, contact information, number of Wi-Fi Router assigned to individual, number of indoor PM2.5 monitors and number of wearable device. The detailed information about research subjects can be registrated, looked over and managed in personal information registration module. In personal feedback report, researchers can download the report of personal PM2.5 exposure for each research subjects. The content of report includes tables and figures showing the dynamic change and statistic value of personal PM2.5 exposure concentration and PM2.5 concentration in home, office, and outdoor. These reports can be sent to research subjects. 2.2.2.5. Data management. Based on the Internet and the technology of Internet of things, the project builds a center platform of mass data about personal exposure to manage personal exposure mass data's real-time transmission, real-time storage, real-time view, spatial visualization, real-time call and so on. At the same time, the center platform reserved a docking interface to external environment health data, so that it can realize the sharing and application of mass real-time exposure parameters. Data output in data output module are also including three types: individual positioning data in indoor and outdoor environment, real-time data about indoor PM2.5 concentrations and real-time data about outdoor PM2.5 concentrations. Among them, average personal exposure concentrations of indoor and outdoor PM2.5 can be intuitively displayed on the map. Research subjects in one study area, wearable device having been assigned, the situation of online or offline of Wi-Fi Router, the
(b)APP for research subjects
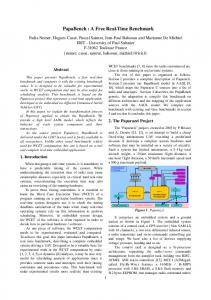
Fig. 4. APP interface in mobile phone terminal.
Q. Sun et al. / Science of the Total Environment 627 (2018) 852–859
positions of individuals and corresponding PM2.5 concentrations can be looked over when click on ‘Details’. All information about individual positions uploaded can be displayed on map and form travel tracks, then we can distinguish whether the research subject is at home, in outdoor or at the office through icons on the map. Besides, all valid information and data about research subjects during the monitoring process can be derived. 2.2.2.6. Researcher management. Researchers are the user of this system. Limits of authority on project management can be divided into senior administrator and administrator. Senior administrators: senior administrators have the limits of authority to increase, delete, modify and look over all projects. In addition, they have the limits of authority to increase, delete, and modify administrators, and assign projects to administrators. Administrators: administrators only have the limits of authority to increase, delete, modify and look over those projects belonging to them. 2.2.3. Mobile phone terminal Mobile phone terminal was installed different APP for researchers and research subjects separately (Fig. 4). The researcher APP was used to manage the project, hardware, and research subjects. The APP for research subjects display the real-time location and exposure concentration in real time. 3. Application of the system The RPPM2.5 system has been successfully applied in survey of PM2.5 personal exposure level conducted in 5 cities of China. There were about 100 research subjects in this survey. This system greatly improved the work efficiency of the project management, reduced the workload of data processing, and increased compliance of research subjects. With the help of RPPM2.5 system, this survey collected mass data of personal PM2.5 exposure, which included: time-activity pattern of each research subject, real-time positional trajectory of each research subject, real-time personal PM2.5 exposure concentration. As the research subjects distribute in different areas, average PM2.5 exposure concentrations
857
and average length of time in indoors and outdoors of different area can be intuitive showed on the map. In addition, when clicking on the details button, the PM2.5 concentration of the place where the research subject ever stayed can be looked over. Fig. 5 shows the temporal and spatial information and individual PM2.5 exposure concentration of a research subject every five minutes. Researchers can download all the data from the system, also the data that meet the query criteria. After this survey, we download data form RPPM2.5 system and assessed the personal exposure level and PM2.5 concentration from different data source of individual research subject (Fig. 6(a)) and all research subjects in each city (Fig. 6(b)). 4. Discussions and conclusion This paper described the design and application of a web-based realtime individual PM2.5 exposure monitoring system. This system resolved four important problems in personal PM2.5 exposure assessment: expensive device, high technical requirement, heavy workload, and poor compliance of research subjects. Expensive device: personal PM2.5 monitor are very expensive, so it's difficult for researchers to have enough amount of devices to conduct a research. We replace the expensive personal monitor with portable indoor monitor and outdoor fix-site monitoring net. High technical requirement: the operation of personal PM2.5 monitor was complicated and time-costing. This system just needs a simple operation training of matching hardware before survey. Heavy workload: it's a heavy work to supervise the survey process and process data before. This system was constructed based on the internet of things, and provide real-time online monitoring. What's more this system can match, clean, and statistics data automatic. Poor compliance of research subjects: Personal exposure survey asked for high compliance of research subjects. This system provides real-time exposure concentration and personal feedback report for each research subjects. It was helpful for research subjects to know exposure level of one's own. So the compliance of research subjects was improved. There are several limitations in this system. Firstly, outdoor exposure concentration of PM2.5 used in RPPM2.5 comes from outdoor fix-site monitor station at present. The system matches the concentration of
Fig. 5. Real-time positional trajectory and real-time PM2.5 exposure concentration of one research subject.
858
Q. Sun et al. / Science of the Total Environment 627 (2018) 852–859
Fig. 6. Personal PM2.5 exposure and PM2.5 concentration from different data source.
the nearest fix-site monitor station for each research subject every hour according to the real-time location. The time and spatial resolution was not high enough. Future research about this system is investigating a real-time outdoor PM2.5 concentration date with higher time and spatial resolution (1 km × 1 km) and transferring to the system. The system can match the concentration of the grid to each research subjects according to the real-time location to further improve the accuracy of exposure evaluation. Secondly, this system monitors indoor PM2.5 concentration using portable PM2.5 monitoring equipment in home and office. But in other indoor environment and vehicle, the concentration uses the outdoor fix-site monitoring data, which may deviate from the true value. Even though people spend relatively shorter time in these environments, researchers using this system should still take notice of this limitation. Thirdly, researcher will not receive the warning message until they open the webpage in the present system. To solve this problem, we will add an alarm module in the APP for researchers in the following upgrading to receive warning messages. In general, this system overcomes several difficulties in personal PM2.5 exposure assessment. And will provide technical support for conducting large-scale personal PM2.5 exposure assessment and realtime exposure assessment. Conflict of interest statement The authors declare they have no actual or potential competing financial interests. Acknowledgement This work was supported by National Natural Science Foundation of China [grant number 91543111]; Beijing Natural Science Foundation [grant number 7172145]; and National High-level Talents Special Support Plan of China for Young Talents. References Wiemann, S., Brauner, J., Karrasch, P., Henzen, D., Bernard, L., 2016. Design and prototype of an interoperable online air quality information system. Environ. Model. Softw. 79: 354–366. https://doi.org/10.1016/j.envsoft.2015.10.028.
Cao, J., Yang, C., Li, J., Chen, R., Chen, B., Gu, D., et al., 2011. Association between long-term exposure to outdoor air pollution and mortality in China: a cohort study. J. Hazard. Mater. 186:1594–1600. https://doi.org/10.1016/j.jhazmat.2010.12.036. Branis, M., Rezacova, P., Domasova, M., 2005. The effect of outdoor air and indoor human activity on mass concentrations of PM(10), PM(2.5), and PM(1) in a classroom. Environ. Res. 99:143–149. https://doi.org/10.1016/j.envres.2004.12.001. Gauvin, S., Reungoat, P., Cassadou, S., Dechenaux, J., Momas, I., Just, J., 2002. Contribution of indoor and outdoor environments to PM2.5 personal exposure of children–VESTA study. Sci. Total Environ. 297:175–181. https://doi.org/10.1016/S0048-9697(02) 00136-5. Gumrukcuoglu, M., 2011. Urban air pollution monitoring by using geographic information systems: a case study from Sakarya, Turkey. Carpathian Journal of Earth & Environmental Sciences 6, 73–84. Hashim, B.M., Sultan, M.A., 2010. Using remote sensing data and GIS to evaluate air pollution and their relationship with land cover and land use in Baghdad City. Iranian J. Earth. Sci. 2, 20–24. Hoek, G., Hoogh, B.K.D., Vienneau, D., Gulliver, J., Fischer, P., Briggs, D., 2008. A review of land-use regression models to assess spatial variation of outdoor air pollution. Atmos. Environ. 42:7561–7578. https://doi.org/10.1016/j. atmosenv.2008.05.057. Hu, K., Rahman, A., Bhrugubanda, H., Sivaraman, V., 2017. HazeEst: machine learning based metropolitan air pollution estimation from fixed and mobile sensors. IEEE Sensors J. 17:3517–3525. https://doi.org/10.1109/JSEN.2017.2690975. Janssen, N.A.H., de Hartog, J.J., Hoek, G., Brunekreef, B., Lanki, T., Timonen, K.L., et al., 2011. Personal exposure to fine particulate matter in elderly subjects: relation between personal, indoor, and outdoor concentrations. J. Air Waste Manage. Assoc. 50: 1133–1143. https://doi.org/10.1080/10473289.2000.10464159. Jin, R., Liu, G., Jiang, X., Liang, Y., Fiedler, H., Yang, L., et al., 2017a. Profiles, sources and potential exposures of parent, chlorinated and brominated polycyclic aromatic hydrocarbons in haze associated atmosphere. Sci. Total Environ. 593-594:390–398. https://doi.org/10.1016/j.scitotenv.2017.03.134. Jin, R., Zheng, M., Yang, H., Yang, L., Wu, X., Xu, Y., et al., 2017b. Gas-particle phase partitioning and particle size distribution of chlorinated and brominated polycyclic aromatic hydrocarbons in haze. Environ. Pollut. 231:1601–1608. https://doi.org/ 10.1016/j.envpol.2017.09.066. Kan, H., London, S.J., Chen, G., Zhang, Y., Song, G., Zhao, N., et al., 2007. Differentiating the effects of fine and coarse particles on daily mortality in Shanghai, China. Environ. Int. 33:376–384. https://doi.org/10.1016/j.envint.2006.12.001. Klepeis, N.E., Nelson, W.C., Ott, W.R., Robinson, J.P., Tsang, A.M., Switzer, P., et al., 2001. The National Human Activity Pattern Survey (NHAPS): a resource for assessing exposure to environmental pollutants. J. Expo. Anal. Environ. Epidemiol. 11:231–252. https://doi.org/10.1038/sj.jea.7500165. Lim, S.S., Vos, T., Flaxman, A.D., Danaei, G., Shibuya, K., Adair-Rohani, H., et al., 2012. A comparative risk assessment of burden of disease and injury attributable to 67 risk factors and risk factor clusters in 21 regions, 1990–2010: a systematic analysis for the Global Burden of Disease Study 2010. Lancet 380:2224–2260. https://doi.org/ 10.1016/S0140-6736(12)61766-8. Lin, H., Ratnapradipa, K., Wang, X., Zhang, Y., Xu, Y., Yao, Z., et al., 2017. Hourly peak concentration measuring the PM 2.5 -mortality association: results from six cities in the Pearl River Delta study. Atmos. Environ. 161:27–33. https://doi.org/10.1016/j. atmosenv.2017.04.015.
Q. Sun et al. / Science of the Total Environment 627 (2018) 852–859 Burke, J.M., Zufall, M.J., Ozkaynak, H., 2001. A population exposure model for particulate matter: case study results for PM(2.5) in Philadelphia, PA. J. Expo. Anal. Environ. Epidemiol. 11:470. https://doi.org/10.1038/sj.jea.7500188. Johnson, M., Isakov, V., Touma, J.S., Mukerjee, S., Özkaynak, H., 2010. Evaluation of landuse regression models used to predict air quality concentrations in an urban area. Atmos. Environ. 44:3660–3668. https://doi.org/10.1016/j.atmosenv.2010.06.041. Pope 3rd, C.A., Burnett, R.T., Thun, M.J., Calle, E.E., Krewski, D., Ito, K., et al., 2002. Lung cancer, cardiopulmonary mortality, and long-term exposure to fine particulate air pollution. JAMA 287:1132–1141. https://doi.org/10.1001/jama.287.9.1132. Rodes, C.E., Lawless, P.A., Evans, G.F., Sheldon, L.S., Williams, R.W., Vette, A.F., et al., 2001. The relationships between personal PM exposures for elderly populations and indoor and outdoor concentrations for three retirement center scenarios. J. Expo. Anal. Environ. Epidemiol. 11:103–115. https://doi.org/10.1038/sj.jea.7500155. Setton, E.M., Allen, R., Hystad, P., Keller, C.P., 2011. Outdoor air Pollution and Health – a Review of the Contributions of Geotechnologies to Exposure Assessment. Springer Netherlands. Siddiqui, A.R., Lee, K., Bennett, D., Yang, X., Brown, K.H., Bhutta, Z.A., et al., 2009. Indoor carbon monoxide and PM2.5 concentrations by cooking fuels in Pakistan. Indoor Air 19:75–82. https://doi.org/10.1111/j.1600-0668.2008.00563.x. Habil, M., Massey, D.D., Taneja, A., 2016. Personal and ambient PM2.5 exposure assessment in the city of Agra. Data Brief 6:495–502. https://doi.org/10.1016/j. dib.2015.12.040.
859
Wang, J., Wang, Q., Sun, Q., Du, Y., Wang, Q., Li, T., 2016. Assessment on household PM2.5 monitoring instruments (in Chinese). J. Environ. Health 33:1086–1089. https://doi. org/10.16241/j.cnki.1001-5914.2016.12.015. Wang, J., Xing, J., Mathur, R., Pleim, J.E., Wang, S., Hogrefe, C., et al., 2017. Historical trends in PM2.5-related premature mortality during 1990–2010 across the northern hemisphere. Environ. Health Perspect. 125:400–408. https://doi.org/10.1289/EHP298 (Epub 2016 Aug 19). Zhang, X., Zhu, Q., Dong, S., Zhang, H., Wan, X., Wang, M., Gao, L., Zheng, M., 2015. Particle size distributions of PCDD/Fs and PBDD/Fs in ambient air in a suburban area in Beijing, China. Aerosol Air Qual. Res. 15:1933–1943. https://doi.org/10.4209/ aaqr.2015.06.0421. Zhu, W., Wang, H., 2015. Refined Assessment of Human PM2.5 Exposure in Chinese city by Incorporating Time-activity Data. AGU Fall Meeting. Zhu, Q., Zhang, X., Dong, S., Gao, L., Liu, G., Zheng, M., 2016. Gas and particle size distributions of polychlorinated naphthalenes in the atmosphere of Beijing, China. Environ. Pollut. 212:128–134. https://doi.org/10.1016/j.envpol.2016.01.065. Zou, B., Wilson, J.G., Zhan, F.B., Zeng, Y., 2009. Air pollution exposure assessment methods utilized in epidemiological studies. J. Environ. Monit. 11:475–490. https://doi.org/ 10.1039/b813889c.