technology with parallel signal detection (PSD). This architecture offers flexible bandwidth resource sharing at fine granularity. Other features include high-speed ...
JOURNAL OF SELECTED TOPICS IN QUANTUM ELECTRONICS
1
Design and Evaluation of a Flexible-Bandwidth OFDM-Based Intra Data Center Interconnect Philip N. Ji, Dayou Qian, Konstantinos Kanonakis, Christoforos Kachris and Ioannis Tomkos
Abstract—Data center networks are facing growing challenges to deliver higher bandwidth efficiency, lower latency, better flexibility and lower cost. Various optical interconnect schemes have been proposed to take advantage of the high bandwidth capacity and low power consumption offered by optical switching. However these schemes cannot offer flexible bandwidth sharing due to the large granularity in optical circuit switching, and they require costly optical components. In this paper, we introduce a novel data center network architecture based on cyclic arrayed waveguide grating device and multiple-input multiple-output (MIMO) orthogonal frequency division multiplexing (OFDM) technology with parallel signal detection (PSD). This architecture offers flexible bandwidth resource sharing at fine granularity. Other features include high-speed switching, low and uniform latency, and the ability to change the data rates dynamically. By eliminating costly optical components and keeping the core optical router passive and static, the power consumption, hardware cost and operation cost are reduced. The fine granularity bandwidth sharing and MIMO switching through PSD are verified experimentally. We also propose and evaluate efficient subcarrier allocation schemes to achieve high bandwidth utilization. Finally, we present the implementation of an efficient scheduler for the bandwidth allocation of the proposed scheme. Index Terms—Optical interconnects, MIMO OFDM, data center networks.
I. I NTRODUCTION S the global Internet traffic growing exponentially, the data centers, which host many Internet application servers, are also facing rapid increase in bandwidth demands. Due to emerging applications like cloud computing next generation data centers need to achieve low latency, high throughput, high flexibility, high re-source efficiency, low power consumption, and low cost. Furthermore, as more and more processing cores are integrated into a single chip, the communication requirements between racks in the data centers will keep increasing significantly. By integrating hundreds of cores into the same chip (e.g. Single-chip Cloud ComputerSCC [1]) we can achieve higher processing power in the data center racks. However these cores require a fast and low-latency interconnection scheme to communicate with the storage system and the other servers inside or outside of the rack. Optical technology has been adopted in data center networks (DCN) due to its high bandwidth capacity. However, it is mainly used for point-to-point links, while the intra Data
A
P. N. Ji and D. Qian are with NEC Laboratories America, Inc., 4 Independence Way, Princeton, New Jersey 08540, USA K. Kanonakis, C. Kachris and I. Tomkos are with Athens Information Technology, Athens, Greece
Center Network (DCN) interconnection is still based on electrical switching fabrics, which have high power consumption and limited bandwidth capacity [2]. Currently, the power consumption of data center networks accounts for 23% of the total IT power consumption [3]. However, due to the high communication requirements of the future data center networks, it is estimated that the data center networks will account for much higher percentages of the overall power consumption [4]. Therefore it is expected that data center networks may evolve to all-optical networks, much like telecommunication networks themselves which have gradually evolved from electrical to opaque and finally transparent, using all-optical switches. In recent years, several hybrid optical/electrical or all-optical interconnect schemes for DCN have been proposed [5], [6], [7], [8], [9], [10]. Many of them rely on large scale fiber cross-connects (FXC) ([5], [6], [9]) or multiple wavelengthselective switches (WSS) [7], which are though costly and imply slow switching rates (at the millisecond timescale). Having a large scale FXC also present an undesirable single source-of-failure. A recent work in [8] uses silicon electrooptic mirroring WSS and semiconductor optical amplifierbased switch to achieve nanosecond scale switching, making all-optical packet level routing possible. However the key components are not commercially available and have low scalability. Other architectures use tunable wavelength converters ([9], [10]). They are also costly and do not allow bandwidth resource sharing among the connections. Some of them also require electrical or optical buffer. In this paper we propose and experimentally demonstrate a novel all-optical DCN interconnect which, for the first time to our knowledge, combines a passive cyclic arrayed waveguide grating (CAWG) core router with the technologies of orthogonal frequency division multiplexing (OFDM) modulation and parallel signal detection (PSD). The proposed architecture achieves fast switching (nanosecond speed), low latency, low power consumption, multiple-input multipleoutput (MIMO) switching, while allowing fine granularity bandwidth sharing without the need for FXC, WSS, or tunable wavelength converters. Moreover, we investigate methods of efficiently performing resource allocation in this OFDM-based interconnect, evaluate their delay and throughput performance and study their feasibility for hardware implementation. II. MIMO OFDM F LEXIBLE BANDWIDTH I NTRA -DCN A RCHITECTURE A. MIMO OFDM A key technology for this DCN architecture is MIMO OFDM. OFDM is a modulation technology to achieve high
JOURNAL OF SELECTED TOPICS IN QUANTUM ELECTRONICS
ing planar lightwave circuit technology. The cyclic wavelength arrangement characteristic avoids the wavelength contention and eliminates the need for large scale core FXC or multiple WSS units. Several other DCN architectures also use 2 CAWG as the core optical router [Ye, Xi, Gripp]. a1a2a3a4a5a6a7a8
Modulated signals over orthogonal RF subcarriers Modulator for subcarrier 1
Serial to parallel conversion
Modulator for subcarrier 2
f3
Output a b1c2d3e4f5g6h7a8
Input b
Output b
Input c
Output c
Input d
Output d
Input e
Output e
Input f
Output f
Input g
Output g
Input h
Output h
c1c2c3c4c5c6c7c8
f2 (a) OFDM signal in time domain
Modulator for subcarrier 3
Cyclic AWG
b1b2b3b4b5b6b7b8
f1
Data
a1b2c3d4e5f6g7h8
Input a
+
c1d2e3 f4g5h6a7b8
d1e2f3g4h5a6b7c8
d1d2d3d4d5d6d7d8
OFDM signal
e1e2e3e4e5e6e7e8 Modulator for subcarrier N
f4
(b) OFDM signal spectrum in frequency domain
e1f2g3h4a5b6c7d8
f1g2h3a4b5c6d7e8
f1 f2 f3 f4 f5 f6 f7 f8
Fig. 1.
OFDM signal generation
g1g2g3g4g5g6g7g8
g1h2a3b4c5d6e7 f8
h1h2h3h4h5h6h7h8
h1a2b3c4d5e6f7g8
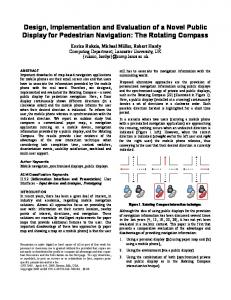
spectral efficiency transmission by parallel transmission of Fig. 2. Cyclic of a routing CAWG.of a CAWG. spectrally overlapped, lower rate frequency-domain tributaries Fig.wavelength 2. Cyclic routing wavelength where the signals are mathematically orthogonal over one symbol period (Fig. 1). Originally applied for copper and wireless communications, OFDM technology has been adopted B. Cyclic Arrayed Waveguide Grating in optical communication network applications in the past The key optical component for the proposed DCN archifew years as the high speed digital signal processing and tecture is a CAWG. An N × N CAWG (also called an broadband DAC/ADC became feasible [11][12]. Because of AWG router or a cyclic interleaver) is a passive optical multhe advantages such as better tolerance to fiber dispersion and tiplexer/demultiplexer that routes different wavelengths from the ability to perform one-tap equalization at the frequency N different input ports to N different output ports in a cyclic domain, OFDM has been demonstrated to be a good candidate manner. Fig. 2 illustrates the cyclic wavelength arrangement for long distance transmission [13][14][15]. OFDM technol- of an 8 × 8 CAWG. CAWG is usually constructed using ogy has also been proposed for optical access network to planar lightwave circuit technology. The cyclic wavelength take advantage of its flexibility to share the spectrum among arrangement characteristic avoids the wavelength contention multiple users, such as in the application of OFDMA-PON and eliminates the need for large scale core FXC or multiple (orthogonal frequency division multiple access passive optical WSS units. Several other DCN architectures also use CAWG network) [16]. The feasibility of using OFDM technology for as the core optical router ([9],[10]). data center application has been discussed in [17], but no actual network architecture has been proposed for the intraC. The Proposed DCN Interconnect Architecture data center network. The schematic of the proposed MIMO OFDM DCN interThere are mainly two types of OFDM implementation in connect architecture is illustrated in Fig. 3. It contains N racks, optical transmission. The first type is to generate the OFDM each accommodating multiple servers connected through a signal electrically and modulate the signal to an optical carrier top-of-the-rack switch (ToR). Inter-rack communications are [13][14][15]. This is referred to as the optical OFDM (Operformed by interconnecting these ToRs through the DCN. OFDM). The receiver can use direct detection or coherent The inter-rack signals at each rack are aggregated and detection techniques. The second type is to generate the sent to a transmitter, which contains an OFDM modulator orthogonal subcarriers (also called tones) optically and then that modulates the aggregated signals into K OFDM data apply a signal onto each subcarrier [18]. This is called the streams with appropriate subcarrier assignments, where K is all-optical OFDM (AO-OFDM). the number of destination racks that the signals from this The DCN architecture proposed in this chapter is based source rack need to travel to, so 0 ≤ K ≤ N . Each source rack on an O-OFDM implementation. It demonstrates network- can be connected to a different number of destination racks at level MIMO operation because each rack can send the same each time (e.g. K can be different for each rack). These OFDM OFDM signal to multiple destination racks simultaneously, data streams are converted to K WDM optical signals through and multiple racks can send the signal the same destination an array of K directly modulated lasers (DMLs) or K sets of rack at the same time by modulating data on different OFDM laser/modulator with different wavelengths. If these lasers are subcarriers in the RF domain. of the fixed wavelength type, N units will be needed since the At each receiver, a common photo-detector (PD) can si- signal from each ToR might be switched to any destination multaneously detect multiple O-OFDM signals from many rack potentially. If the number of the racks increases, it is not cost-efficient sources in different optical wavelengths, provided that there is no contention in the OFDM subcarriers and the WDM to install N lasers at each transmitter. Moreover, it is not wavelengths. This is referred to as the parallel signal detection likely that each rack needs to communicate with all other racks (PSD) technology [19], and has been demonstrated in OFDM simultaneously. Therefore the N fixed wavelength lasers in the WDM-based optical networks [20]. transmitter can be replaced with fewer tunable lasers.
subcarrier contention, so that a single PD can receive all WDM channels simultaneously through the PSD technology. The received OFDM signal is then demodulated back to the original data format and send to the appropriate servers through JOURNAL OF SELECTED TOPICS IN QUANTUM ELECTRONICS the destination ToR.
Combiner
OFDM mod
DML N Servers
Receiver 1
PD 1
OFDM demod
Receiver 2
PD 2
Transmitter 2
When a new switching state is required, the OFDM modulators execute the Servers new subcarrier assignments determined by the centralized controller, and the reRack 2 spective lasers turns on and off to generate new OFDM WDM signals. Transmitter N PD N ToR N Some servers in the DCN have constant large volume communication with Servers for them to go though the ToR before exiting other servers. It will be less efficient Rack Ntraffic volume from these servers might even the rack. In some cases, the large Optical spectrum congest the ToR. To serve these “super servers” more effectively, the MIMO RF spectrum OFDM DCN architecture can be extended to reserve dedicated OFDM WDM transmittersFig.and ports MIMO for them. servers can bypass the 3. dedicated ArchitectureCAWG of the proposed OFDMThese DCN interconnect. ToR and connect to the transmitters directly, as illustrated in Fig. 4.
…
…
ToR 1 Servers
Transmitter 1
Fig. 3. Architecture of the MIMO OFDM Rack 1DCN. ToR 2
NxN Cyclic AWG
OFDM demod
…
ToR 1
…
DML 1
6
3
Rack 1
ToR 2 Servers
Receiver N
OFDM demod
Rack 2
ToR N Servers Rack N
MIMO switching: Conventional optical DCN architectures use optical circuit switching. Each rack can only talk to one Rack Servers rack at a time. It needs to wait for the current connection Super server Transmitter j to complete before another connection can be established for the same rack. Due to the MIMO OFDM operation in this Fig. 4. ToR bypass for “super servers”. Fig. 4. ToR bypass for ”super servers”. architecture, each rack can communicate with multiple racks simultaneously. Thus the waiting time is eliminated and high interconnect efficiency can be achieved. These O-OFDM signals are then combined through a WDM 2.4 DCN architecture features Flexible bandwidth allocation and sharing: By flexibly combiner to form an OFDM-modulated WDM signal and selecting the number of subcarriers at each O-OFDM transmitsent to the N × N CAWG. Due to the cyclic non-blocking ter and Comparingwavelength to other optical or hybrid DCN architectures proposed so far, thissharing the total available subcarriers at each receiver arrangement of the CAWG, the WDM channels are among multiple sources, this architecture allows providing MIMO OFDM DCN architecture offers the following advantages: routed to the respective output ports for the destination racks. different bandwidth allocations for different source-destination Each optical Rx receives one WDM channel from each input pairs at the same time, which can be dynamically modified MIMO switching: Conventional optical DCN architectures use optical circuit port and all WDM channels can be simultaneously received by over time. Such a feature is extremely suitable for DCN apswitching. aEach rack can only talk to one rack at a time. It needs to wait for the single PD using the PSD technology. Through a centralized plications current connection to complete before another candescribed be established for where there are frequent setting up and tearing down OFDM subcarrier allocation scheme connection that will be of connections and large fluctuation in bandwidth demands. the same rack. Due MIMO in thiscontention architecture, below, it to is the ensured thatOFDM there isoperation no subcarrier in each rack Fine granularity switching: Since the O-OFDM signal is can communicate withchannel multiple racks simultaneously. Thus theOFDM waiting time is any WDM at the receiver side. The received generated electrically, the switching granularity is much finer eliminated signal and high interconnect efficiency achieved. is then demodulated back tocan thebe original data format and than the current optical DCN technologies. For example, in send to the appropriate servers through the destination ToR. direct optical point-to-point link, the granularity is one fiber; in Flexible bandwidth and state sharing: By flexibly selecting the number of When a allocation new switching is required, the OFDM modua regular WDM system, the granularity is one WDM channel, subcarrier at eachexecute O-OFDM transmitter and assignments splitting anddetermined sharing theby total availalators the new subcarrier which typically carries 10 Gb/s, 40 Gb/s or 100 Gb/s of data; ble subcarriers at each receiver among multiple sources, allows the centralized scheduler, and the respective lasersthis turnarchitecture on and in the AO-OFDM system, the granularity is one optically different bandwidth allocations different source-destination pairs inat the same off to generate the newfor OFDM WDM signals. Some servers generated OFDM subcarrier, which is typically 10 Gb/s or time. And the thisDCN allocation can be dynamically over time. Such feature is may constantly have large changed communication volumes higher. The switching granularity in the O-OFDM system suitable forwith DCNcertain application where there up and down servers. It will be are lessfrequent efficientsetting for them to tearing go is a single electrically-generated OFDM subcarrier, which is of connections andthe large fluctuation in bandwidth demands. though ToR before exiting the rack. In some cases, the typically in the order of tens of Mb/s or less. Having a finer large traffic volume from these servers might even congest granularity allows more flexible bandwidth allocation and thus the ToR.switching: To serve these servers” signal more effectively, Fine granularity Since“super the O-OFDM is generatedtheelectrically, more efficient spectrum utilization. MIMO OFDM isDCN cancurrent be extended reserve the switching granularity mucharchitecture finer than the opticaltoDCN technologies. Flexible modulation format and data rate: OFDM moddedicated OFDM transmitters CAWG For example, in direct opticalWDM point-to-point link,and thededicated granularity is one fiber; in ulation also provides the capability to change the modulation ports for them. These servers can bypass the ToR and connect order to adjust the amount of data to be carried within the to the transmitters directly, as illustrated in Fig. 4. same subcarrier (or group of subcarriers). For example, the OFDM signal in each subcarrier can be modulated using D. DCN Interconnect Architecture Features BPSK, QPSK, 16-QAM, 64-QAM, etc. This allows a variable Comparing it to other optical or hybrid intra-DCN archi- amount of data to be packed within the same subcarriers as tectures proposed so far, the proposed architecture offers the these modulation formats encode a different number of data bits in each symbol. This feature could be potentially used to following advantages: ToR
Transmitter i
To Cyclic AWG
JOURNAL OF SELECTED TOPICS IN QUANTUM ELECTRONICS
TABLE I 9 WAVELENGTH AND SUBCARRIER ASSIGNMENTS IN MIMO OFDM DCN EXPERIMENT Table 1. Wavelength and subcarrier assignments in MIMO OFDM DCN experiment
From ToR 1 λ3 λ6 193.5 THz 193.2 THz 1549.32 nm 1551.72nm (To ToR 3) (To ToR 6) SC 100-450 QPSK .A. SC 300-450 64QAM .C. SC 200-600 16QAM .B.
Test
1 2
From ToR 2 λ4 λ7 193.4 THz 193.1 THz 1550.12 nm 1552.52 nm (To ToR 3) (To ToR 6) SC 451-800 QPSK .D. SC 850-950 SC 50-150, QPSK .F. 700-900 QPSK .E.
SC: subcarriers
The RF spectra of the OFDM signals are measured at each OFDM transmitter output each the receiver output for different tests (Fig. 5). They show that different OFDM signals from the same transmitter can possess overlapping (such as subcarrier group A and subcarrier group B in Test 1) or non-contiguous subcarriers (such III. E XPERIMENTAL D EMONSTRATION OF F LEXIBLE as subcarrier group E), and through the PSD technology each receiver can sucMIMO OFDM O signals PTICAL I NTERCONNECT cessfully detect and receive OFDM from multiple sources, provided that these OFDM subcarriers do not overlap. No guard band is required when assigning The the OFDM subcarriers, as shown at the receiver of ToR 3 inofTest Besides alflexible MIMO interconnect capability the1. proposed locating subcarriers, the centralized controller alsotestbed. balances the subcarrier architecture is demonstrated on a lab The opticalpowers core among signals from different inputs. ‐20
‐20
‐30
‐30
‐30
‐40 ‐50 ‐60
‐50 ‐60 ‐70
‐80
‐80
2 4 Frequency (GHz)
6
‐40 ‐50 ‐60 ‐70 ‐80
0
2 4 Frequency (GHz)
6
‐20
‐20
‐30
‐30
‐30
‐40 ‐50 ‐60
‐40 ‐50 ‐60
‐70
‐70
‐80
‐80
0
2 4 Frequency (GHz)
Power (dBm)
‐20
Power (dBm)
6
6
‐30
Power (dBm)
‐20
‐30 ‐40 ‐50 ‐60
‐70
‐70
‐80
‐80
0
2 4 Frequency (GHz)
6
0
2 4 Frequency (GHz)
6
0
2 4 Frequency (GHz)
6
‐60
‐80
2 4 Frequency (GHz)
‐30
‐60
6
‐50
‐20
‐50
2 4 Frequency (GHz)
‐40
‐20
‐40
0
‐70
0
Power (dBm)
Power (dBm)
‐40
‐70
0
Power (dBm)
‐20
Power (dBm)
Power (dBm)
router is an 8 × 8 CAWG with 100 GHz spacing by Enablence [25]. Each transmitter contains two cavity D tunable external A+D A lasers Test1: with 10 GHz intensity modulators. The OFDM signals To ToR3 are generated by an arbitrary waveform generator. The main advantage of the B+E does not E testbedE is that the PSD B demonstrated require guard band between subcarrier groups from different Test2: To ToR3 sources, because of the short distance in DCN compared to other optical F different modulation C networks. Furthermore, C+F formats for different subcarrier groups can be used in this Test1&2: To ToR6 testbed based on the traffic requirements. signal from ToR1 ofOFDM signal from ToR2 Received signal Each OFDM signal consists 1200 subcarriers, each OFDM occupying Fig. 5. Measured RF spectra the OFDM signals at the transmitters and the receivers. wavea bandwidth of 5 ofMHz. Two scenarios using different length and subcarrier assignments are tested (Table I). Due to The optical spectra of the WDM signals at the CAWG input ports from ToR 1 theToR cyclic wavelength routing in the λ3 and 2 transmitters and CAWG outputarrangement ports to ToR 3 and ToR 6CAWG, receivers are and λ6 from ToR1 are routed to ToR3 and ToR6 respectively, while λ4 and λ7 from ToR2 are routed to ToR3 and ToR 6 respectively. Different modulation formats, including QPSK, 16QAM and 64QAM, are used for different OFDM subcarrier groups highlighted in black, producing per-subcarrier data rates of 10 Mb/s, 20 Mb/s and 30 Mb/s respectively. A single-ended, 10 GHz bandwidth direct-detection PD is used at each CAWG output to receive the WDM signal and convert it to an electrical OFDM signal. This OFDM signal is then captured and digitized by a real time oscilloscope and processed using an offline computer to recover the data from the OFDM signal. No optical amplification was used in this experiment. The RF spectra of the OFDM signals are measured at each OFDM transmitter output each the receiver output for different tests (Fig. 5). They show that different OFDM signals from the same transmitter can overlap (such as subcarrier group A and subcarrier group B in Test 1) or non-contiguous subcarriers (such as subcarrier group E), and through the PSD technology each receiver can successfully detect and receive OFDM signals from multiple sources, provided that these OFDM subcarriers do not overlap. No guard band is required when assigning the OFDM subcarriers, as shown at the receiver of ToR 3 in Test 1. Besides allocating subcarriers, Power (dBm)
solve the congestion issue at the destination racks. Note also that within the same OFDM signal different subcarriers can use different modulation formats. No guard band: In PSD-based OFDM system, guard bands are usually required between subcarrier groups from different sources due to the synchronization difficulty and impairments during transmission, such as dispersion and OSNR degradation. However, such guard bands are not required in the intraDCN case because the transmission distance is short (typically from tens of meters up to 2 km). This allows maximum bandwidth utilization at each receiver. Fast switching: This architecture performs optical circuit routing by turning respective lasers on and off. This can be achieved at sub-ns level, making this system feasible for packet level operation. If tunable lasers are used, the switching speed will then be determined by both the laser on/off speed and tuning speed, which can also be realized at ns level [21]. All switched signals take exactly one hop (i.e. passing through the core optical router only once), providing the opportunity for low and uniform latency as opposed to the multiple buffering levels required in several electrical switch-based DCN architectures. Moreover, due to the use of MIMO operation and bandwidth sharing via OFDM subcarrier allocation, no optical buffers are required (like for instance in [9]). Scalability: The key factor that determines the available scale of this DCN is the port count of the CAWG. A 400channel AWG based on 6-inch silica waver with 25GHz spacing has been reported in [22] and a 512-channel AWG based on 4-in silica wafer have been demonstrated more than a decade ago [23]. With the recent advancement in silicon photonics technology, even higher port count CAWG can be expected because silicon waveguide can achieve higher core/cladding index contrast and thus allow waveguide bending radius to be several order of magnitude lower than silica waveguide [24]. Therefore, although it is not trivial to increase the number of channels with decreasing the channel spacing, the number of supported channels of current CAWGs (400 or 512) is still much larger than current Ethernet switches with 64 or 128 ports. Furthermore, as opposed to the system proposed in [9], there is no need for multiple receivers at each port. Simplified control: Although the subcarrier contention restriction at each receiver of course exists, the proposed architecture allows the same OFDM subcarriers to be used by different OFDM signals generated by the same transmitter. Therefore the subcarrier allocation problem can be considered independently for each receiver, thus greatly reducing the associated algorithmic complexity. Low power consumption: Because the core optical router in this architecture is completely passive and static, the optical components have lower power consumption compared with other optical DCN architectures that require switching through WSS or FXC. The heat dissipation is also lower. Low cost: Since this architecture does not require FXC, WSS or tunable wavelength converter, the optical component cost is low. Having low power consumption and low heat dissipation also reduces the cooling requirement and the operation cost.
4
‐40 ‐50 ‐60 ‐70 ‐80
0
2 4 Frequency (GHz)
6
cessfully detect and receive OFDM signals from multiple sources, provided that these OFDM subcarriers do not overlap. No guard band is required when assigning the OFDM subcarriers, as shown at the receiver of ToR 3 in Test 1. Besides allocating subcarriers, the centralized controller also balances the subcarrier powers JOURNAL OF SELECTED TOPICS IN QUANTUM ELECTRONICS among signals from different inputs. ‐20
‐20
A
‐20
D
5
A+D
each, hence the total ToR-ToR capacity is 10 Gbps. The sizes of the produced packets followed a tri-modal distribution, with sizes of 64, 192 and 1408 Bytes appearing with probabilities B+E E E B of 0.05, 0.5 and 0.45 respectively. The latter was shown in [26] Test2: To ToR3 to constitute a good approximation, based on real data center network traffic measurements. Note that all arriving packets F C C+F were segmented in 64-Byte cells, while traffic produced by Test1&2: 10 To ToR6 each ToR was destined with equal probability to all other OFDM signal from ToR1 OFDM signal from ToR2 Received OFDM signal ToRs. Two different traffic models were considered: In the Fig. 6. 5. Measured spectra of the the OFDMnon-blocking signals at the transmitters and the receivers. shown on Fig. TheyRFconfirm cyclic routing operation the (most commonly used in switching literature), each firstofone Fig. 5. Measured RF spectra of the OFDM signals at the transmitters and CAWG. the receivers. ToR produces packets according to a Bernoulli distribution at a The optical spectra of the WDM signals at the CAWG input ports from ToR 1 and ToR 2 transmitters and CAWG output ports to ToR 3 and ToR 6 receivers are constant rate (the latter defined by the average offered load and packet size) - hence the interarrivals of packets towards a given C F ToR follow a geometric distribution. A buffer of 128 kB was ‐5 From ToR1 dedicated to each source-destination ToR pair. In the second From ToR2 traffic model, self-similar traffic was created at each ToR using ‐25 a multiplicity of ON-OFF sources, with Pareto-distributed ON ‐45 and OFF periods in order to simulate the bursty nature of real A D 1540 1545 1550 1555 data center network traffic (also reported in [26]). The Hurst B E Wavelength (nm) parameter was 0.8 while and the average OFF/ON ratio was C F ‐5 To ToR3 10. In this case, the buffer size per ToR pair was chosen to be To ToR6 10 MB due to the increased traffic burstiness. ‐40 ‐50 ‐60 ‐70
‐50 ‐60
2 4 Frequency (GHz)
6
‐40 ‐50 ‐60 ‐70
‐80
0
‐80
0
2 4 Frequency (GHz)
6
‐20
‐20
‐30
‐30
‐30
‐40 ‐50 ‐60
‐40 ‐50 ‐60
‐70
‐70
‐80
‐80
0
2 4 Frequency (GHz)
Power (dBm)
‐20
Power (dBm)
6
‐30
Power (dBm)
‐20
‐30
‐70
‐40 ‐50 ‐60 ‐70
‐80
6
6
0
2 4 Frequency (GHz)
6
‐40 ‐50 ‐60
‐80
0
2 4 Frequency (GHz)
6
Power (dBm)
Power (dBm)
2 4 Frequency (GHz)
2 4 Frequency (GHz)
‐70
‐80
0
0
‐60
6
‐30
‐60
6
‐80
2 4 Frequency (GHz)
‐20
‐50
2 4 Frequency (GHz)
‐50
‐20
‐40
0
‐40
‐70
0
Power (dBm)
Power (dBm)
‐40
‐70
‐80
Power (dBm)
‐30
Power (dBm)
‐30
Power (dBm)
Power (dBm)
‐30
Test1: To ToR3
‐25
‐45 1540
A
B. Subcarrier Allocation Schemes
D
1545 1550 E B Wavelength (nm)
1555
-log(BER)
-log(BER)
-log(BER)
In this section we propose and evaluate two different subcarrier allocation schemes for exploiting the considered Fig. 6. Measured optical spectra at the inputs (top) and outputs (bottom) of the CAWG.architecture: Fig. 6. Measured optical spectra at the inputs (top) and outputs (bottom) of the CAWG. 1) Fixed Subcarrier Allocation (FSA): In FSA, virtual The PSD receiver performance (solid symbols), represented by the bit error transmission pipes of fixed bandwidth are created for rates (BER) under different received optical power levels, are measured and comeach ToR pair by statically assigning to each of them a centralized also balances the subcarrier powers pared with the single channel controller receiver (hollow symbols) for different OFDM signals number of subcarriers. Since in this work we considered signals from inputs. at each testamong (Fig. 7). While thedifferent absolute BER value varies with the modulation uniform average traffic, each ToR pair was assigned 125 The optical spectra the WDM signals at degradation the CAWG input format and per-subcarrier poweroflevel, no significant between single subcarriers (i.e. 1000/8). The main advantage of FSA is ports from ToR 1 and ToR 2 transmitters and CAWG output channel detection and PSD detection is observed in any tests, and OFDM signals its implementation simplicity. However, to the negative ports to ToR 3 and ToR 6 receivers are shown on Fig. 6. with different modulation formats can all be detected successfully. This shows that side, it cannot adapt to bursty traffic and in such cases it They confirm the non-blocking cyclic routing operation of the PSD technology is feasible for receiving multiple OFDM WDM signals simultais expected to lead to increased packet delay. Note that CAWG. a similar scheme could be realized in the time domain neously usingThe a single and thus realizing(solid MIMO switching. PSD PD, receiver performance symbols), represented by serving the input ToRs in a round-robin fashion and by the bit error rates (BER) under different received optical dedicating to each of them one timeslot (cell) per output power 1levels, are measured and com-pared1 with single channel 1 ToR in each round. The packet delay in that case would Test 1: ToR3 Test 1&2: receiver (hollow symbols)Test for2: ToR3 different OFDM signals at ToR6 obviously be be roughly the same as in FSA; However, each test (Fig. 7). While the absolute BERFvalue varies with C FSA can scale much better to higher bitrates per output E B the modulation format 2 and per-subcarrier power level, no 2 2 port, since the electronics controlling the communication A degradation D significant between single channel detection and per ToR pair can operate at 1/N of the output port rate. PSD detection is observed 3 3 in any tests, and3 OFDM signals with 2) Dynamic Subcarrier Allocation (DSA): We propose this different modulation formats can all be detected successfully. 4 4 4 scheme as a feasible approach to achieve assignment This shows that PSD technology is feasible for receiving 5 5 5 of subcarriers for each ToR pair according to their multiple using a single 6 OFDM WDM 6signals simultaneously 6 actual traffic needs. In that respect, DSA is executed 7 thus realizing MIMO 7 PD, and switching.7 8 8 8 periodically (the scheduling period is denoted as T ) -25 -20 -15 -10 -25 -20 -15 -10 -25 -20 -15 -10 and adjusts the current assignment based on traffic Received optical Received optical Received optical E VALUATION powerIV. (dBm)P ERFORMANCE power (dBm) power (dBm) information collected from all ToRs. More specifically, A. Simulation Model and(1Traffic Assumptions Signal from ToR1 Ch) Signal from ToR2 (1 Ch) a ratio (denoted as f ) of the available subcarriers is Signal from ToR1 (PSD) Signal from ToR2 (PSD) In order to evaluate the performance of the proposed archidistributed equally to all ToR pairs in a fixed manner. Fig. 7. Measured received signal performance. tecture, a custom simulation model was built using OPNET The rest are assigned each time in a weighted fashion, Modeler. The model simulated an OFDMA-based switch opwith the weights decided according to the traffic rate erating as described above, consisting of 8 ToRs. Each ToR in each of them during the previous scheduling period. receiver used 1000 subcarriers, offering a bitrate of 10 Mbps Note that T should be selected carefully, since on the one
JOURNAL OF SELECTED TOPICS IN QUANTUM ELECTRONICS
11
6
11
11 Test 1: ToR3
E
-25
-20
-15
-10
-log(BER)
-log(BER)
-log(BER)
44 55 66 77 88
22
33 44 55 66 77 88
-25
-20
-15
-10
33 44 55 66 77 88
-25
-20
-15
-10
-25 -15(dBm)-10 Received-20 optical power
-25 -15(dBm)-10 Received-20 optical power
-25 -15(dBm)-10 Received-20 optical power
Received optical power (dBm)
Received optical power (dBm)
Received optical power (dBm)
Measured received signal performance.
hand it should be relatively short to avoid affecting QoS (i.e. inaccurate decisions should be corrected quickly) and on the other hand, a very short T would impose challenges in the relevant electronics and could produce inaccurate measurements (depending on the exact traffic characteristics). As a final note, it should be mentioned that FSA could also be considered as a subset of DSA, with f equal to 1 and T = ∞ (since it is executed only once in the beginning). Moreover, we also obtained results from two electrical switching schemes and compared them with FSA and DSA. The first one, which uses virtual output queues at the transmitter side (like FSA and DSA do) is called Dynamic Timeslot Allocation (DTA). DTA operates similarly to DSA, however it dynamically assigns a number of timeslots (equal to the cell duration at 10Gbps) to each input port during each scheduling period T . Each ToR input port can transmit to an output port at 10Gbps, but only during the timeslots assigned to it. The second scheme follows an Output Queueing (OQ) paradigm. In OQ, arriving packets from any ToR towards a specific destination ToR are transmitted in FIFO order using the full 10Gbps output port rate. In that way, no bandwidth resources are wasted and thus OQ is expected to offer the minimum possible average packet delay. This makes it very useful for performing the benchmarking of the aforementioned algorithms. Note though that (as it is well-known) OQ is not realistic, since it implies an internal speed-up of N (obviously making it not scalable even for moderate-sized switches). C. Simulation Results Performance of the proposed algorithms was evaluated for different network loading conditions, using the models described above. Note that the load values shown here, indicate the average aggregate load as a ratio of the total available switch capacity. Fig. 8 shows the average packet delay for all the considered subcarrier allocation schemes under the self-similar traffic model. First of all it is clear that, as expected, OQ and FSA offer the best and worst performance respectively. In particular, FSA proves to be completely inadequate since it exceeds OQ by far, even at moderate loads (i.e. around three orders of magnitude for 0.5 load). Moreover, FSA resulted in heavy
Offered Load 0.1
0.2
0.3
0.4
0.5
0.6
0.7
1.E-1
Avg. End-to-End End Packet Delay (s)
Fig. 7.
33
C
B
22
-log(BER)
-log(BER)
D
F
-log(BER)
A
22
Test 1&2: ToR6
Test 2: ToR3
OQ 1.E-2
FSA DSA (T = 1ms, f = 0)
1.E-3
DSA (T = 1ms, f = 0.25)
1.E-4
1.E-5
1.E-6
Fig. 8. Average packet delay comparison between the proposed subcarrier allocation schemes under self-similar traffic.
packet loss at higher load (around 0.3% and 2% for 0.5 and 0.7 loads respectively - while loss in DSA was 0 in all scenarios), rendering it practically unusable by most applications. At the same time, the use of DSA (a T value of 1ms was used) offers delay values that are much closer to OQ over a wider range of loading conditions. The use of a hybrid DSA/FSA approach by means of a non-zero f value (0.25 here) seems to improve performance, though only at low to moderate load. For higher loads, the static assignment of part of the subcarriers results in increased average delay. Note, however, that the exact traffic profile (besides the average offered load) is also expected to heavily influence DSA performance. For example, Fig. 9 depicts the actual packet delay (averaged over 1ms measurement intervals) for DSA at a load of 0.5, with different f values and T = 1ms. From Fig. 9(a) it is obvious that f = 0 results in much lower delay during extreme traffic peaks (i.e. at around 0.2s and 0.5s), due to its ability to reassign all the available subcarriers to the ToR pairs that temporarily require them. However, a closer examination during the rest of the time (as shown in Fig. 9(b) for the period between 0.6s and 0.7s) indicates that an increased f actually results in lower delay, since there is always a transmission pipe available for serving a packet upon its arrival. As a result, it can be generally deduced that the burstier the expected traffic patterns, the lower the recommended f value. Next, in Fig. 10 and Fig. 11 we depict average packet delay
JOURNAL OF SELECTED TOPICS IN QUANTUM ELECTRONICS
7
(a)
(b) 200
1200
f=0
f=0
1000
f = 0.25
f = 0.25
800
Packet Delay (µs)
Packet Delay (µs)
150 f = 0.375
600 400
f = 0.375
100
50
200 0 0.05
0
0.15
0.25
0.35
0.45
0.55
0.6
0.65
0.625
0.65
0.675
0.7
Simulation Time (s)
Simulation Time (s)
Fig. 9. (a) DSA (T = 1ms) packet delay evolution at 0.5 load (self-similar traffic), over 1s of simulation time and for different f values and (b) blown up version of the same graphs for the period between 0.6s and 0.7s.
D. Scheduler Implementation In this section we describe the implementation of the subcarrier assignment algorithm for the proposed architecture. As it was described above, the most efficient scheme is DSA, in which the number of subcarriers is assigned dynamically based on the traffic rate of each port. The high-level architecture of the subcarrier assignment process is depicted in Fig. 14. Congestion management using dynamic subcarrier allocation is performed using specialized control packets, as it is described in [27]. Each ToR switch first evaluates the required number of subcarriers for a specific port based on the traffic rate of the packets targeting this port. Then the ToR switches send the re-
Offered Load 0.1
0.2
0.3
0.4
0.5
0.6
0.7
0.8
0.9
1
Avg. End-to-End End Packet Delay (s)
1.E-4
1.E-5
1.E-6 OQ FSA DSA (T = 10µs, f = 0.375) DTA (T = 10µs, f = 0.375) 1.E-7
Fig. 10. Average packet delay comparison between the proposed subcarrier allocation schemes under Bernoulli traffic, with T = 10µs for DSA and DTA. Offered Load 0.1
0.2
0.3
0.4
0.5
0.6
0.7
0.8
0.9
1
1.E-4
Avg. End-to-End End Packet Delay (s)
results under the Bernoulli traffic model (including the DTA scheme this time), with T = 10µs and 100µs respectively. For DSA and DTA a relatively high f value was chosen (0.375), due to the smoother traffic used. It is evident from both figures that (as expected from the discussion above) the difference between FSA and DSA is not as prominent as in the case of self-similar traffic. A very important finding though, is that DSA always performs better than DTA. The reason is that DTA is much more affected by the choice of scheduling period T (DTA delay increases significantly for T = 100µs). The results indicate the DSA can operate well even by performing the scheduling process less frequently. As a result, it can scale well for much higher bitrates without prohibitive increase in the complexity of the electronics. Finally, Fig. 12 and Fig. 13 depict packet throughput (i.e. aggregate bitrate corresponding to correctly received packets) for T = 10µs and T = 100µs respectively. First of all, it is important to point out that, even with the limited buffering assumed, DSA throughput remains at reasonably high levels in all cases. The throughput performance of OQ almost approaches the offered load, while DTA again performs much worse than DSA - especially for T = 100µs. It should also be noted that, although at high load FSA performs similarly to DSA in terms of average delay, its throughput is evidently lower. This can be attributed to the fact that DSA handles traffic spikes better, thus reducing the possibility of buffer overflows.
1.E-5
1.E-6 OQ FSA DSA (T = 100µs, f = 0.375) DTA (T = 100µs, f = 0.375) 1.E-7
Fig. 11. Average packet delay comparison between the proposed subcarrier allocation schemes under Bernoulli traffic, with T = 100µs for DSA and DTA.
quested subcarriers through the CAWG to the destination port through control packets (shown in Fig. 14 as 1 ). The receiver extracts the requested subcarriers and feeds the scheduler 2 which calculates the subcarriers allocated for each input port. Of course, the total number of allocated subcarriers for all the transmitters should always be lower than the maximum number of supported subcarriers (e.g. 1024). The scheduler
JOURNAL OF SELECTED TOPICS IN QUANTUM ELECTRONICS
8 ①
80 ②
FSA
③
② Allocated_SC
Scheduler 1
DSA (T = 10µs, f = 0.375)
60
DTA (T = 10µs, f = 0.375)
TX1
⑤
50
Req_SC1
④
④
40
RX1 Req_SC2
① Req_SC1
TX2
RX2
③ Alloc SC1
…
ToR 1
…
Avg. Throughput (Gbps)
70
OQ
① Req_SC2
TXN
RXN
Req_SCN Receiver 1
30
TX1
20 10
TXN
0 10
20
30
40
50
60
70
80
④
…
0
③ Alloc_SC2
TX2
…
ToR 2
Offered Load (Gbps)
AWGR
Fig. 12. Average throughput comparison between the proposed subcarrier allocation schemes under Bernoulli traffic, with T = 10µs for DSA and DTA.
Fig. 14.
Scheduling process for the allocation of subcarriers.
80 OQ
Avg. Throughput (Gbps)
70
FSA DSA (T = 100µs, f = 0.375)
60
DTA (T = 100µs, f = 0.375) 50 40 30 20 10 0 0
10
20
30
40
50
60
70
80
Offered Load (Gbps)
Fig. 13. Average throughput comparison between the proposed subcarrier allocation schemes under Bernoulli traffic, with T = 100µs for DSA and DTA.
uses the transmitters of the ToR switch to send the allocated subcarriers to the corresponding ToR switch 3 , again using control packets. Finally, each ToR sends the data based on the number of allocated subcarriers though the transmitters 4 . The scheduler could also configured to work in the same way using the utilization of the buffers instead of the traffic rate. In this case, more subcarriers would be requested and assigned to ports that have almost full buffers. As the MIMO OFDM receivers can accept simultaneously the subcarriers from all wavelengths, the implementation of the scheduler is straightforward. The scheduler must divide the requested subcarriers of each port by the total requested subcarriers for this port and then to assign accordingly these subcarriers. Assuming a 32x32 switch with 1024 subcarriers, the scheduler must perform 32ports × 32div/port = 1024divisions. For a typical embedded processor with a hardware division unit, the average number of clock cycles is 34 [28]. If the processor is running on 500MHz, then the execution time for the divisions (which is the most computational intensive calculation) is: 32ports×32div/port×34cc×2ns ≈ 70µs. The scheduler has been also implemented in hardware and has been ported to an FPGA. In this case, 32 dividers are
used in parallel to accelerate the scheduling time as it is depicted in Fig. 15. The result of each divider is added to the fixed number of subcarriers f in order to calculate the total number of assigned subcarriers. The maximum clock frequency after place-and-route, using a Xilinx Virtex 5 FPGA, is 500Mhz. Thus, the execution time of the hardware scheduler is : 32div/port × 34cc × 2ns ≈ 2µs. In the case of a commercial product the arbiter could be implemented in an ASIC reducing the latency by 3x to hundreds of nanoseconds [29]. The main advantage of a hardware implementation of the scheduler is that it can scale efficiently to a high number of ports and subcarriers. Table II shows the scheduling time T for the software-based and the hardware based scheduler for different number of ports. As it is shown in the table, the software-based scheduler can support up to 128 ports (since the execution time is O(N 2 )), where N is the number of ports) while the hardware-based scheduler can efficiently support a much higher number of ports since it scales linearly with the number of ports (O(N )). For determining the minimum scheduling period T , we also have to take into account the communication latency between the requested subcarriers and the allocated subcarriers. As it was described above, the requested subcarriers are sent to the destination port and the destination port sends back the allocated subcarriers. Thus the total scheduling period is T ≥ rtt + tsch , where rtt is the round-trip time and tsch the processing delay of the scheduler. However, the control packets that carry information about the subcarriers (requested and allocated) can have higher priority than data packets, thus eliminating the need for buffering into the memory of the transmitters. Therefore, rtt is practically fixed and depends only on the delay of the transmitter, the receiver and the CAWG. Hence, the minimum scheduling period is basically determined by the processing time of the scheduler, which (as mentioned earlier) scales linearly with the number of ports. E. Power consumption The main advantage in the proposed scheme is that there is no need for an aggregate switch since the switching is
JOURNAL OF SELECTED TOPICS IN QUANTUM ELECTRONICS
f
+
Allocated SC1
Devices
Req_SC2
DIV
TABLE III P OWER CONSUMPTION EVALUATION
Fixed subcarriers
Req_SC1
DIV
9
+
Allocated SC2
ToR Switches Aggregate Switches
Number
Power
Total Power
40 4
124W 480W
4960W 1920W
40
136.8W
Reference Design …
… Req_SCN
DIV
… Accumul.
Fig. 15.
6880W
OFDM ToR Switches +
Allocated SCN
MIMO OFDM Design
5472W 5472W
the configuration of the OFDM transceivers thus reducing significantly the overall power consumption.
Total Req SC
Hardware implementation of the DSA scheduler.
V. C ONCLUSIONS TABLE II E XECUTION TIME OF THE SCHEDULER FOR DIFFERENT NUMBER OF PORTS Scheduler Software Sch. Hardware Sch.
32 70µs 2µs
64 280µs 4µs
128 1100µs 8µs
performed directly at the optical domain through the use of the CAWG. The CAWG is a passive optical component and therefore it does not consume any power. The switching is performed by tuning accordingly the DML-based transmitters. Therefore we can eliminate the power consumption of the crossbar switches, the electrical-to-optical and optical-toelectrical transceivers (e.g. SFP+) at the aggregate switches. The only overhead of the proposed scheme is that the optical transceivers at the ToR switches have to be replaced by new transceivers that also perform the FFT/IFFT processing. A simple 10Gbps optical multi-mode transceiver (e.g. SFP+) dissipates around 1.5W [30]. The power consumption of the IFFT/FFT processing and the subcarrier modulation that is used in OFDM is estimated to 50mW/Gbps [31]. The OFDM system requires also a high speed ADC and DAC modules that dissipates around 1W and 1.2W respectively [31]. Finally, the optical transponder consumes 2.4W at 40Gbps [32]. Therefore, the total power consumption of each OFDM transceiver used in the ToR switch is around 6.6W for a 40Gbps transceiver. Table III shows the power consumption of a reference design and the MIMO OFDM scheme for a typical data center with 40 racks. The MIMO OFDM scheme uses 8 40Gbps OFDM transceivers per rack that can provide low latency and eliminate the congestion [33]. The reference design is based on commodity switches using a fat-tree topology. To evaluate the power consumption of the reference design we used the Cisco 3048 Ethernet Switch as the ToR and the Cisco 5020 as the aggregate switch. The Cisco 3048 has 48 Ethernet links at 1Gbps and 4 SFP+ ports at 10Gbps that are used to connect with the aggregate switch. The typical power consumption of this ToR switch is 124W [34]. The Cisco 5020 aggregate switch has 48 Ethernet ports at 10Gbps and the typical power consumption is 480W [35]. As it is shown the power consumption of the MIMO OFDM-based network can achieve up to 25% less power consumption that is due to the elimination of the aggregate switches. The switching at the aggregate level is performed in the optical domain through
We propose a novel DCN architecture utilizing OFDM and PSD technologies. This architecture offers fine grain bandwidth allocation, high switching speed, and low and uniform latency. We experimentally demonstrate the MIMO OFDM switching and fine granularity flexible bandwidth sharing features. We also develop efficient subcarrier allocation algorithms for the fine grain bandwidth allocation. The simulation results shows that the MIMO OFDM-based architecture provides low latency and high-throughput switching. Furthermore, the implementation of the scheduler shows that it can support a high number of nodes and subcarriers. Therefore the proposed architecture could be a promising solution for all-optical interrack and inter-server communication in next generation data center networks. R EFERENCES [1] Single Chip Cloud Computing (SCC) Platform Overview. Intel White paper, 2011. [2] C. Kachris and I. Tomkos, “A Survey on Optical Interconnects for Data Centers,” IEEE Communications Surveys and Tutorials, doi:10.1109/SURV.2011.122111.00069, 2011. [3] Where does power go? GreenDataProject, available online at: http://www.greendataproject.org, 2008. [4] A. Benner, “Optical interconnect opportunities in supercomputers and high end computing,” in Optical Fiber Communication Conference. Optical Society of America, 2012, p. OTu2B.4. [5] G. Wang, D. G. Andersen, M. Kaminsky, K. Papagiannaki, T. E. Ng, M. Kozuch, and M. Ryan, “c-Through: Part-time Optics in Data Centers,” in Proceedings of the ACM SIGCOMM 2010 conference on SIGCOMM, ser. SIGCOMM ’10. New York, NY, USA: ACM, 2010, pp. 327–338. [6] N. Farrington, G. Porter, S. Radhakrishnan, H. H. Bazzaz, V. Subramanya, Y. Fainman, G. Papen, and A. Vahdat, “Helios: a hybrid electrical/optical switch architecture for modular data centers,” in Proceedings of the ACM SIGCOMM 2010. New York, NY, USA: ACM, 2010, pp. 339–350. [7] A. Singla, A. Singh, K. Ramachandran, L. Xu, and Y. Zhang, “Proteus: a topology malleable data center network,” in Proceedings of the Ninth ACM SIGCOMM Workshop on Hot Topics in Networks, ser. Hotnets ’10. New York, NY, USA: ACM, 2010, pp. 8:1–8:6. [8] L. Xu, W. Zhang, H. L. R. Lira, M. Lipson, and K. Bergman, “A hybrid optical packet and wavelength selective switching platform for highperformance data center networks,” Optics Express, vol. 19, no. 24, pp. 24 258–24 267, 2011. [9] X. Ye, Y. Yin, S. J. B. Yoo, P. Mejia, R. Proietti, and V. Akella, “DOS: A scalable optical switch for datacenters,” in Proceedings of the 6th ACM/IEEE Symposium on Architectures for Networking and Communications Systems, ser. ANCS ’10. New York, NY, USA: ACM, 2010, pp. 24:1–24:12. [10] K. Xia, Y.-H. Kaob, M. Yangb, and H. J. Chao, “Petabit Optical Switch for Data Center Networks,” in Technical report, Polytechnic Institute of NYU, online: http://eeweb.poly.edu/chao/publications, 2010.
JOURNAL OF SELECTED TOPICS IN QUANTUM ELECTRONICS
[11] S. B. Weinstein, “The history of orthogonal frequency-division multiplexing,” Comm. Mag., vol. 47, no. 11, pp. 26–35, Nov. 2009. [12] J. Armstrong, “OFDM: from copper and wireless to optical.” Optical Society of America, 2008, p. OMM1. [13] A. J. Lowery, L. Du, and J. Armstrong, “Orthogonal frequency division multiplexing for adaptive dispersion compensation in long haul wdm systems,” in Optical Fiber Communication Conference and Exposition and The National Fiber Optic Engineers Conference. Optical Society of America, 2006, p. PDP39. [14] I. B. Djordjevic and B. Vasic, “Orthogonal frequency division multiplexing for high-speed optical transmission,” Opt. Express, vol. 14, no. 9, pp. 3767–3775, May 2006. [15] J. Armstrong, “Ofdm for optical communications,” J. Lightwave Technol., vol. 27, no. 3, pp. 189–204, Feb 2009. [16] N. Cvijetic, “Ofdm for next-generation optical access networks,” Lightwave Technology, Journal of, vol. 30, no. 4, pp. 384 –398, feb.15, 2012. [17] Y. Benlachtar, R. Bouziane, R. I. Killey, C. R. Berger, P. Milder, R. Koutsoyannis, J. C. Hoe, M. Pschel, and M. Glick, “Optical OFDM for the data center,” in International Conference on Transparent Optical Networks, 2010. [18] D. Hillerkuss, R. Schmogrow, T. Schellinger, M. Jordan, and M. Winter, “26 Tbit s-1 line-rate super-channel transmission utilizing all-optical fast Fourier transform processing,” Nature Photonics, vol. 5, no. 6, pp. 364– 371, May 2011. [19] Y. Luo, J. Yu, J. Hu, L. Xu, P. N. Ji, T. Wang, and M. Cvijetic, “WDM Passive Optical Network with Parallel Signal Detection for Video and Data Delivery,” in Optical Fiber Communication Conference and Exposition and The National Fiber Optic Engineers Conference. Optical Society of America, 2007, p. OWS6. [20] P. N. Ji, A. N. Patel, D. Qian, J. P. Jue, J. Hu, Y. Aono, and T. Wang, “Optical Layer Traffic Grooming in Flexible Optical WDM (FWDM) Networks,” in 37th European Conference and Exposition on Optical Communications. Optical Society of America, 2011, p. We.10.P1.102. [21] J. O. Engelsteadter, B. Roycroft, F. H. Peters, and B. Corbett, “Fast wavelength switching in interleaved rear reflector laser,” in Proceedings of IPRM 2010, 2010, pp. ThA1–4. [22] Y. Hida, Y. Hibino, T. Kitoh, Y. Inoue, M. Itoh, T. Shibata, A. Sugita, and A. Himeno, “400-channel 25-GHz spacing arrayed-waveguide grating covering a full range of C- and L-bands,” in Optical Fiber Communication Conference. Optical Society of America, 2001, p. WB2. [23] K. Takada, M. Abe, M. Shibata, M. Ishii, and K. Okamoto, “Low-crosstalk 10-GHz-spaced 512-channel arrayed-waveguide grating multi/demultiplexer fabricated on a 4-in wafer,” IEEE Photonics Technology Letters, vol. 13, no. 11, pp. 1182–1184, 2001. [24] H. Yamada, T. C. T. Chu, S. Ishida, and Y. Arakawa, “Si photonic wire waveguide devices,” IEEE Journal of Selected Topics in Quantum Electronics, vol. 12, no. 6, pp. 1371–1379, 2006. [25] 100GHz Wavelength Division Multiplexer/Demultiplexer. Enablence Technologies Inc., 2010. [26] T. Benson, A. Akella, and D. A. Maltz, “Network traffic characteristics of data centers in the wild,” in Proceedings of the 10th annual conference on Internet measurement (IMC). New York, NY, USA: ACM, 2010, pp. 267–280. [27] N. Chrysos, L. Y. Chen, C. Minkenberg, C. Kachris, and M. Katevenis, “End-to-end congestion management for non-blocking multi-stage switching fabrics,” in Proceedings of the 6th ACM/IEEE Symposium on Architectures for Networking and Communications Systems, ser. ANCS ’10. New York, NY, USA: ACM, 2010, pp. 6:1–6:12. [28] MicroBlaze Processor Reference Guide. Xilinx Inc. Datasheet, 2012. [29] I. Kuon and J. Rose, “Measuring the gap between fpgas and asics,” in Proceedings of the 2006 ACM/SIGDA 14th international symposium on Field programmable gate arrays, ser. FPGA ’06. New York, NY, USA: ACM, 2006, pp. 21–30. [30] Cisco 10GBASE SFP+ Modules Data Sheet. Cisco Press, 2010. [31] M. Glick, Y. Benlachtar, and R. Killey, “Performance and power consumption of digital signal processing based transceivers for optical interconnect applications,” in 11th International Conference on Transparent Optical Networks (ICTON’09), 2009. [32] N. Farrington, E. Rubow, and A. Vahdat, “Data Center Switch Architecture in the age of Merchant Silicon,” in Hot Interconnects, 2009. [33] P. Ji, T. Wang, D. Qian, L. Xu, Y. Aono, T. Tajima, C. Kachris, K. Kanonakis, I. Tomkos, T. Xia, and G. Wellbrock, “Demonstration of High-Speed MIMO OFDM Flexible Bandwidth Data Center Network,” in European Conference on Optical Communication, ser. ECOC ’12, 2012, p. Th.2.B.1. [34] Cisco Nexus 3048 Switch Data Sheet. Cisco Press, 2012. [35] Cisco Nexus 5020 Series Switches. Cisco Press, 2012.
10
Dr. Philip N. Ji is a Senior Research Staff Member at NEC Laboratories America, Princeton, NJ, USA, where he has been researching on optical switching, networking, and transport technologies since 2001. Before that he was engaging in special polymer optical fiber and device research at the University of New South Wales, Australia, where he received the B.E., M.E. and Ph.D. degrees in Electrical Engineering and Telecommunications. His research interests include WDM switching node and network architecture, fiber optic devices for communication, high-speed and high-capacity optical transmission, optical interconnects for data center, and special polymer optical fiber.
Dr. Dayou Qian received the B.S. degree in physics from Tsinghua University, China, the M.S. degree in electrical engineering from the University of California, Los Angeles, and the Ph.D. degree in electrical engineering from Florida International University, Miami, in 2000, 2002, and 2006, respectively. He is currently a Research Staff Member at NEC Laboratories America in Princeton, NJ. His research interests include optical/wireless systems integration and novel modulation techniques for optical transmission.
Dr. Konstantinos Kanonakis was awarded his PhD and Dipl.-Ing degrees in 2007 and 2004 respectively, both from the National Technical University of Athens (NTUA), Greece. His main research interests are in the area of architectures and control protocols for broadband access and optical core networks. He has co-authored more than 40 papers that appeared in international peer-reviewed journals and conferences and has participated in several EU-funded projects.
Dr. Christoforos Kachris is a senior researcher at Athens Information Technology (AIT), Greece. He received his Ph.D. in Computer Engineering from Delft University of Technology, The Netherlands in 2007. In 2006 he worked as a research intern at the Networks Group, at Xilinx Research Labs. From February 2009 till August 2010 he was a visiting lecturer at the University of Crete, Greece and researcher at the Institute of Computer Science in the Foundation for Research and Technology (FORTH). His research interests include reconfigurable computing, multi-core embedded systems, network processing and data center interconnects.
Dr. Ioannis Tomkos is head of the ”High Speed Networks and Optical Communication (NOC)” Research Group in AIT. NOC participates in many EU funded research projects in several of which Dr. Tomkos has a consortiumwide leading role. Dr. Tomkos has received the prestigious title of ”Distinguished Lecturer” of IEEE Communications Society. Together with his colleagues and students he has authored about 400 articles/presentations (about 220 IEEE sponsored archival items) and his work has received over 1800 citations. Ioannis Tomkos received the B.Sc. degree in Physics from the University of Patras, Greece, and the M.Sc. degree in Telecommunications Engineering and the Ph.D. degree in Optical Communications from University of Athens, Greece.