Stephanie Föhrenbach und Anton Stasche. Hervorheben möchte ich ...... Hierfür haben wir verschiedene simple Klick-Aufgaben erstellt, die einerseits mit der ...
Design and evaluation of novel input devices and interaction techniques for large, high‐resolution displays Dissertation zur Erlangung des akademischen Grades des Doktor der Naturwissenschaften (Dr.rer.nat.) an der Universität Konstanz, Fach Informatik, Fachbereich Informatik und Informationswissenschaft, Mathematisch‐Naturwissenschaftliche Sektion vorgelegt von Werner A. König Tag der mündlichen Prüfung: 16. September 2010 Referenten: Prof. Dr. Harald Reiterer Prof. Dr. Oliver Deussen Vorsitzender der Prüfungskommission: Prof. Dr. Marc Scholl
2
Design and evaluation of novel input devices and interaction techniques
Danksagung
Danksagung Zahlreiche Personen haben im Laufe der Jahre zu der in dieser Arbeit dokumentierten Forschungsleistung in unterschiedlichster Form beigetragen. Besonders bedanken möchte ich mich bei Prof. Dr. Harald Reiterer für sein großes Vertrauen, die lehrreichen Diskussionen und natürlich auch für die Möglichkeit an seiner außerordentlichen Arbeitsgruppe zu promovieren. Ebenso möchte ich mich bei Prof. Dr. Oliver Deussen für die gute Zusammenarbeit im Rahmen des BW‐FIT Forschungsverbundes „Information at your fingertips ‐ Interaktive Visualisierung für Gigapixel Displays“ bedanken sowie für seine Bereitschaft als Referent meine Promotion zu betreuen. Des Weiteren möchte ich mich bei Prof. Dr. Marc Scholl als Vorsitzenden der Prüfungskommission und auch bei allen anderen Professoren und Mitgliedern des Fachbereiches Informatik und Informationswissenschaft der Universität Konstanz und des DFG Graduiertenkollegs „Explorative Analyse und Visualisierung großer Datenräume“ bedanken. Besonders möchte ich hierbei Vladimir Bondarenko, Joachim Böttger sowie Bernd Lintermann, Leiter des Instituts für Bildmedien am ZKM | Zentrum für Kunst und Medientechnologie Karlsruhe, für die inspirierende und freundschaftliche Zusammenarbeit danken. Ebenso gilt großer Dank den Mitarbeitern der Wissenschaftlichen Werkstätten der Universität Konstanz, insbesondere Ralf Tessari, Bruno Erne und Harald Kautz, sowie Manfred Dolde und weiteren Mitarbeitern der ict Innovative Communication Technologies AG. Vor allem möchte ich aber meinen Weggefährten, Leidensgenossen, Freunden und Koautoren Jens Gerken und Hans‐Christian Jetter für die erlebnisreiche Zeit und die konstruktiven Diskussionen danken. Ebenso danke ich allen Mitgliedern der AG Mensch‐Computer Interaktion und meinem Projektteam – Roman Rädle, Toni Schmidt, Hans‐Joachim Bieg, Markus Nitsche, Stephanie Föhrenbach und Anton Stasche. Hervorheben möchte ich hierbei Roman Rädle und Toni Schmidt, welche mit ihrem außerordentlichen Engagement als studentische Mitarbeiter und mit ihrem persönlichen Einsatz weit darüber hinaus einen wesentlichen Beitrag zum Erfolg unserer gemeinsamen Forschungsprojekte beigetragen haben. Ein herzliches Dankeschön gilt meinen Eltern und meiner ganzen Familie für die vielfältige Unterstützung über all die Jahre hinweg und die Möglichkeit meine Ziele zu verfolgen. Ganz besonders möchte ich mich bei meiner Frau Claudia bedanken – vielen Dank für deine Geduld, deine Unterstützung und deine Liebe. Diese Arbeit ist dir gewidmet.
3
4
Design and evaluation of novel input devices and interaction techniques
Abstract
Abstract Large, high‐resolution displays (LHRD) provide the advantageous capability of being able to visualize a large amount of very detailed information, but also introduce new challenges for human‐computer interaction. Limited human visual acuity and field of view force users to physically move around in front of these displays either to perceive object details or to obtain an overview. Conventional input devices such as mouse and keyboard, however, restrict users' mobility by requiring a stable surface on which to operate and thus impede fluid interaction and collaborative work settings. In order to support the investigation of alternative input devices or the design of new ones, we present a design space classification which enables the methodical exploration and evaluation of input devices in general. Based on this theoretical groundwork we introduce the Laser Pointer Interaction, which is especially designed to satisfy the demands of users interacting with LHRDs with respect to mobility, accuracy, interaction speed, and scalability. In contrast to the indirect input mode of the mouse, our interactive laser pointer supports a more natural pointing behaviour based on absolute pointing. We describe the iteratively developed design variants of the hardware input device as well as the software toolkit which enables distributed camera‐ based tracking of the reflection caused by the infrared laser pointer. In order to assess the general feasibility of the laser pointer interaction for LHRDs, an experiment on the basis of the ISO standard 9241‐9 was conducted comparing the interactive laser pointer with the current standard input device, the mouse. The results revealed that the laser pointer‘s performance in terms of selection speed and precision was close to that of the mouse (around 89 % at a distance of 3 m), although the laser pointer was handled freely in mid‐air without a stabilizing rest. Since natural hand tremor and human motor precision limit further improvement of pointing performance, in particular when interacting from distant positions, we investigate precision enhancing interaction techniques. We introduce Adaptive Pointing, a novel interaction technique which improves pointing performance for absolute input devices by implicitly adapting the Control‐Display gain to the current user’s needs without violating users’ mental model of absolute‐device operation. In order to evaluate the effect of the Adaptive Pointing technique on interaction performance, we conducted a controlled experiment with 24 participants comparing Adaptive Pointing with pure absolute pointing using the interactive laser pointer. The results showed that Adaptive Pointing results in a significant improvement compared with absolute pointing in terms of movement time (19%), error rate (63%), and user satisfaction. As we experienced in our own research, the development of new input devices and interaction techniques is very challenging, since it is less supported by common development environments and requires very in‐depth and broad knowledge of diverse fields such as programming, signal processing, network protocols, hardware prototyping, and electronics. We introduce the Squidy Interaction Library, which eases the design and evaluation of new interaction modalities by unifying relevant frameworks and toolkits in a common library. Squidy provides a central design environment based on high‐level visual data flow programming combined with zoomable user interface concepts. The user interface offers a simple visual language and a collection of ready‐
5
6
Design and evaluation of novel input devices and interaction techniques
to‐use devices, filters, and interaction techniques which facilitate rapid prototyping and fast iterations. The concept of semantic zooming nevertheless enables access to more advanced functionality on demand. Thus, users are able to adjust the complexity of the user interface to their current needs and knowledge. The Squidy Interaction Library has been iteratively improved alongside the research of this thesis and though its use in various scientific, artistic, and commercial projects. It is free software and is published under the GNU Lesser General Public License.
Zusammenfassung
Zusammenfassung Große, hochauflösende Bildschirme (LHRD) ermöglichen sehr umfangreiche und komplexe Informationsräume auch mit hohem Detailgrad darzustellen – allerdings geht dieser wesentliche Vorteil gegenüber konventionellen Bildschirmen auch mit neuen Herausforderungen in Bezug auf die Mensch‐Computer Interaktion einher. Aufgrund der hohen Bildschirmauflösung in Kombination mit einer Darstellungsfläche von mehreren Quadratmetern übertreffen LHRDs die Fähigkeiten des menschlichen Sehvermögens hinsichtlich der notwendigen Sehschärfe und der physiologisch eingeschränkten Größe des Blickfeldes. Um sowohl das gesamte LHRD zu überblicken als auch die Informationen im Detail wahrnehmen zu können, müssen sich Benutzer vor LHRDs physisch im Raum bewegen. Konventionelle Eingabegeräte wie Maus und Tastatur schränken allerdings, aufgrund der Notwendigkeit einer Auflage zur Interaktion, die Mobilität des Benutzers deutlich ein. Dies verhindert nicht nur eine effiziente und ergonomische Bedienweise von Einzelbenutzern, sondern kann sich auch negativ auf die Produktivität und Kreativität im Rahmen interaktiver Gruppenarbeit auswirken. Um uns dieser Problemstellung zu nähern und als Basis für die Entwicklung und die Erforschung alternativer Eingabegeräte im Allgemeinen, stellen wir eine Klassifikation des Entwurfsraumes für Eingabegeräte vor. Diese theoretische Grundlage ermöglicht die generelle methodische Entwicklung und Evaluierung von Eingabegeräten sowie deren systematische Beschreibung und Einordnung. Basierend auf dieser Klassifizierung beschreiben und untersuchen wir unsere Laserpointer Interaktion, welche mit dem Ziel entwickelt wurde auch den speziellen Anforderungen für die Bedienung von LHRDs hinsichtlich Mobilität, Genauigkeit, Interaktionsgeschwindigkeit und Skalierbarkeit zu entsprechen. Im Vergleich zu der indirekten Bedienung mit der traditionellen Maus erlaubt die Laserpointer Interaktion eine natürlichere und direktere Interaktionsform mittels absoluter Zeigegestik. Wir beschreiben verschiedene Entwicklungsstufen und Designvarianten der iterativ entwickelten Eingabegeräte sowie des dazugehörigen Software Toolkits. Dieses ermöglicht die kamerabasierte Positionsbestimmung von Reflexionspunkten auf LHRDs, welche durch einen oder mehrere infrarot emittierende Laserpointer verursacht werden. Um der hohen Auflösung von LHRDs Rechnung zu tragen, erlaubt das Software Toolkit die Integration von mehreren Kameras sowie die verteilte Bildanalyse mit mehreren Prozessoren auf einem oder mehreren vernetzten Computern. Die generelle Eignung der Laserpointer Interaktion für LHRDs wurde in Form eines kontrollierten Experiments auf Basis der ISO 9241‐9 untersucht. Hierbei wurde unser interaktiver Laserpointer mit dem derzeitigen Standardeingabegerät, der Maus, zur Steuerung der Powerwall der Universität Konstanz verglichen. Obwohl der Laserpointer ohne stabilisierende Auflage frei im Raum bedient wurde, zeigen die Evaluationsergebnisse, dass dessen Performanz hinsichtlich Treffgenauigkeit und Geschwindigkeit nah an den Resultaten der Maus lagen (etwa 89% bei einer Interaktionsdistanz von 3 Metern). Auf Basis unserer Untersuchungen identifizierten wir das natürliche Zittern der Hand und die limitierte Präzision der Handmotorik als einschränkende Faktoren für die Zeigeperformanz mit absoluten Eingabegeräten, welche vor allem bei größeren Interaktionsdistanzen und hohen Bildschirmauflösungen einen deutlich negativen Einfluss ausüben. Um auch bei diesen für LHRDs typischen Rahmenbedingungen die Zeigeperformanz weiter zu verbessern, erforschten wir
7
8
Design and evaluation of novel input devices and interaction techniques
unterstützende Interaktionstechniken. Hierbei entwickelten wir Adaptive Pointing, eine neue Interaktionstechnik, welche die Zeigeperformanz für absolute Eingabegeräte erhöht, in dem sie implizit den Control‐Display Gain an das aktuelle Benutzerbedürfnis anpasst, ohne dabei die Erwartungen des Nutzers hinsichtlich eines absoluten Zeigeverhaltens zu verletzen. Um den Effekt dieser Interaktionstechnik zu untersuchen, verglichen wir Adaptive Pointing mit einer nicht modifizierten, absoluten Zeigetechnik im Rahmen eines kontrollierten Experiments unter Verwendung des interaktiven Laserpointers. Die Evaluationsergebnisse zeigen eine signifikante Verbesserung durch Adaptive Pointing hinsichtlich der Bewegungszeit (19%), Fehlerrate (63%) und Benutzerzufriedenheit. Die Entwicklung neuartiger Eingabegeräte und Interaktionstechniken wird Hard‐ und Software‐ technisch nur ungenügend von den herkömmlichen Entwicklungsumgebungen unterstützt. Darüber hinaus ist hierfür detailliertes Wissen aus unterschiedlichsten Bereichen notwendig, wie Programmierung, Signalverarbeitung, Netzwerkprotokolle, Prototypenbau und Elektronik. Aus dieser Problemstellung heraus entwickelten wir die Squidy Interaktionsbibliothek, welche die Realisierung und Evaluierung von neuen Interaktionsformen unterstützt und durch die konsistente Vereinigung von zahlreichen heterogenen Software‐Toolkits und Frameworks wesentlich vereinfacht. Deren Funktionalitäten sind nicht nur durch eine gemeinsame textuelle Programmierschnittstelle (API) zugänglich, sondern Squidy bietet darüber hinaus auch eine eigene visuelle Entwicklungsumgebung basierend auf visueller Datenflussprogrammierung gepaart mit Konzepten für skalierbare Benutzungsschnittstellen. Hiermit können neue Interaktionsformen auf Basis von vorhandenen Einzelkomponenten und einer einfachen visuellen Sprache iterativ entwickelt und unmittelbar getestet werden. Sind erweiterte Einstellungen oder tiefergehende Anpassungen der Komponenten notwendig, sind diese bei Bedarf und selektiv durch semantisches Zoomen auf diese möglich. Dementsprechend können Benutzer die Granularität der dargestellten Informationen und der angebotenen Funktionalitäten an ihren aktuellen Bedarf und Wissensstand anpassen. Die Squidy Interaktionsbibliothek wurde auf Basis der tagtäglichen Erfahrungen im Rahmen der hier vorgestellten Forschungsarbeiten, als auch durch die Verwendung in vielfältigen wissenschaftlichen, künstlerischen und kommerziellen Projekten iterativ weiterentwickelt und verbessert. Die Squidy Interaktionsbibliothek ist Open Source und unter der GNU Lesser General Public License veröffentlicht.
Parts of this thesis were published in:
König, W.A., Rädle, R., & Reiterer, H., 2010. Interactive Design of Multimodal User Interfaces – Reducing technical and mental complexity. Journal on Multimodal User Interfaces, 3(3), 197‐212.
König, W.A., Gerken, J., Dierdorf, S., Reiterer, H., 2009. Adaptive Pointing – Design and Evaluation of a Precision Enhancing Technique for Absolute Pointing Devices. Interact 2009: Proceedings of the twelfth IFIP conference on Human‐Computer Interaction. Berlin, Germany: Springer LNCS, pp. 658‐671.
König, W.A., Rädle, R., Reiterer, H., 2009. Visual Design of Multimodal Interaction ‐ Bridging the Gap between Interaction Designers and Developers. Workshop on the Challenges of Engineering Multimodal Interaction: Methods, Tools, Evaluation. Sankt Augustin / Bonn, Germany.
König, W.A., Rädle, R., Reiterer, H., 2009. Squidy: A Zoomable Design Environment for Natural User Interfaces. CHI '09: Proceedings of the 27th international conference extended abstracts on Human factors in computing systems. New York, NY, USA: ACM, pp. 4561‐4566.
König, W.A., Gerken, J., Dierdorf, S., Reiterer, H., 2009. Adaptive Pointing – Implicit Gain Adaptation for Absolute Pointing Devices. CHI '09: Proceedings of the 27th international conference extended abstracts on Human factors in computing systems. New York, NY, USA: ACM, pp. 4171‐4176.
Jetter, H.C., König, W.A., Reiterer, H., 2009. Understanding and Designing Surface Computing with ZOIL and Squidy. CHI 2009 Workshop ‐ Multitouch and Surface Computing. Boston, USA.
Foehrenbach, S., König, W.A., Gerken, J., Reiterer, H., 2009. Tactile Feedback enhanced Hand Gesture Interaction at Large, High‐Resolution Displays. Journal of Visual Languages & Computing, 20(5), 341‐351.
König, W.A., 2008. Visual and Physical Interaction Design for Information Services. Invited Talk at the international conference on Human‐Computer Interaction and Information Services. Prague, Czech Republic.
9
10
Design and evaluation of novel input devices and interaction techniques
König, W.A., Böttger, J., Völzow, N., Reiterer, H., 2008. Laserpointer‐Interaction between Art and Science. IUI'08: Proceedings of the 13th international conference on Intelligent User Interfaces. New York: ACM Press, pp. 423‐424.
Foehrenbach, S., König, W.A., Gerken, J., Reiterer, H., 2008. Natural Interaction with Hand Gestures and Tactile Feedback for large, high‐res Displays. MITH'08: Workshop on Multimodal Interaction Through Haptic Feedback, held in conjunction with AVI'08. Napoli, Italy.
König, W.A., Bieg, H.‐J., Reiterer, H., 2007. Laserpointer‐Interaktion für große, hochauflösende Displays. Mensch & Computer 2007: Interaktion im Plural, 7. Konferenz für interaktive und kooperative Medien. Weimar: Oldenbourg Verlag, pp. 69‐78.
König, W.A., Bieg, H.‐J., Schmidt, T., Reiterer, H., 2007. Position‐independent interaction for large high‐resolution displays. IHCI'07: Proceedings of IADIS International Conference on Interfaces and Human Computer Interaction. Lisbon, Portugal: IADIS Press, pp. 117‐125.
Contents
Contents 1
INTRODUCTION ...................................................................................................................... 15 1.1
Interacting with large, high‐resolution displays ............................................................. 15
1.2
Research Objectives ....................................................................................................... 17
1.2.1
Laser Pointer Interaction ........................................................................................ 17
1.2.2
Adaptive Pointing ................................................................................................... 17
1.2.3
Squidy Interaction Library ...................................................................................... 18
1.3 2
Large, high‐resolution displays ............................................................................................... 21 2.1
Characteristics of LHRDs ................................................................................................. 21
2.1.1
Display resolution ................................................................................................... 22
2.1.2
Physical display size ................................................................................................ 25
2.2
Evaluation studies........................................................................................................... 26
2.3
Human visual capabilities ............................................................................................... 31
2.3.1
Visual acuity ............................................................................................................ 31
2.3.2
Field of view ............................................................................................................ 33
2.4 3
Thesis Outline ................................................................................................................. 19
Summary ......................................................................................................................... 35
Designing Input Devices for LHRDs......................................................................................... 37 3.1
Design Space & Measures .............................................................................................. 38
3.2
Design Space Classification ............................................................................................. 41
3.3
Laser Pointer Interaction ................................................................................................ 59
3.3.1
Related Work .......................................................................................................... 61
3.3.2
Requirements & Features ....................................................................................... 62
3.3.3
Design & Development ........................................................................................... 63
3.3.3.1 Technical Requirements and Solutions .............................................................. 64 3.3.3.2 Hardware Design ................................................................................................ 68 3.3.3.3 Interactive Laser Pointer @ Design Space Classification .................................... 81 3.3.4
Evaluation ............................................................................................................... 83
3.3.4.1 Participants and Design ...................................................................................... 84 3.3.4.2 Apparatus & Procedure ...................................................................................... 84 3.3.4.3 Results ................................................................................................................ 85 3.3.5 3.4
Globorama: Laser Pointer Interaction between Art and Science ........................... 87
Summary ......................................................................................................................... 90
11
12
Design and evaluation of novel input devices and interaction techniques
4
Precision Enhancing Pointing Techniques ............................................................................. 91 4.1
Problem Domain ............................................................................................................ 92
4.1.1
Natural Hand Tremor ............................................................................................. 92
4.1.2
Human Motor Precision ......................................................................................... 94
4.2
Adaptive Pointing ........................................................................................................... 96
4.2.1
Adaptive Gain ......................................................................................................... 96
4.2.2
Evaluation ............................................................................................................ 101
4.2.2.1 Materials & Participants................................................................................... 101 4.2.2.2 Tasks ................................................................................................................. 102 4.2.2.3 Experimental Design ........................................................................................ 102 4.2.2.4 Hypotheses ....................................................................................................... 103 4.2.2.5 Results .............................................................................................................. 104 4.3 5
Summary ...................................................................................................................... 109
Interactive Design of Multimodal User Interfaces ............................................................... 111 5.1
Related Work ............................................................................................................... 112
5.2
Squidy Interaction Library ............................................................................................ 120
5.2.1
Framework Architecture ...................................................................................... 122
5.2.1.1 Generic Data Types .......................................................................................... 122 5.2.1.2 Squidy Bridges .................................................................................................. 124 5.2.1.3 Squidy Core ...................................................................................................... 126 5.2.2
User Interface Concept ........................................................................................ 129
5.2.2.1 Knowledge Base ............................................................................................... 130 5.2.2.2 Semantic Zooming ............................................................................................ 131 5.2.2.3 Interactive Configuration & Evaluation............................................................ 132 5.2.2.4 Details on demand ........................................................................................... 133 5.2.2.5 Embedded Code and on‐the‐fly compilation ................................................... 134 5.2.2.6 Dataflow Visualization ‐ Visual Debugging ....................................................... 135 5.2.3
Formative Evaluation Study ................................................................................. 137
5.2.3.1 Results .............................................................................................................. 140 5.2.4 5.3 6
Example Use Cases ............................................................................................... 142
Summary ...................................................................................................................... 150
Conclusion ............................................................................................................................ 153
Appendix A ................................................................................................................................... 157 Appendix B ................................................................................................................................... 158 Appendix C ................................................................................................................................... 162
Contents
Appendix D ................................................................................................................................... 164 Appendix E .................................................................................................................................... 169 List of Figures ................................................................................................................................ 184 Bibliography .................................................................................................................................. 191
13
14
Design and evaluation of novel input devices and interaction techniques
INTRODUCTION
1 INTRODUCTION Contents 1.1
Interacting with large, high‐resolution displays ............................................................. 15
1.2
Research Objectives ....................................................................................................... 16
1.2.1
Laser Pointer Interaction ........................................................................................ 17
1.2.2
Adaptive Pointing ................................................................................................... 17
1.2.3
Squidy Interaction Library ...................................................................................... 18
1.3
Thesis Outline ................................................................................................................. 19
1.1 Interacting with large, high‐resolution displays Large, high‐resolution Displays (LHRD) which typically provide several millions of pixels covering entire walls enable new ways of information visualization, analysis and communication. Thanks to the high display resolution, complex information spaces can be visualized in high detail and within a large context. In contrast to using conventional displays which by their nature result in aggregation or reduction of displayed information, users of LHRDs can overview a much greater amount of data and can identify interesting patterns or relations at a glance. Moreover, additional perspectives on the data can be visualized side by side facilitating multi‐dimensional comparison and analytical reasoning. As a result of larger display dimensions in combination with the high resolutions, these advantageous features of LHRDs can be utilized by individual users as well as by multiple users in parallel for co‐located collaboration. A further advantage of LHRDs resulting from their large dimensions is the possibility of visualizing full‐size sketches and early CAD1‐prototypes of cars or other industrial products. Using LHRDs designers and engineers can discuss, modify, and evaluate virtual prototypes in a photorealistic, full scale setting with less need for time‐consuming and expensive physical prototypes [Buxton et al. 2000]. Thanks to the realistic setting they provide, even customer studies can be conducted in the very early design phases. LHRDs differ from conventional displays, however, not only in their technology and in their resulting features, but also in their usage especially in terms of users’ requirements, tasks, and behaviour. LHRDs are far more expensive than standard desktop displays and the utilized hardware and software technology is more complex. At least in the near future, LHRDs will not replace conventional displays but will instead be used in addition to them for specific tasks and situations in which the advantages of LHRDs are especially beneficial. LHRDs are used to a lesser degree for information creation tasks such as writing emails or papers. They are, however, being increasingly used in both industry and science for information presentation, analysis, and modification. 1
CAD: Computer‐Aided Design
15
16
Design and evaluation of novel input devices and interaction techniques
A great challenge and open issue in utilizing LHRDs is the method of interacting with them. In order to accomplish their tasks, users need an input technique suitable for expressing their needs such as controlling the information presentation and manipulating the displayed information. Compared to conventional displays, LHRDs pose differing and new requirements which have to be considered: Due to the higher resolution of LHRDs, input devices are required which enable users to efficiently navigate hundreds of millions of pixels. At the same time, the input device should also offer the precision to effectively select or manipulate small objects, even if placed several meters away from the user’s position at the far end of the display. Since LHRDs match or even exceed the capabilities of the human visual system in terms of spatial resolution and field of view, physical navigation is required to a large extent in order to perceive all of the pixels and to take full advantage of these displays. Therefore, users move in front of these displays and require input devices that accommodate this necessary mobility. Moreover, such input devices should also function in a collaborative setting with multiple users and multiple identical or different devices in parallel. We will address these challenges by introducing a novel input device – an interactive laser pointer – that is especially designed to support users in interacting with LHRDs. We will further introduce an appropriate interaction technique – Adaptive Pointing – that enhances pointing precision of the interactive laser pointer and absolute pointing devices in general in order to enable efficient and effective interaction even from distant positions as well as with high pixel densities. With these two key contributions we provide an answer to the following research question: Which input technologies are suitable for supporting users in interacting with large, high‐resolution displays? Our third key contribution does not relate to a specific input technology, but addresses the challenge of designing them. Designing novel input devices and interaction techniques is a very demanding and complex task: practical knowledge of different layers of the system and its design process is required, ranging from hardware prototyping, operating system drivers, communication protocols and signal processing, to application programming interfaces and the final application. There are tools which provide specialized functionalities such as blob detection or feature recognition. The incorporation of such tools, however, in order to enable human‐ computer interaction (from sensing physical properties to the transition of the system state) often fails due to the monolithic design of the tools or incompatible requirements concerning the hardware setting, operating system, and/or programming language. This complexity increases when designing multimodal interfaces which provide multiple input modalities such as speech, pen, touch or gaze input [Oviatt 2008]. We address these challenges by introducing the Squidy Interaction Library which is designed to provide an answer for the following research question: How can we support the design and evaluation of novel input devices and interaction techniques for large, high‐resolution displays?
INTRODUCTION
1.2 Research Objectives In the following we will give a brief overview of the mentioned key contributions of this thesis which are discussed in detail in the chapters 3, 4, and 5. 1.2.1
Laser Pointer Interaction
Due to the high amount of pixels and the large dimensions of LHRDs, users have to move around in front of these displays to gain either in‐depth knowledge or an overview. However, conventional input devices such as a mouse and keyboard restrict users' mobility by requiring a stable surface on which to operate. In order to systematically design and evaluate a new input device addressing this mobility requirement, we identify the design space of input devices in general and describe them in a new design space classification. Based on this theoretical groundwork, we introduce in chapter 3 a flexible pointing device based on an infrared laser pointer that allows identical use from any point and distance. In particular, our interactive laser pointer interaction satisfies the demands of LHRDs in the areas of mobility, accuracy, interaction speed, and scalability. The solution presented is technically designed as a generic interaction toolkit whose flexibility and general suitability was verified by using it with two very different systems – a planar 221″ Powerwall and a curved 360° panoramic display. Furthermore, a comparative evaluation study with 16 participants was conducted on the Powerwall in order to compare the performances of a conventional mouse and our interactive laser pointer by means of a unidirectional tapping test at varying distances (ISO 9241‐9). The results revealed that the laser pointer‘s performance in terms of selection speed and precision was close to that of the mouse (around 89 % at a distance of 3 m) although the laser pointer was handled freely in mid‐ air without a stabilizing rest. However, the experiment results also suggest that, due to trembling of the user’s hand, the laser pointer’s performance deteriorates significantly with increasing distance. Since the natural hand tremor and human motor precision limit further improvement of pointing performance in particular when interacting from distant positions, we investigate precision enhancing interaction techniques and introduce a further contribution of this thesis – Adaptive Pointing. 1.2.2
Adaptive Pointing
In chapter 4, we present Adaptive Pointing, a novel approach to addressing the common problem of accuracy when using absolute pointing devices for distant interaction. First, we discuss related work concerning the problem‐domain of pointing accuracy when using absolute or relative pointing devices. This motivates our introduction of a novel classification scheme for more clearly discriminating between different approaches. Second, the Adaptive Pointing technique is presented and described in detail. The intention behind this approach is to improve pointing performance for absolute input devices by implicitly adapting the Control‐Display gain to the current user’s needs without violating users’ mental model of absolute‐device operation. Third, we present an experiment comparing Adaptive Pointing with pure absolute pointing using a laser pointer as an example of an absolute device. The results show that Adaptive Pointing results in a significant improvement compared with absolute pointing in terms of movement time (19%), error rate (63%), and user satisfaction.
17
18
Design and evaluation of novel input devices and interaction techniques
1.2.3
Squidy Interaction Library
In contrast to the pioneers of multimodal interaction, e.g., Richard Bolt in the late seventies, today's researchers in this domain can benefit from various existing hardware devices and software toolkits. Although these development tools are available, employing them is still challenging, particularly in terms of their usability and their appropriateness to the actual design and research process. In chapter 5, we present a three‐part approach to supporting interaction designers and researchers in designing, developing, and evaluating novel input devices and interaction modalities. First, we present a software architecture that enables the unification of a great variety of very heterogeneous device drivers and special‐purpose toolkits in a common interaction library named "Squidy". Second, we introduce a visual design environment that minimizes the threshold for its usage (ease‐of‐use) but scales well with increasing complexity (ceiling) by combining the concepts of semantic zooming with visual dataflow programming. Third, we not only support the interactive design and rapid prototyping of multimodal interfaces but also provide advanced development and debugging techniques to improve technical and conceptual solutions. In addition, we offer a test platform for controlled comparative evaluation studies as well as standard logging and analysis techniques for informing the subsequent design iteration. Squidy therefore supports the entire development lifecycle of multimodal interaction design, in both industry and research.
INTRODUCTION
1.3 Thesis Outline Having motivated the research objectives of this thesis in the introduction, the second chapter discusses the unique characteristics of LHRDs and gives an overview of empirical findings concerning the benefits of the increased resolution and display size as compared to conventional desktop displays. Furthermore, the limitations of the human visual system are discussed and the need for physical navigation is motivated. Chapter 3 presents a new classification scheme for the design space of input devices in general which is the theoretical groundwork for our laser pointer interaction introduced thereafter. The hardware and software design of the interactive laser pointer is discussed and the empirical study which was conducted to assess the usability of the laser pointer is described. The chapter concludes by illustrating the Globorama installation, a real‐world use case of the laser pointer. With the aim of further enhancing the pointing performance of the interactive laser pointer (and absolute pointing devices in general), natural hand tremor and human motor precision are identified as limiting factors in chapter 4. Based on these insights and on a review of related techniques, the Adaptive Pointing technique is introduced and its mathematical descriptions are given. In order to examine the benefits of Adaptive Pointing compared to pure absolute pointing, a controlled experiment was conducted which is described at the last part of chapter 4. An overview of existing development environments for designing novel input devices and in particular for designing multimodal interfaces is given at the beginning of chapter 5. Thereafter, the Squidy Interaction Library is introduced. The framework architecture as well as the user interface design of the visual design environment is explained. For the benefit of further design iterations a formative study was conducted which is described subsequently. The chapter concludes by presenting case studies in which the Squidy Interaction Library has already been utilized. Chapter 6 sums up the main results of the research described in this thesis.
19
20
Design and evaluation of novel input devices and interaction techniques
Large, high‐resolution displays
2 Large, high‐resolution displays Contents 2.1
Characteristics of LHRDs ................................................................................................. 21
2.1.1
Display resolution ................................................................................................... 22
2.1.2
Physical display size ................................................................................................ 25
2.2
Evaluation studies........................................................................................................... 26
2.3
Human visual capabilities ............................................................................................... 31
2.3.1
Visual acuity ............................................................................................................ 31
2.3.2
Field of view ............................................................................................................ 33
2.4
Summary ......................................................................................................................... 35
Large, high‐resolution displays (LHRD) differ from conventional desktop monitors in various aspects. Technologically speaking, they provide larger physical dimensions as well as much higher pixel resolutions. From the user’s perspective, however, this leads to an increased need for physical navigation. When designing specific input devices for LHRDs, these particular characteristics of LHRDs as well as their consequences for human‐computer interaction have to be considered. In this chapter, we will discuss these in more detail and provide an overview of the benefits of increased resolution and display size. We will furthermore discuss how the limitations of the human visual system, in terms of visual acuity and field of view, influence users’ physical navigation. This chapter motivates our research in concerning LHRDs presented in the following chapters and introduces the general theoretical and empirical background.
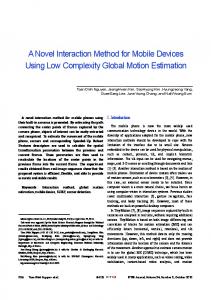
2.1 Characteristics of LHRDs Large, high‐resolution displays vary greatly in the technology they use and in their geometry. However, they have in common, that their resolution and physical size are much larger than conventional desktop displays. For the sake of clarity we have categorized today’s displays into the four main classes illustrated in Figure 1. The class of LHRDs contains displays which are large enough to enable multiple users to work in parallel – in contrast to desktop monitors that are designed for single‐users. In addition, the LHRDs provide an amount of pixels large enough for visualizing very complex information spaces, roughly starting with three to five million pixels. Thanks to recent advances in display technology, LHRDs can be build that even offer hundreds of millions of pixels. Thus, the class of LHRDs covers a wide range of resolutions and heterogeneous display technologies. In the following sections, we will discuss two factors – display resolution and physical size – while focusing on their impact on human‐computer interaction and their implications for the design of suitable input devices.
21
22
Design and evaluation of novel input devices and interaction techniques
Projector (1024 x 768, ca. 100”)
Powerwall, University of Konstanz (4640 x 1920, 221”)
Large, Low‐Resolution Displays
Large, High‐Resolution Displays (LHRD)
Small, Low‐Resolution Displays
Small, High‐Resolution Displays (high‐density)
Desktop Monitor (1600 x 1200, 21”)
IBM T221 (3840 x 2400, 22.2”)
Figure 1: Display classification schema – four categories and corresponding examples distinguished by the dimensions display resolution and physical size.
2.1.1
Display resolution
LHRDs offer resolutions that are multiple times higher than those of current standard high‐ definition displays (1920 x 1080 pixels). With such an increased amount of pixels, very complex and large information spaces can be visualized at a glance. This is a key advantage of LHRDs for many research and application fields such as Information Visualization or Visual Analytics; a vast amount of data can be represented in great detail without sacrificing context or content. Here, human judgement is needed for finding relevant patterns or interesting values [Thomas & Cook 2005]. LHRDs provide the possibility of visualizing large information sets in great detail as well as allowing for additional perspectives on the data, accentuating specific features such as time dependencies or spatial relations (e.g., based on the concept of multiple coordinated views [North & Shneiderman 2000]). Thus, the user is able to obtain an overview of the data and to find and compare interesting items simultaneously. Thanks to the increased resolution as compared to conventional displays, LHRDs facilitate human insight, discovery and analytical reasoning in general. Using conventional displays with lower resolutions, even medium sized information spaces have to be reduced and/or clipped in order to fit on these displays. These reductions in information quantity could potentially hide interesting information by clustering or aggregation. LHRDs are also limited in their amount of pixels, but provide very high resolutions that even surpass human visual capabilities (see section 2.3, p. 31). Users are less restricted by the LHRDs and therefore are able to fully utilise their perceptual abilities.
Large, high‐resolution displays
23
Figure 2: The „Visible Human Female“ data set is rendered in high‐resolution on the GRIS Display Wall in Tübingen with a resolution of 10240 x 6400 pixels and a size of 2.8 x 2 meters. The wall consists of 4x4 30‐inch LCDs and is powered by a cluster of 16 high‐performance computers [Parys & Knittel 2009].
From a technical perspective, there are two major approaches for achieving high display resolutions such as those offered by LHRDs: tiled LCD2 panels and projection‐based seamless displays [Ni, Schmidt, et al. 2006]. A tiled LCD panel (see Figure 2) consists of an array of multiple LCD displays that are arranged as flat or curved display walls. The arrangement of the individual LCDs is very flexible, but introduces borders between each tile breaking up the continuity of the LHRD. The display bezels segment the LHRD which then causes a visual distortion of the displayed image and an interaction distortion when the cursor crosses the bezels [Robertson et al. 2005]. Projection‐based seamless displays avoid these distortions by combining multiple projectors which are arranged in an array in order to generate a single and homogeneous large, high‐resolution image (see Figure 3). These displays can have almost any shape and size, but the configuration of the projection geometry and the calibration of the individual colour and brightness levels are rather complex. In comparison to the LCD solution, these projectors are more expensive and require more space due to the optical projection distance, but they provide the great advantage of a seamless image and the potential for stereoscopic imaging.
2
LCD: Liquid Crystal Display
24
Design and evaluation of novel input devices and interaction techniques
Figure 3: PixelMap Visualization of the US census data is displayed on the Powerwall of the University of Konstanz3. The Powerwall offers a resolution of 4640 x 1920 pixels and a size of 5.2 x 2.15 meters. The rear‐projection display is driven by 8 projectors that render a very homogeneous image thanks to soft‐ edge blending and image synchronization.
The interactive rendering of high‐resolution images with millions of pixels is a very performance‐ and memory‐consuming task that exceeds the capabilities of standard graphics cards. Specialized high‐end multi‐GPU visual computing systems such as the NVIDIA Quadro Plex4 offer the possibility of rendering images with a total resolution of almost 36 megapixels5. However, the actual interactivity of the system – measured in frames per second – depends highly on the rendering engine of the application (e.g. OpenGL, Direct3D, or GDI) and the type of data (e.g. pixel, voxel, or vector graphics). These visual computing systems can be connected to a conventional computer and act – from users’ perspective – like a standard graphics card: there is no need for software modifications or special restrictions when rendering applications on a LHRD with these solutions. However if higher resolutions or faster frame rates are required more scalable solutions are needed. An alternative and more modular approach is based on the combination of multiple high‐performance graphics computers for cluster‐based rendering. Here, the rendering process is distributed over a set of computers that are connected via a high‐ throughput network [Staadt et al. 2003]. In the last years several software toolkits have been developed which manage the distribution of the rendering operations and their synchronization over the network. However, these toolkits are limited to specific rendering engines (e.g. the Chromium toolkit [Humphreys et al. 2002] extends the OpenGL engine) and require code
3
Powerwall of the University of Konstanz: http://www.informatik.uni‐konstanz.de/forschung/powerwall/ NVIDIA Quadro Plex: http://www.nvidia.com/page/quadroplex.html 5 1 megapixel = 1,000,000 pixels 4
Large, high‐resolution displays
modifications of the applications to be distributed (e.g. OpenSG [Voß et al. 2002], VRJuggler [Bierbaum et al. 2001], and Equalizer [Eilemann et al. 2009]). Thus, the usability of LHRDs driven by such distributed rendering solutions is limited, since proprietary software such as Microsoft Powerpoint cannot be modified to function with these toolkits. 2.1.2
Physical display size
The second differentiating characteristic of LHRDs is their physical size, more precisely, the physical dimension of the displayed viewport. The dimensions of LHRDs are typically much larger than conventional desktop displays. The Powerwall at the University of Konstanz, for example, has a display diagonal of approximately 221 inches (see Figure 3), which is about 10 times larger than a current standard desktop display. With physical dimensions of 5.2 x 2.15 meters the Powerwall covers an entire wall and enables – along with its high resolution – multiple users to work together or in parallel independently. Large, low‐resolution projections are widely‐used for presentation environments, but provide too few pixels to accommodate multiple user settings, e.g., individual display space and focus. In contrast, LHRDs are suitable for use as shared displays enabling multiple users to work in parallel while adhering to social protocols of personal space and without the need of formal turn‐taking [Tuddenham & Robinson 2006]. They support group communication as electronic whiteboards or peripheral displays e.g., for brainstorming sessions [Guimbretière et al. 2001]. They facilitate social and situational awareness that are crucial for co‐ located team collaboration [Kulyk et al. 2008], [Greenberg & Rounding 2001]. Furthermore, LHRDs can be used to provide lightweight information about group activity [Huang & Mynatt 2003] and thus support shared activities and knowledge. A further advantage of LHRDs resulting from their large dimensions is the possibility of visualizing full‐size sketches and early CAD6‐prototypes of cars or other industrial products. Using LHRDs designers and engineers can discuss, modify and evaluate virtual prototypes in a photorealistic, full scale setting with less need of time‐consuming and expensive physical prototypes [Buxton et al. 2000]. Thanks to the realistic setting they provide, even customer studies can be conducted in the very early design phases. “Getting the styling of the car correct early in the design process is extremely important. In this, the scale at which the designs are rendered play a surprisingly critical role. For example, the primary curves that define a car’s style may look perfectly fine at quarter scale but elicit a completely different emotional response at full scale.” [Buxton et al. 2000]. Thus, LHRDs can improve and shorten the development lifecycle in engineering and design by visually communicating ideas in better quality and realistic size and by facilitating group discussion and customer involvement. Another advantage stemming from LHRDs’ large dimensions is the potential for physically exploring them. On conventional displays the user navigates an information space in a purely virtual manner by changing the current viewport via mouse or keyboard input, resulting in an accordant replacement of the displayed information on the screen (e.g., panning on a 6
CAD: Computer‐Aided Design
25
26
Design and evaluation of novel input devices and interaction techniques
geographical map). Thanks to the physical dimensions of LHRDs the user has – in addition or as an alternative to virtual navigation – the ability to physically navigate the information space by bodily movement in front of the screen [Ball & North 2005]. This means that instead of changing the displayed information with virtual navigation, on LHRDs the information can remain but the user changes her position and orientation for navigation (eye‐, head‐, or body‐movement). For example, the user steps forward to see details or steps back to obtain an overview (see section 2.3.1, p. 31 for details about human visual acuity). Physical navigation offers a very direct and natural mode of interaction since it builds upon our elementary navigation strategies from the real world and by this no additional cognitive load is introduced (e.g., handling of the input device, manual control of viewport, and reorientation in the changed information view). Although physical navigation is more direct and natural and needs less cognitive load, it is questionable as to whether or not its usage is as efficient as virtual navigation. If a significant change of the viewport is desired and an eye‐ or head‐movement is not sufficient, the user has to move her body to the required location – instead of moving a (small) input device for virtual navigation. In the last years several empirical experiments were conducted that address the question of efficiency and the general benefits of LHRDs resulting from the higher resolution and the larger physical dimensions.
2.2 Evaluation studies Shupp et al. [2006] investigated user performance time, accuracy, and mental workload on geospatial search, route tracing and comparison tasks with different display resolutions and physical sizes. They compared a single monitor configuration (1280 x 1024 pixels) to a tiled LHRD with 12 monitors (4 x 3 display array with 5120 x 3072 pixels) and a tiled LHRD with 24 monitors (8 x 3 display array with 10240 x 3072 pixels). They found that user frustration was significantly less with larger displays. The participants tended to use more physical navigation (although this was limited by the provided input devices) and less virtual navigation in the larger display conditions and this change also correlated to improved user performance. They concluded that the participants might have benefited from the naturalness of physical navigation and the reduction of potential frustrations of virtual navigation [Shupp et al. 2006].
Figure 4: Tiled LCD panel with 24 monitors as flat (left) and as curved (right) wall display [Shupp et al. 2006].
In the same experiment, Shupp et al. [2006] also investigated the effect of the curvature of the display as an additional independent variable. They compared the flat configuration of the tiled
Large, high‐resolution displays
LCD to a horizontally curved variant (see Figure 4). The experiment results showed that curving the display around the user decreased task time regardless of the viewport size (12 versus 24 monitors). Of all display conditions, user performance was the best on the curved twenty‐four monitor condition [Shupp et al. 2006]. In the flat condition, the user had to cover a large distance to get from the left to the right border of the display. The curved configuration had the advantages that all pixels of the display had the same distance to the centre point and that this distance was defined according to the human visual acuity (see section 2.3.1, p. 31). Thus, all pixels were resolvable solely with head and eye movements and less physical walking was required. This optimality in display curvature, size and resolution also implies a great disadvantage: The curved design does not scale well with increasing display resolution and size, since human visual acuity limits the maximum viewing distance (radius of the circular arc) depending on the pixel density (resolution/size). Furthermore, the restricted space inside the curved display also limits the number of users and thus constrains multi‐user interaction as well as co‐located collaboration. In a follow‐up study, Ball et al. [2007] examined in particular the relationships between display size (viewport), amount of physical and virtual navigation, and user task performance in the context of LHRDs. The experimental setting of the above mentioned experiment of Shupp et al. restrained users in their physical movement while interacting with the system since the provided input devices mouse and keyboard required a stable surface (e.g. a table) for their proper operation (see Figure 4). Ball et al. also used the flat 8 x 3 tiled LCD panel, but provided participants with a wireless Gyration mouse that offers the flexibility to interact in mid‐air (see Figure 5 left & right). Hence, the participants had the full mobility while interacting with the LHRD. In order to measure the extent of participants’ physical navigation, they wore a hat equipped with retro‐reflective markers which were tracked by an infra‐red tracking system (see Figure 5 centre).
Figure 5: Participant using the wireless Gyration mouse with the 8x3 tiled LCD panel (left); the hat used to track participants’ position (centre) [Ball et al. 2007]. Wireless Gyration7 mouse (right).
The 32 participants performed four different tasks on a geographic map of the Houston area with embedded geo‐referenced data about 3,500 houses for sale: navigation to a target, search for a target, pattern finding for a group of targets, and open‐ended insight for a group of targets. For the navigation tasks, the participants were asked to navigate to a given house on the map and to read aloud the corresponding attributes of the house. The house was already shown on the screen, but in order to see the textual attributes navigation (zooming) might have been required (dependent on the display condition). For the search task, participants had to find houses that had particular attributes (e.g. a price between $100,000 and $110,000). In the pattern finding tasks, participants were asked to identify specific clusters or correlations of the 7
Wireless Gyration mouse: http://www.gyration.com
27
28
Design and evaluation of novel input devices and interaction techniques
displayed houses or their attributes. The insight tasks were designed as open‐ended tasks in which participants wrote down insights gained in the experience. No performance time was measured in the insight task and participants were given a rolling lecture stand on which to write. This task is sparsely described in the paper and the physical constraints limit its value for this discussion. The first three tasks, however, required a range of levels of detail, and hence participants had to navigate (zooming) physically and/or virtually. The participants performed the navigation and search tasks (within subject design) on all eight viewport width conditions (from 1 to 8 display rows each time with 3 displays in the vertical direction). For all display conditions, the task began with a best fitting overview of the same area of Houston. Although the displayed map sections were slightly different due to the different aspect ratios of the viewport conditions, the participants received the same starting point and a similar overview. However, the larger display conditions showed more details at once thanks to the increased amount of screen pixels available (higher resolution). The results showed a significant effect of viewport width on performance times for the navigation and search tasks. For example, for the navigation task, the performance time was reduced by a factor of 3.5, from 18.6 seconds on the one column display setup to 5.2 seconds on the eight column display setup [Ball et al. 2007]. In the search task, performance was reduced by a factor of 2. In summary, the results showed that larger viewport sizes lead to a significant and considerable improvement of task performance, at least for navigation and search tasks. There was only a near‐significant trend for the pattern finding task. Analogous with performance time, the amount of virtual navigation (zooming and panning via wireless mouse) also decreased with increasing viewport size. Ball et al. [2007] found that the number of virtual zooms and pans correlated with performance, while physical distance travelled did not. Physical navigation seems to be more efficient, since the larger viewports also lead, in general, to more physical navigation, but decreased performance time. The performance advantage of the usage of LHRDs is not only caused by less virtual and more efficient physical navigation; the participants also changed their navigation strategies and heuristics with increasing display size. As the participants were given the ability to see more of the overview and details at once, they were generally observed to make more intelligent navigation decisions [Ball et al. 2007]. A further interesting finding of Ball et al. [2007] concerns the subjective preference of the participants. When possible, participants preferred to physically navigate. For several task conditions, all 32 participants chose to use only physical navigation to complete their task. Ball et al. [2007] observed that participants first physically navigated as much as possible before virtually navigating. This subjective preference is also underlined by an initial study of Ball & North [2005] in which they reported that the participants felt less frustration with larger viewports and had a greater sense of confidence concerning their responses. These results are also in line with the findings of Shupp et al. [2006] discussed before. All of the thus far discussed experiments used the parameters display resolution and display size as a combined variable and manipulated both together by switching on more display tiles on a tiled LCD panel. Although both resolution and display size are the main parameters separating conventional displays from LHRDs, they can have different effects on the experimental results or
Large, high‐resolution displays
29
on the benefit of a particular display in general. From these experiments, it is not clear, if higher resolution or larger physical size leads to the better user performance, and if consequently one of them would be sufficient for producing similar results. Ni et al. [2006] separated the parameters display size and resolution by comparing four different display conditions, consisting of two different display sizes (21.6 versus 55 inches in diagonal) and two different resolutions (1280 x 720 versus 2560 x 1440 pixels, see Figure 6). Another difference between this and the previously discussed studies is the task domain. The 32 participants were asked to navigate in an Information‐Rich Virtual Environment (IRVE), a three‐ dimensional multi‐room art museum, in contrast to the previous studies in which participants navigated in a two‐dimensional geographic map. However, all experiments had in common that a two‐dimensional projection technique was used (instead of stereoscopic imaging).
Figure 6: Display variants to evaluate individual and combined effects of display size and resolution on task performance: IBM T221 LCD as small display with high and alternatively low resolution (left). Rear‐ projection screen as large, low‐resolution display (centre). VisBlocks: projection‐based large, high‐ resolution display (right) [Ni et al. 2006].
The participants were asked to navigate through the virtual museum while searching for and comparing different paintings and their metadata (e.g., artist or price). The results revealed significant main effects of both size and resolution. The display size seemed to play a dominant role, since the participants performed with both large display setups better than with the small setups (independent of their resolution). Ni et al. [2006] also reported that the participants felt more present when experiencing large displays.
Figure 7: Average task performances for the two resolution (low/high) x two display size (small/high) conditions. Results show main effects of display size and resolution. Error bars illustrate standard errors [Ni et al. 2006].
30
Design and evaluation of novel input devices and interaction techniques
Overall, the large, high‐resolution display outperformed the other three conditions. In this setup, participants could make use of peripheral vision for navigation and orientation and they were also able to see more labels at once. This effect is remarkable since the resolution of the large, high‐resolution display (3.7 megapixels) in this experiment was not very high compared to the LHRDs used in the previously discussed experiments (31.5 megapixels in the 8 x 3 condition of Shupp et al. [2006] and Ball et al. [2007]). In summary, the experiments showed that LHRDs are beneficial for users at least when navigating in two‐ and three‐dimensional information spaces and searching for as well as comparing information objects. The higher resolution and larger display sizes of LHRDs compared to conventional desktop displays enable better task performances, but also offer subjective advantages. The participants were less frustrated and benefited from the naturalness of physical navigation [Shupp et al. 2006]. They had more of a sense of confidence about their responses [Ball & North 2005] and felt more present in the larger and thus more immersive display conditions [Ni, Bowman, et al. 2006]. Moreover, the participants were generally observed to make more intelligent navigation decisions when using the LHRDs [Ball et al. 2007]. In general, the increased display size and resolution lead to more physical navigation, although the LHRDs are able to visualize all relevant information at once. The reason underlying the increased amount of physical navigation is quite obvious when considering the human visual capabilities.
Large, high‐resolution displays
31
2.3 Human visual capabilities With recent advances in technology, LHRDs providing hundreds of millions of pixels covering entire walls can be constructed. One of the LHRDs with the highest resolution worldwide (see Multi‐Megapixel Display List8 for the ranking) is the Stallion cluster of the Texas Advanced Computing Center that provides 307 megapixels based on a flat 15x5 tiled LCD panel (see Figure 8). Here, the pixel pitch, the size of a single pixel, is just 0.25mm, but the entire display has a width of over 10 meters. Thus, the user has to come close to the display to perceive the detailed information represented by a few pixels or to step back to overview the entire LHRD from a distant position. This physical navigation of the user is caused by the limitation of the human visual system in terms of visual acuity and field of view.
Figure 8: Stallion Cluster at the University of Texas: Ultra high‐resolution display with 15x5 30 inch Dell LCD monitors and an overall resolution of 307 megapixels9.
2.3.1
Visual acuity
The ability of a person to visually resolve a spatial pattern is referred to as visual acuity. This term was coined by Franciscus Donders (1818‐1889) to describe the sharpness of vision. Herman Snellen (1834‐1908) later defined normal visual acuity as the ability to resolve a spatial pattern separated by a visual angle of one minute of arc. Thus, if a user is to be able to perceive an individual pixel (0.25 mm) on the Stallion Cluster, for example, she has to be closer than 85.9 cm to the display wall (see Equation 2). With larger viewing distances the individual pixels merge with their neighbours and the information represented on the pixel‐level disappears. Since the Stallion Cluster has a display width of more than 10 meters, it is clear, that there is no single position from which a person will be able to perceive all 307 megapixels. Thus, the user perceives and explores the information displayed on a LHRD as she is accustomed to explore
8 9
Multi‐Megapixel display list (last update 2008): http://kvmsansv.com/multi‐megapixel_displays.html Stallion cluster, University of Texas: http://www.tacc.utexas.edu/resources/visualization/
Design and evaluation of novel input devices and interaction techniques
information in the real world (e.g., searching for a book in a large book shelf) by physically moving in front of the LHRD. Eye
Fovea
32
Visual Axis
Figure 9: Visual angle α of an object measured from the optical centre of the eye (adapted from [Ware 2004]).
2 arctan
h 2d
Equation 1: Calculation of the visual angle α with viewing distance d and object size h.
α 2 tan 2
2 tan
1 120
Equation 2: Calculation of the maximal viewing distance to perceive and distinguish between individual pixels (visual angle α = 1/60°) with normal visual acuity (also noted as 20/20 vision).
However, for certain visualization techniques and information spaces, it is critical to be able to see each individual pixel, such as the PixelMaps technique used to visualize census data in Figure 3. In order to read a displayed text it is also essential to be able to distinguish the different characters. The Latin alphabet has several characters that look very similar and only a single or few pixels separate them from each other with common font types and sizes: il ij fl l! oc EF QO 83 ‘’ ,. ,; If the viewing distance is too large the characters blur and i, l or ! look practically identical, for example. The importance of this challenge is underlined by the fact that reading characters (standardized optotypes) is the most common method of assessing individual visual acuity (see Figure 10). For other information domains it could be useful for at least neighbouring pixels to merge, for example when rendering photorealistic images where the perception of an individual pixel could compromise the naturalness of the image. Here, the visualization on the LHRD should create the illusion of a continuous real‐world but with the help of discrete pixels, thus a slightly larger viewing distance could be beneficial (e.g., neighbouring pixels merge for viewing distances roughly between 86 cm and 172 cm in the Stallion Cluster). However, if the viewing distance becomes too large, small details also become imperceptible. There is thus no optimal viewing distance for a display, but there is an appropriate range of distances for a specific information content and layout. Since LHRDs are mostly wider and higher than this distance span, users have
Large, high‐resolution displays
to move physically in front of a LHRD in order to perceive all displayed information from the upper‐left to the lower‐right display corner. An exception to this could be a spherical LHRD, since the distance between each pixel and the centre is identical (radius of the sphere) and can be optimized dependent on the desired pixel density and information visualization, but this high degree of specialisation makes the usage of such a display very inflexible. However, a further limitation of the human visual system makes physical navigation – even in a spherical display – inevitable.
Figure 10: Snellen chart10 with different sizes of standardized optotypes to assess human visual acuity.
2.3.2
Field of view
Due to the placement of human eyes, the binocular field of view covers roughly about 180 degrees horizontally (forward‐facing) [Ware 2004]. That means when a human with normal vision gazes straight ahead, the light reflected off of or originating from objects placed in a horizontal angle of about ± 90 degrees of the viewing direction impinges one (monocular) or both (binocular vision with depth information) of her retinas. The field of view with binocular vision covers only about 120 degrees horizontally. The vertical field of view is much smaller than the horizontal as is illustrated in Figure 11. Users’ at a glance experience is therefore limited by the visual field of view. This fact limits our ability to analyse large information spaces quickly large information spaces and to compare information objects directly. However, this is further limited by the anatomy of the eye and the distribution of its visual receptors. The type of visual receptors and their density is unevenly distributed on the retina. The area with the highest resolution and the best colour sensing, which consequently is the area with the best acuity, is very small and roughly at the centre of the retina. This area is named fovea and covers only about two degrees of the field of view [Dowling 1987]. Humans perceive their environment by saccadic movements of the eyes in order to position the fovea in the direction of interesting 10
Snellen chart: http://en.wikipedia.org/wiki/File:Snellen_chart.svg
33
34
Design and evaluation of novel input devices and interaction techniques
details followed by a short fixation. Thus, there is already physical movement needed to successively build up a clear mental image of one’s environment or the information visualized on a LHRD. However, the saccadic movements are mostly subconscious, very direct and require minimal physical exertion. More physical navigation is needed if the desired information is on the border or outside of the field of view. Therefore, eye movements are combined with head and body movements, increasing physical load and the degree of consciousness associated with the movements.
Figure 11: The human visual field of view when gazing straight ahead. The fields are constrained by facial features e.g. the nose. The darker‐gray overlap shows the region of binocular vision [Ware 2004].
As previously discussed, spherical displays provide the advantage that all pixels are equidistant to the centre and the pixel density can be optimized for human visual acuity. Due to the limited field of view, however, this solution also requires physical navigation (at least head and bodily movement) of the user to perceive all parts of the display. That applies likewise to cylindrical displays such as the 360° ZKM PanoramaScreen illustrated in Figure 12.
11
Figure 12: 360° PanoramaScreen of the ZKM Karlsruhe displaying the artistic installation Globorama. User move physically inside the immersive display and explore the virtual world with the help of an interactive laser pointer [König et al. 2008].
11
ZKM Center for Art and Media Karlsruhe, Institute for Visual Media: http://www.zkm.de/bildmedien/
Large, high‐resolution displays
2.4 Summary Wall‐sized displays with millions of pixels offer various advantages compared to conventional desktop monitors. The increased display real estate of LHRDs provides the possibility of visualizing very complex information spaces at a glance. In addition to virtual zooming and panning, the user is also able to physically explore the “information wall” and to utilize natural navigation strategies well‐known from the real‐world. Several empirical studies have shown that LHRDs enable better performance times for navigation, search and comparison tasks as well as giving users more of a sense of confidence. However LHRDs also introduce new challenges for the design of appropriate input devices. A fundamental requirement is support for physical mobility while interacting with a LHRD. Conventional input devices such as a mouse and keyboard require a stable surface which impedes free movement and fluid interaction. We will address this challenge in the next chapter, introducing an input device specially designed to enable interaction with LHRDs even from distant positions.
35
36
Design and evaluation of novel input devices and interaction techniques
Designing Input Devices for LHRDs
3 Designing Input Devices for LHRDs Contents 3.1
Design Space & Measures .............................................................................................. 38
3.2
Design Space Classification ............................................................................................. 41
3.3
Laser Pointer Interaction ................................................................................................ 59
3.3.1
Related Work .......................................................................................................... 61
3.3.2
Requirements & Features ....................................................................................... 62
3.3.3
Design & Development ........................................................................................... 63
3.3.3.1 Technical Requirements and Solutions .............................................................. 64 3.3.3.2 Hardware Design ................................................................................................ 68 3.3.3.3 Interactive Laser Pointer @ Design Space Classification .................................... 81 3.3.4
Evaluation ............................................................................................................... 83
3.3.4.1 Participants and Design ...................................................................................... 84 3.3.4.2 Apparatus & Procedure ...................................................................................... 84 3.3.4.3 Results ................................................................................................................ 85 3.3.5 3.4
Globorama: Laser Pointer Interaction between Art and Science ........................... 87
Summary ......................................................................................................................... 90
In the previous chapter we discussed the specific characteristics of LHRDs and the benefits of their usage as compared with conventional desktop monitors. However, they also introduce new challenges for human‐computer interaction, particularly for the design of suitable input devices. Due to the higher resolution of LHRDs, input devices are required that enable users to efficiently navigate hundreds of millions of pixels. At the same time, the input device should also offer the precision to effectively select or manipulate small objects, even if placed several meters away from the user’s position at the far end of the display (e.g., activating the Windows Start Button at the lower‐left corner or the Close Button (x) on the upper‐right corner in case of a standard Microsoft Windows desktop). Moreover, not only has the distance between the user and the display increased tremendously compared to a conventional desktop monitor setting, but this distance can also vary dramatically. Since LHRDs match or even exceed the capabilities of the human visual system in terms of spatial resolution and field of view – as discussed in the previous chapter – to a large extent physical navigation is required to perceive all of the pixels and to take full advantage of these displays. Therefore, users move in front of these displays and require input devices that accommodate this necessary mobility. This critical requirement poses several fundamental issues: the device should work wirelessly (in terms of data transmission and power supply), should be easy to transport (lightweight and comfortable handling), should work anywhere in front of the LHRD (without restrictions such as a table as in the case of mouse input), and the interaction speed and accuracy should scale well with larger distances and
37
38
Design and evaluation of novel input devices and interaction techniques
extreme positions. Moreover, this device should also function in a collaborative setting with multiple users and multiple identical or different devices in parallel. In order to investigate these requirements more systematically we created a classification scheme for the design space of input devices in general and the corresponding usability measures. This will enable interaction designers to explore diverse design alternatives and to discuss and evaluate them systematically. Based on this groundwork we developed a new input device that is designed specifically to fulfil the particular needs of users interacting with LHRDs: an interactive laser pointer that offers fast and precise interaction from almost any position and distance. We will discuss the hardware and software design of our solution in the following sections and present an empirical study we conducted to assess the usability of the laser pointer method of interaction. Furthermore, we will present an example use case of the laser pointer: the artistic installation Globorama. Here, the laser pointer was used in two exhibitions with thousands of visitors. This offered the opportunity to complement the empirical findings of our experiments with more qualitative insights gained through observations and questionnaires in a real world scenario.
3.1 Design Space & Measures “Input devices sense physical properties of people, places, or things”, [Hinckley 2008]. They are the controls enabling humans to embody their mental actions in digital operations. A simplified model of the human‐computer interaction is illustrated in Figure 13. The communication can be seen as a closed‐loop system where the human receives information about the current machine state by visual stimulation provided by a display, the output device. Also other human senses can be incorporated in the information transmission such as hearing, touch, or proprioception. The human perceives and processes the information and responds by using the input devices resulting in a manipulation of the machine state. The terms input and output are defined with respect to the machine [MacKenzie 1995]. Typically, input devices are controlled by human limbs such as hands, arms, and feet. However, input devices can also track eye and head motions, interpret speech commands or even translate specific activation patterns of the human brain into predefined digital operations (e.g., moving an object).
Figure 13: The human‐machine interface, a closed‐loop model of the human‐computer interaction with input and output devices as intermediaries. The input devices are the controls humans manipulate in order to change the machine state [MacKenzie 1995].
Designing Input Devices for LHRDs
Over the last 35 years, several taxonomies for input devices have been presented, each focusing on specific properties and covering the input devices of their time. Foley & Wallace [1974] discovered common data types and features shared by all input devices in the context of interactive computer graphics. They defined five primitive virtual devices that can be used to represent or simulate the full variety of input devices and their data types. The assumption was that “[...] every physical input device can be treated as a physical realization of one, or several, of just five distinct virtual devices: the pick, the button, the keyboard, the locator, and the valuator”, [Wallace 1976]. The main intention was to achieve device independency in order to facilitate program portability, reusability of existing algorithms, and interface standardization.
Locator: the locator is a virtual device used to indicate a position and/or orientation with respect to the display space. Prototypes of the locator are pointing devices such as the mouse or the joystick. Pick: the pick is used to designate user defined objects (e.g., drawn lines, curves, or text) by directly pointing on it. A prototype of the pick is a lightpen. The pick produces a hit event which carries a reference to the selected graphics object (in contrast to the locator that carries the location without referencing objects). Button: with the button a predefined program action can be performed including the generation of a specified symbol or a function key. The button can be combined with a pointing device in order to trigger a selection (e.g., mouse button) or multiple buttons can be bundled together simulating a keyboard. Keyboard: the keyboard is a virtual device that is used to input text using standardized characters. Valuator: the valuator is used to determine a numerical value. A prototype for a one‐ dimensional valuator is a potentiometer. Foley & Wallace [1974] defined these virtual devices based on their experiences in the interactive computer graphics domain and focused on improving efficiency by identifying common features between existing input devices. When designing new input devices, however, it can be more inspiring to observe device differences and specific characteristics. Buxton [1983] introduced a taxonomy for continuous input devices that illustrates the diversity of the devices and the design space in general based on a tabular categorization (see Figure 14). He identified several independent design dimensions that form the design space: the dimensionality of the input (1D, 2D, 3D), the property that is being sensed (position, motion, pressure), the agent of control (hand, foot, voice), and the interaction directness (touch or mechanical intermediary).
39
40
Design and evaluation of novel input devices and interaction techniques
Figure 14: Tableau of Continuous Input Devices (adapted from [Buxton 1983]). The input devices are categorized by the first order dimensions property sensed (rows) and number of dimensions sensed (columns). “Subrows distinguish between devices that have a mechanical intermediary (such as a stylus) between the hand and the sensing mechanism (indicated by M), and those which are touch sensitive (indicated by T). Subcolumns distinguish devices that use comparable motor control for their operation” [Buxton 1983]. An updated online version is available at http://www.billbuxton.com/lexical.html.
Card et al. [1990] extended the taxonomy of Buxton by also integrating discrete input devices such as a keyboard. Similar to Buxton’s Tableau of Continuous Input Devices, the taxonomy of Card et al. is also represented in a tabular matrix, but it provides more details concerning the dimensions and the classified input devices (see Figure 15). The dimensionality is split explicitly into linear and rotary dimensions, and each sensing feature of an input device is represented on its own (e.g., a three‐button mouse senses linear movements in the x‐ and y‐dimension and tracks the position of three physical buttons). This taxonomy is more expressive; however it covers relatively few design dimensions and does not cover the entire design space of input devices (e.g., hardware design or mobility). Therefore, both taxonomies provide a good framework to categorize, discuss and illustrate the diversity of input devices, but focus only on some major dimensions and high‐level properties. When designing new input devices, a complete description of the fundamental dimensions spanning the design space would be helpful, enabling a more systematic approach to design and engineering.
Designing Input Devices for LHRDs
Figure 15: Input device taxonomy of Card et al. [1991] representing a three‐button mouse and a radio control with station chooser (slider), selection‐knob (OFF, AM, FM) and volume control. “Circles are used to indicate that a device senses one of the physical properties shown on the vertical axis along one of the linear or rotary dimensions shown on the horizontal axis. For example, the circle representing the radio volume control indicates a device that senses an angle about the Z axis. The position in a column indicates the number of values that are sensed (i.e., the measure of the domain set). For example, the circle representing the selection control represents a discrete device. Lines are used to connect the circles of composite devices. A black line represents a merge composition (such as the X and Y components of the mouse). The dashed line represents a layout composition (such as the three buttons on a mouse, represented by a circle with a 3 in it to indicate identical devices)”, [Card et al. 1991].
3.2 Design Space Classification In order to achieve a more thorough description of the design space we conducted a literature review concerning input device taxonomies, classifications, and evaluation methods. We extracted features that describe the functionality and quality of an input device with respect to human‐computer interaction. We categorized these features along the high‐level classification of MacKenzie [1995] who distinguishes between device properties and parameters, as follows: “Properties are the qualities which distinguish among devices and determine how a device is used and what it can do“, [MacKenzie 1995]. The features presented by Buxton and Card et al., such as dimensionality and sensed property can be classified as device properties, for example. These properties are specified by the interaction designer and fixed by the utilized sensing technology and hardware design. A mouse, for example, senses movements in two dimensions. This property is based on a design decision and cannot be adjusted or optimized without changing the general functionality of the input device. “A parameter is any characteristic of a device or its interface which can be tuned or measured along a continuum of values“, [MacKenzie 1995]. Parameters are features of the specific device implementation, such as the weight of the hardware device or the resolution of the sensor.
41
42
Design and evaluation of novel input devices and interaction techniques
Higher sensor resolution can be beneficial for interaction speed and accuracy, but would not change the overarching interaction concept – in contrast to the device properties. We therefore project our analysis of the design space onto these two major categories that help to describe the functionality of an input device. In order to assess the quality of an input device, diverse measures can be used, each of which focuses on specific aspects. We complement our categorization of the design space by illustrating an example set of usability measures that are suitable for assessing the quality of input devices with respect to human‐computer interaction. This assortment of measures derives from our literature review and is categorized with respect to the [ISO‐9241‐11: 1998] that defines effectiveness, efficiency and satisfaction as the main usability measures. An overview of our classification is illustrated in Figure 16 and the individual items are discussed below.
Designing Input Devices for LHRDs
Figure 16: Classification of the design space of input devices and corresponding usability measures.
43
44
Design and evaluation of novel input devices and interaction techniques
INPUT DEVICE PROPERTIES o Physical property sensed Category: Input device properties Reference: [Buxton 1983], [Hinckley 2008], [Jacob 1996] Input devices sense physical aspects or properties of the user, the user’s environment, or the hardware input device itself. The most common physical properties being sensed are position, motion, and pressure. For example, touch screens track the absolute position of a finger, a mouse measures relative movements (the change in position), and isometric joysticks measure the pressure imposed by users upon the stationary stick (e.g., IBM pointing stick). However, other physical properties can be utilized for human‐computer interaction as well, such as room or body temperature, light intensity, sound level, electric current, or capacity. o Type of motion Category: Input device properties Reference: [Card et al. 1991], [Hinckley 2008], [Jacob 1996] When sensing position, motion, or pressure, the direction of the force imposed by the user can be differentiated. For example, physical sliders or buttons offer a linear movement in contrast to rotary knobs that offer angular modifications. In case of gestures (e.g., finger, stylus or mouse gestures), combinations of linear and angular motions are often used in order to trigger predefined commands, to sketch geometric shapes, or to write characters. o Continuous vs. discrete input Category: Input device properties Reference: [Buxton 1983], [Jacob 1996] Currently, there a two larger groups of input devices that are mostly described as pointing devices (e.g., mouse) and text input devices (e.g., keyboard). A more formal differentiation is based on the type of their input set: continuous versus discrete input. Continuous input devices such as pointing devices sense physical properties of an analogue, continuous world with an infinite set of input values (infinite domain set) – although, from a technological point of view, the input values are discretized by the digital sensing technology. Keyboards, buttons in general, and also some rotary knobs provide discrete input, since they are designed to handle only a finite number of input values. They provide a limited number of states – mostly only two: key/button pressed and key/button released. o Degree of freedom Category: Input device properties Reference: [Buxton 1983], [Hinckley 2008], [Jacob 1996] The degree of freedom (DOF) specifies the total number of dimensions an input device senses. A button senses linear movement in one dimension, a mouse
Designing Input Devices for LHRDs
o
o
measures relative movements in two dimensions, and – with the help of an optical tracking system – the position of objects equipped with retro‐reflective markers such as a flystick can be tracked in a three‐dimensional space. Moreover, if the orientation of the flystick can also be identified, the flystick provides a total of six degrees of freedom. Most pointing devices are augmented with buttons to trigger selections or special short‐cuts. The degree of freedom of such a composite device increases with the number of buttons (e.g., 6 DOF Flystick + 2 Buttons = 8 DOF). The three spatial dimensions belonging to the tracking in space are closely related, since users can change the values in all three dimensions by performing just one action: moving the flystick along the space diagonal, for example. These related dimensions are called integral dimensions. The dimensions of the buttons in the flystick example have to be modified independently and thus are denoted as separable dimensions [Jacob 1996]. Agent of control / input modality Category: Input device properties Reference: [Buxton 1983] In order to communicate with computers, humans may utilize diverse interaction modalities. They can voice verbal commands, move physical input devices by hand, point with finger gestures to control the screen cursor, select objects by looking at them, change values with foot pedals or in the future may navigate just by thinking – just to mention some examples. Although the most common input devices, mouse and keyboard, are controlled manually, humans’ capabilities of communicating are very rich. Multimodal interfaces support two or more user input modes that can be used either individually or simultaneously [Oviatt 2008]. Most multimodal interfaces are implemented by combining the interaction data of multiple unimodal input devices such as voice commands and finger positions (e.g., Put‐that‐there, [Bolt 1980]). However, multiple input modes can also be integrated within one hardware device, allowing for richer interaction. A general design consideration for both unimodal and multimodal input devices concerns users’ involvement. Oviatt distinguishes in this context between active and passive input modes: “active input modes are ones that are deployed by the user intentionally as an explicit command to a computer system (e.g., speech). Passive input modes refer to naturally occurring user behaviour or actions that are recognized by a computer (e.g., facial expressions, manual gestures). They involve user input that is unobtrusively and passively monitored, without requiring any explicit command to a computer”, [Oviatt 2008]. Direct vs. indirect control Category: Input device properties Reference: [Buxton 1983], [Hinckley 2008], [Jacob 1996] Direct input devices offer minimal cognitive and physical distances between the input action and the resulting output. Moving a virtual object on a touch display
45
46
Design and evaluation of novel input devices and interaction techniques
o
is very direct, for example, since the user can directly push the object with their finger. (1) There is no (noticeable) physical distance between the finger and the displayed object: the input and output spaces are identical. (2) There is also no hardware device that could increase the distance and require additional cognitive and motor effort for its usage. (3) The input action of the user matches the visual feedback on the display. This direct touch input, on the other hand, introduces occlusion and precision problems (see [Vogel & Baudisch 2007] for a detailed discussion), whereas using a mouse does not result in information being occluded. However (1) the physical distance between the mouse and the display is larger, (2) the mouse device has to be handled and (3) also the associated cognitive effort is higher. The application of a mouse in an environment is not trivial, since the mouse is normally operated on a horizontal table, but the resulting pointer movement acts on the vertical display. The learning effort for a mouse is thus much larger as compared to a more direct input such as a touch display. The directness of input devices is related to the directness defined by Hutchins et al. [1985] in the context of direct manipulation interfaces: “[...] the information processing distance between the user's intentions and the facilities provided by the machine. Reduction of this distance makes the interface feel direct by reducing the effort required of the user to accomplish goals”, [Hutchins et al. 1985]. Feedback / output modality Category: Input device properties Reference: ‐ The stimulation of human senses by an input device in response to an input action is not often considered in the discussions of the design space of input devices in the literature. We introduce this property since additional feedback at the origin of input is of critical importance, in addition to the visual feedback already given on the display. This is obvious when comparing physical keyboards with virtual on‐screen keyboards. A key issue of the latter “is the lack of tactile feedback of the keys, both vertically (the non‐linear resistance of a key) and laterally (key surface features that prevent the finger from drifting away)”, [Zhai et al. 2005]. Without the tactile feedback, users are restricted in effectively writing blind and the interaction performance decreases in general. The ISO standard [ISO‐9241‐9: 2000] also specifies requirements for input devices concerning tactile and kinaesthetic feedback: Buttons should have a displacement between 0.5 mm and 6 mm and the displacement force should be within the range of 0.5 N to 1.5 N until actuation. Thus, the desired feedback of an input device has to be considered from the very first steps of hardware design. In addition to these more passive feedback modes, active feedback can also be given by vibrators (well‐known from cell phones), embedded audio or light sources, or force‐exerting mechanical arms providing haptic feedback (e.g., for virtual environments). However, more unconventional output modes can also be used for stimulating human smell, balance or heat senses, for example. For the design of input devices for LHRDs, feedback is particularly important.
Designing Input Devices for LHRDs
o
Due to the limited field of view, users are not able to view the entire display from all positions. Additional feedback at the input device can catch the user’s attention and ensure that a notification or an error message is noticed. LHRDs are often used by multiple users. An input device with output functionality can provide user‐specific and private feedback. Users can be individually notified without bothering or irritating other users. Multi‐device, multi‐user support Category: Input device properties Reference: ‐ There are very few cases in which only one input device is utilized (e.g., automated teller machine). In most cases, at least two input devices are used in combination ‐ the mouse and keyboard. It is not unusual, however, to have more input devices running. Taking the setting of the author as he writes this text as an example, the following input devices are ready for input: a laptop keyboard and an external keyboard (higher comfort), the embedded touchpad including mouse buttons, a wireless mouse, an embedded camera including a microphone, and a fingerprint reader (not to mention the passive input devices such as the light sensor, the accelerometer of the hard drive, and the display‐ closing switch). Although not all devices are used in parallel, they have to be technically designed to allow that. This is not a trivial issue ‐ in the case of wireless input devices, for example, there are limited frequency ranges open for use (in Germany these are specified by the Bundesnetzagentur12). The radio modules should therefore be able to handle interference caused by multiple devices and should provide alternative frequencies and suitable identification mechanisms. If multiple users are working together, for example in the context of LHRDs, the input devices should technically and conceptually support multiple devices and also multiple users interacting simultaneously. Touch displays should therefore be able to track several fingers in parallel without technical interference. Even the operating system or the application software should enable multi‐point interaction such as the Multi‐Point X Server of Hutterer & Thomas [2007].
12
Bundesnetzagentur: http://www.bundesnetzagentur.de
47
48
Design and evaluation of novel input devices and interaction techniques
INPUT DEVICE PARAMETERS The following parameters should be considered for the design or optimization of an input device. In contrast to the input device properties, these parameters can be tuned. They have a significant impact on the functionality and usability of the devices. o Resolution Category: Input device parameters Reference: [Hinckley 2008], [MacKenzie 1995] Resolution is the resolving power of a sensor, basically the smallest incremental change that can be detected in a physical property such as position, orientation, pressure, temperature, or light intensity (see input device properties – physical property sensed). However, one has to keep in mind that sensors can introduce deviations such as non‐linearity at the extremes as well as offsets or gains due to environmental changes such as varying temperature or air‐pressure. The total resolution of an input device is determined by the resolution of its sensor(s) and the supported resolution of the associated data processing hardware/software (e.g., precision and range of the data types and the calculation) and the transmission channel (e.g., the bit depth). The resolution has a critical impact on interaction performance since it can limit the achievable accuracy and error rate. A sufficiently high resolution in the sense of efficient use of resources can be calculated based on the Shannon sampling theorem [Shannon 1949] with respect to the display resolution. However, the actual required resolution could be less, depending on the interaction design (e.g., size of buttons), the application domain (e.g., office work vs. gaming) and the user group (e.g., experts vs. novice users). o Sampling rate Category: Input device parameters Reference: [Hinckley 2008], [MacKenzie 1995] The sampling rate is the number of measurements per unit time of a sensor. In the case of optical sensors, such as a video camera, the sampling rate is expressed in frames per second (FPS); for other sensors the general unit of frequency Hertz (Hz) is used. Since most sensors are “blind” between the measurements, high sampling rates are desirable in order to catch all changes of the input device, the human body or the physical environment. However, the sampling rate is limited by the sensing technology, the computational power and the transmission bandwidth. If the sampling rate is too low, parts of the user’s input are not recognized at all and the interaction feels less direct and less responsive. Low sampling rates limit input accuracy and precision and can cause increased error rates. The determination of an optimal or a sufficiently high sampling rate is not trivial, since it depends on the sensing technology, the physical property to be measured and the velocity of interaction. Since most displays have a limited refresh rate of 60 Hz, a rule of thumb for pointing devices is to achieve at least the same rate for sampling. However, the possibility that fast movements (e.g., writing with a stylus or tracking finger
Designing Input Devices for LHRDs
o
o
gestures) may not be detected in sufficient detail is significant. Moreover, higher sampling rates are beneficial, since the input and output rates are not synchronized and the time difference between input measurement and display response causes a lag (see next item). For other physical properties far higher sampling rates are desirable: in order to reliably track hand or device gestures with accelerometers or optical systems, sampling rates of more than 100 measurements per second are essential. For speech recognition sampling rates on the order of 8 to 16 kHz are required. Moreover, higher sampling rates also provide the advantage of reducing signal noise without affecting the responsiveness of the system. Lag Category: Input device parameters Reference: [MacKenzie 1995] Lag is specified as the time delay between input action and output response. ”Any delay in the hand/eye control loop is likely to cause loss of user performance. A delay of up to 20 ms does not degrade user performance because it is usually not perceived. A delay of 40 ms results in a 10 % reduction in user performance and a delay of 100 ms causes a 50 % reduction in user performance compared with a situation in which no perceptible delay occurs”, [ISO‐9241‐9: 2000]. The lag of an interactive system has several sources: First, the sampling rate of the input device introduces a lag. For example, with a sampling rate of 60 Hz an average delay of 8.3 milliseconds is introduced (half of the time span between the measurements). In addition to this lag, additional delays caused by signal processing, data transmission, and other system related processes are added. Finally, the refresh rate of the display adds an additional delay similar to the sampling rate of the input device. However, if the computational and graphics power of the interactive system is not capable of rendering images with the same frequency as the technical display refresh rate (e.g., rendering of high‐resolution images), the effective refresh rate is reduced which in turn further increases the lag of the entire system. Since the lag caused by the input device is just one part of the total system lag and the other parts are not controllable by the designer of an input device, the lag introduced by this device should be minimized to the extent possible. Transfer function Category: Input device parameters Reference: [Hinckley 2008], [MacKenzie 1995] The transfer function describes the relation between the sensor measurement (e.g., finger position) and the input data forwarded to the operating system (e.g., pointer position). Dependent on the physical property being sensed and the sensor technology, either the input data can be directly transferred (position‐to‐position) or it has to be converted (e.g., velocity‐to‐position or force‐to‐position). Absolute pointing devices have a 1:1 mapping between the motor space (where the user interacts) and the display space (where the virtual
49
50
Design and evaluation of novel input devices and interaction techniques
o
pointer is rendered). Relative pointing devices, on the other hand, need to convert relative movements (or pressure) in motor space to absolute positions in display space. Here, the incremental movements are added to the last position in display space. In order to offer faster pointer movements or more precise pointing the transfer function can be modulated – this is known as the CD gain (control‐display gain). Casiez et al. discuss this as follows: “If CD gain is 1, the display pointer moves at exactly the same distance and speed as the control device; when CD gain is greater than 1, the display pointer moves proportionality farther and faster than the control device; and when CD gain is less than 1, the display pointer moves slower, covering less distance than the control device”, [Casiez et al. 2008]. The CD gain is thus a parameter that can be manipulated to adjust the pointing speed and accuracy to the current needs of the user. We will discuss the CD gain in chapter 4 (p. 91) more in detail where we will introduce a new precision enhancing pointing technique based on this input device parameter. Hardware design Category: Input device parameters Reference: ‐ Although most input device taxonomies ignore the hardware aspect of an input device, we consider this parameter as critical for usability and also for the (economic) success of an input device. There are many factors which affect the hardware design, though we find it necessary to mention mass, shape, material, and colour as the most relevant. The weight of an input device can have a great impact on pointing accuracy, but also on the subjective satisfaction of the user. If the device has to be operated in mid‐air such as a data‐glove and it is too “heavy”, its operation requires a high degree of physical exertion resulting in early fatigue, increased muscle tremor along with degraded pointing accuracy [Foley et al. 1984]. However, at least for short‐term interaction, more weight can be beneficial to compensate the natural muscle tremor resulting in higher pointing accuracy. This is one of several trade‐offs that have to be considered when designing a hardware input device. Moreover, the shape of an input device has to be customized to the desired handling of the device (ergonomic shape). The weight distribution should also be considered. Above all, the shape, the type of material and the colour have to be selected with the objective of inducing positive emotions and inviting the user to interact. They should communicate the possible actions the user can perform with the device. Norman describes this quality of a design with the term “perceived affordance”; “the actions the user perceives to be possible,” [Norman 1999]. Good hardware design facilitates understanding of the usage of the device. This can have an enormous effect on learning time, error rate and frustration of the user. Besides these design goals, there are also practical aspects such as robustness, easy maintenance (e.g., battery change) and hygienic issues.
Designing Input Devices for LHRDs
o
o
Naturalness Category: Input device parameters Reference: [Foley et al. 1984] “Naturalness captures the idea of transfer of activity from other everyday activities. Pressing the foot to slow down some operation is an example of such a technique, taking advantage of analogy to activities most people do regularly, such as using the brake of an automobile.”, [Foley et al. 1984]. Close relations between activities used in human‐computer interaction and in real‐world interaction provide the advantage of lesser cognitive and physical learning demands placed upon the user. Instead of learning artificial interaction styles the user can transfer well‐known concepts such as the direct manipulation of physical objects into the digital world. This can effectively reduce the gulf of execution, the gap between the user’s goals and the way they must be specified to the system [Hutchins et al. 1985]. A framework that gives a theoretical approach to the design, exploration and analysis of such reality‐based interaction (this is also the name of the framework) was introduced by Jacob et al. [2008]. This framework helps to explore diverse reality‐based designs based on four themes: naïve physics, body awareness and skills, environment awareness and skills, and social awareness and skills. The naturalness of an input device cannot be directly measured; however the four themes of reality‐ based interaction enable a more systematic investigation and may inspire new design alternatives. Motor space / footprint Category: Input device parameters Reference: [Card et al. 1991], [Hinckley 2008] In the literature, the term footprint refers to the amount of space on a desk the input device requires. Since some input devices are designed to operate in mid‐ air and provide the flexibility of interacting in more than two dimensions, the term footprint needs to be revised. We propose the term motor space, since this is also used in the context of the transfer function / CD gain describing the space where the user interacts (as opposed to the display space where the visual feedback is provided). For absolute pointing devices (1:1 mapping) the required motor space is identical with the display space. In the case of relative pointing devices, motor and display space are decoupled. Here, the required motor space depends on the resolution and sampling rate of the sensor as well as on the CD Gain and the resolution of the display. Clutching techniques, e.g., lifting and repositioning of the mouse, can help to virtually extend the motor space if it is constrained by the physical setting (e.g., a small desktop) or the user feels uncomfortable moving the device over the full motor space. In general, the motor space should be large enough to achieve the needed pointing accuracy, but small enough to efficiently cross the display with limited physical effort.
51
52
Design and evaluation of novel input devices and interaction techniques
o
Mobility Category: Input device parameters Reference: ‐ We defined the input device parameter mobility as the degree of users’ freedom to vary their location while operating the device. As discussed in chapter 2 (p. 21), users need to physically move in front of a LHRD in order to fully utilize the provided display resolution. Most input devices are designed to provide the flexibility to move them within the limited motor space required for interaction. However few input devices are designed to enable the user to move while interacting. In contrast to tethered devices, a wireless mouse can be carried around, but it needs a stable surface for proper operation that restricts the mobility of the device. A gyration mouse can be operated in mid‐air and it thus provides more mobility, however it still requires carrying the device. A touch display requires no additional hardware device, but restricts the user in the interaction distance to the display. More flexibility is provided by optical tracking systems that track finger‐ or hand‐gestures without any device. However, the space covered by the cameras is technically restricted. Thus, depending on the particular mobility requirements of the user, an appropriate device design, sensing and data transmission technology has to be chosen. There is also a more conceptual aspect of mobility that should be considered. [Vogel & Balakrishnan 2005] specified the requirement of a “smooth transition between interaction distances: The pointing device should smoothly transition from up close interaction, to interaction at a distance from the display. This implies that the way in which the device is operated should be consistent regardless of its distance from the display,” [Vogel & Balakrishnan 2005]. If users change their position, their interaction tasks may also change with distance or orientation to the display. A user wants to scribble directly on the screen and afterwards she overviews and saves the sketch from a distant position with the same input device, for example. Although the location and the tasks are changing, the interaction concept should be consistent.
Designing Input Devices for LHRDs
USABILITY MEASURES o Effectiveness “Measures of effectiveness relate the goals or subgoals of the user to the accuracy and completeness with which these goals can be achieved”, [ISO‐ 9241‐11: 1998]. Pointing accuracy Category: Usability measures – Effectiveness Reference: [Card et al. 1991], [Hinckley 2008] [Card et al. 1991] defined pointing precision as the size of a target that can conveniently be selected with the input device. In the context of human‐computer interaction, the terms accuracy and precision are mostly used synonymously for the extent to which a target can be hit (selected or just pointed at) with an input device. However, in physics and engineering there is a clear difference in their meaning: accuracy describes the deviation of a measured value from the actual (true) value. Precision describes the deviation of the measured values from each other (independently of the true value). If the user has the goal of hitting a target with an input device, the accuracy gives information about the ability to really hit the target (proximity) and the precision provides information about the ability to hit the same point multiple times (repeatability). It is obvious that both high accuracy and precision are desirable. For the sake of clarity and following the nomenclature of the [ISO‐9241‐11: 1998], we have decided to use the term pointing accuracy for the classification that subsumes accuracy and precision with the focus on the user goal – hitting a target. In order to investigate pointing accuracy, a variety of empirical tests can be used. [Myers et al. 2002] applied a dwelling task where users were asked to aim with the input device at a target as steadily as possible for a certain time (three seconds). The deviation was determined by averaging the Euclidean distance from the target. The [ISO‐9241‐9: 2000] proposes to use one‐ directional or multi‐directional tapping tasks where the users are asked to point and select diverse targets subsequently which are varied in their size and their distance to each other. Based on Fitts’ Law [Fitts 1954] – a psychological model for human motor behaviour – the throughput of an input device can be calculated (index of performance). The throughput integrates pointing accuracy and pointing speed into one measure that can be used to compare several input devices. A factor of throughput is the effective target width that corresponds to the pointing accuracy. It describes the width of the distribution of coordinates selected by a user during a tapping test. See [Soukoreff & MacKenzie 2004] for a detailed discussion.
53
54
Design and evaluation of novel input devices and interaction techniques
Error rate Category: Usability measures – Effectiveness Reference: [Card et al. 1991], [Hinckley 2008], [MacKenzie 1995] The error rate is a very common and simple measure for effectiveness in terms of completeness. It describes the percentage of errors: the number of errors divided by the total number of actions. The definition of an error depends on the task. Using a tapping task, an error is counted whenever the user hits outside the target boundary. The error rate is therefore dependent on the size of a target. The error rate a user can achieve with an input device is only comparable with other devices if the experimental settings are comparable such as the size of the targets, their positions and the interaction distances. The error rate gives less information than pointing accuracy, since it simply counts whether or not the target was hit. It does not account for the absolute pointing accuracy: if the user hit directly at the centre of the display or almost at the boundary. However, this simplification matches the actual usage of pointing devices and current interface paradigms: a button is activated if it was selected (simple binary decision). The interface designer wants to know the pointing accuracy in order to optimize the button size – but for users the error rate is an obvious indicator for the effectiveness they can achieve with a specific input device. Effective motor space Category: Usability measures – Effectiveness Reference: ‐ We introduce the measure effective motor space that describes the actual usage of the available motor space for interaction. Although the input device parameter motor space (footprint) predefines the theoretically required interaction space, the individual usage by different users for different tasks and in different environments can vary greatly. The real usage of all areas of a touch‐sensitive wall display depends on, for example, the height of the user, the user interface design, social protocols, and group dynamics. Although the motor space covers several square meters, only a small part may be utilized. This insight may introduce further requirements such as the accessibility of distant objects from a central position or the redesign of the user interface layout. The effective motor space can be measured by tracking movements in motor space (e.g., hand movement) and constructing the outer boundary e.g., as a cube or a three‐dimensional convex hull based on the tracked input samples. Effective mobility Category: Usability measures – Effectiveness Reference: ‐ Similar to the previous measure, the extent of users’ bodily movement
Designing Input Devices for LHRDs
o
is also greatly dependent on the particular usage context. Ball et al. [2007] measured the actual physical navigation of users interacting with displays of different size and resolution. An interesting research aspect in this context is the relation between the effective motor space and the effective mobility. The latter can be measured and expressed in a manner similar to the effective motor space with tracking systems and the construction of the three‐dimensional motion boundary. For the effective mobility, however, the location of the user is measured, in contrast to effective motor space for which the location of the acting human limb or the controlled input device is of interest. A hypothesis may be that the effective motor space and the effective mobility correlate negatively to each other. In order to investigate such correlations we introduced the measure effective mobility as the extent of users’ motion in space. Efficiency “Measures of efficiency relate the level of effectiveness achieved to the expenditure of resources. Relevant resources can include mental or physical effort, time, materials or financial cost”, [ISO‐9241‐11: 1998]. Pointing speed Category: Usability measures – Efficiency Reference: [Card et al. 1991], [Hinckley 2008] Pointing speed reflects the time needed to complete a pointing task with a particular input device. In tapping tasks in which a task is achieved when the target is selected, the pointing speed combines the movement time and the selection time per task. The [ISO‐9241‐9: 2000] defines the movement time as follows: “time to move a pointing device from a start position to a target position excluding stimulus presentation time and button actuation time.” The more general term for button actuation time is the selection time that describes the time required to select the target, for example, by clicking a physical button. Practically, it is hard to distinguish between these two time spans, since they may be partially concurrent and depend on each other. Therefore, the movement time, used for calculating the throughput of an input device based on Fitts’ Law, also includes the selection time by convention. Considering the ecological validity the combination of both is reasonable, since most tasks in conventional graphical user interfaces (e.g., based on the WIMP13 interface paradigm) require the positioning of a pointer followed by the selection of an active area (e.g., a virtual button). Since pointing speed is defined relative to a particular task, the more comparable performance measure is the throughput (index of
13
WIMP: graphical user interfaces based on windows, icons, menus, and a pointing device [Dam 1997].
55
56
Design and evaluation of novel input devices and interaction techniques
performance) that is a composite measure based on pointing speed and pointing accuracy. Learning time Category: Usability measures – Efficiency Reference: [Card et al. 1991], [Foley et al. 1984], [Hinckley 2008] [Card et al. 1991] defines the measure learning time as “the amount of practice required before a user is proficient with a device”, [Card et al. 1991]. [Foley et al. 1984] differentiate learning time further: “Cognitive learning time is the time it takes to learn to use the technique to achieve the desired effect, while motor learning time is the time it takes to achieve the necessary physical skill to carry out the action”, [Foley et al. 1984]. The learning time gives information about the ease of learning to use an input device and its naturalness. For comparing different input devices it is critical to ensure that learning effects are stabilised by an appropriate training. Since learning usually follows a power function, the learning level can be determined by analyzing users’ performance improvement over time [Card et al. 1987]. At the beginning, users learn at a higher rate while the curve levels out over time. The [ISO‐9241‐9: 2000] proposes that “each subject should be allowed to learn the use of the input device until speed and accuracy do not show any significant improvements”, [ISO‐9241‐9: 2000]. When testing new input devices the cognitive and motor learning may last too long for a conventional cross‐sectional study. Here, longitudinal evaluation approaches offer more potential for valid measurements [Gerken et al. 2009]. Device acquisition time Category: Usability measures – Efficiency Reference: [Card et al. 1991], [Hinckley 2008] The device acquisition time specifies the time users require to get ready for interaction. If a physical pointing device is used, this is the time effort associated with grasping the device and locating the pointer on the screen. For input modes without a mechanical intermediary such as freehand pointing, users also need time to get ready, for example, by performing the desired pointing gesture and gearing towards the display. In various cases users switch between specialized input devices to carry out tasks, for example, writing a text with the keyboard and formatting the text with the mouse. If the total input performance is important, the accumulated device acquisition time increased by each switch may result in a significant overhead. This issue can be addressed by integrating the required input devices into a composite device such as the Touch&Type technique of Fallot‐Burghardt et al. [2006]. They reduced the total device acquisition time by enabling touch‐input on the surface of each key button of a conventional keyboard forming a
Designing Input Devices for LHRDs
o
large touch pad. Thus the user could control the pointer by sliding over the keys augmenting the conventional input capabilities of a standard keyboard. The physical distance between the pointing and text input is thus effectively reduced resulting in lower time overhead. A similar solution is well‐known from IBM laptops: the embedding of an isometric joystick in the centre of a keyboard (e.g., IBM pointing stick). Effort (perceptual, cognitive, motor) Category: Usability measures – Efficiency Reference: [Foley et al. 1984], [Hinckley 2008], [MacKenzie 1995] The effort reflects the extent to which perceptual and cognitive demands are placed on users and the physical exertion required in order to complete a task. High effort on one or all of these three distinct layers – perception, cognition and action – introduces fatigue and thus may have an effect on users’ satisfaction and the resulting interaction performance. Visual and auditory clutter may lead to perceptual fatigue, whereas the cognitive form of fatigue can be caused by unrealistic memory loads, displeasing stimuli and uncertainty [Foley et al. 1984]. Input devices that require excessive muscular strength or an inappropriate working posture can cause motor fatigue. The motor effort can be assessed using the Borg Scale [Borg 1970] that quantifies “subjective opinions about the level of effort a given input device (or task) requires”, [ISO‐9241‐9: 2000]. An overall workload score can be determined by the NASA‐TLX (Task Load Index) which allows subjective workload assessments based on a multi‐dimensional rating procedure to be performed [Hart & Staveland 1988]. Satisfaction / user experience “Satisfaction measures the extent to which users are free from discomfort, and their attitudes towards the use of the product”, [ISO‐9241‐11: 1998]. satisfying, pleasurable, engaging, entertaining, challenging, frustrating, annoying,... Category: Usability measures – Satisfaction / user experience Reference: [Card et al. 1991], [Foley et al. 1984], [MacKenzie 1995] “Satisfaction can be specified and measured by subjective rating on scales such as discomfort experienced, liking for the product, satisfaction with product use, or acceptability of the workload when carrying out different tasks, or the extent to which particular usability objectives (such as efficiency or learnability) have been met”, [ISO‐ 9241‐11: 1998]. In addition to the assessment of effort, the NASA‐TLX can also be used to quantify subjective ratings concerning frustration and perceived performance. An instrument for investigating satisfaction and user experience in particular is the AttrakDiff questionnaire [Hassenzahl et al. 2003]. AttrakDiff assesses pragmatic and hedonic
57
58
Design and evaluation of novel input devices and interaction techniques
qualities of an interactive product (e.g. an input device) based on a set of opposite adjectives that users have to rate. A very abstract but strong measure for satisfaction and user experience is the user preference that can be assessed in comparative evaluation studies. Here, users state their preference for a specific device after using different alternatives directly in comparison. This classification illustrates the diverse dimensions forming the design space of input devices. We developed this theoretical contribution by integrating the essential ideas of various very specific taxonomies (see listed references for each item) and measures in a consistent and comprehensive framework. Moreover, the existing taxonomies did not consider the requirements and possibilities of uncommon environments such as LHRDs. We therefore complement the classification with the dimensions feedback/output modality, multi‐device, multi‐user support, hardware design, mobility, and the measures effective motor space and effective mobility. The classification is intended to support the informed design, the systematic description, and the methodical evaluation of input devices. Based on this classification, designers are able to systemically explore diverse alternative designs along the dimensions of the design space. They may document their design decisions and describe the resulting solution based on this theoretical groundwork (such as shown in section 3.3.3.3, p. 81). Furthermore, the usability measures show the connection between the design and the resulting quality of use – also beyond times and errors. In the case of interacting with LHRDs, high effective mobility of the input device, for example, can be even more important for the user than efficient usage. LHRDs are often used for presentation environments in which the flexibility to move in front of the display without physical restrictions caused by the input technology can be essential. In order to stimulate reflection on these different usability measures we directly included the measures within the classification as an integral part of the design space. In the next sections we will introduce an input device – an interactive laser pointer – which is especially designed to meet the requirements of users interacting with LHRDs. This input device and the classification were developed in parallel. In doing so, both profited mutually and were iteratively improved. We will discuss the software and hardware design of the interactive laser pointer in the following using the classification as a theoretical foundation. In section 3.3.3.3 (p. 81) we will describe the final design of the interactive laser pointer explicitly in terms of the design space classification. In using this formal categorization, we provide a clear, comprehensive, and comparable specification of the input device which serves as an example and springboard for further internal and external work.
Designing Input Devices for LHRDs
3.3 Laser Pointer Interaction Thanks to the increased display resolution and large dimensions of LHRDs compared to conventional desktop displays, they offer great opportunities for various industrial and scientific application domains. They are capable of visualizing large and complex information spaces without sacrificing context or detail. LHRDs are therefore widely used for exploration and analysis tasks, whereby one user or a group of users observe detailed information at close range or obtain an overview of the displayed information space from a distant position. As discussed in section 2.3 (p. 31), users are not able to perceive both detail and overview perspectives simultaneously, since the display capabilities exceed either the limited human visual acuity or the users' field of view, dependent on their distance from the screen. It therefore follows that the ability to move around freely while interacting with the display is an absolute requirement for input devices. Traditional input devices such as the mouse and keyboard are technically unable to fulfil this requirement since they require a stable surface for their proper operation. Wireless air mice with integrated gyroscope, or presentation aids with additional mini joystick or trackball offer more mobility but perform substantially worse than a traditional mouse [MacKenzie & Jusoh 2001]. Due to their relative interaction mode, they are also less suitable for supporting handwritten annotations and drawings. We therefore propose laser pointer interaction as a more usable interaction technique for large, high‐resolution displays because of the flexibility offered and the direct and intuitive manner of interaction. The well‐known laser pointer is thus used not merely as a presentation aid for accentuation purposes, but is additionally used to control the cursor, or more generally, the entire user interface. Users typically utilize a laser pointer as a natural extension of their hand, so the cognitive load for interaction is imperceptibly low since pointing is a fundamental human gesture. The mental association of physical laser pointer and virtual cursor movement is easy and is processed subconsciously. In contrast, the use of a conventional mouse is – at least in the beginning – more demanding, since physical and virtual movement take place in different planes (horizontal surface vs. vertical display) and with different speed levels due to the mouse acceleration that is applied. Mobility is a fundamental requirement for input devices that are to be used with LHRDs, and it is satisfied by an interactive laser pointer, since it is the reflection of the laser on the display that is tracked and not the position of the laser device itself. Thanks to the low‐divergence light emission of the laser beam, the user can interact from almost any position and distance on the LHRD. Whether the user writes directly on the display or is pointing to an object from afar, there is no need to change the input device or the interaction technique. Other vision based tracking systems such as infrared marker tracking are limited in their tracking space, since the position and orientation of the input device is measured directly with a limited number of cameras. Moreover, the tracking target, consisting of multiple markers which are arranged uniquely, are obtrusive and restrict the hardware design of the input device in terms of shape, size, and weight.
59
60
Design and evaluation of novel input devices and interaction techniques
14
Figure 17: Newsmap visualization on the Powerwall at the University of Konstanz controlled with the first version of our interactive laser pointer [König, Bieg & Reiterer 2007].
Interactive laser pointers are already used to some extent for presentation scenarios with a single low‐resolution projector or multi‐projection systems. However, LHRDs such as the Powerwall at the University of Konstanz (see Figure 17) with a display size of over 220 inches and a resolution of almost 9 megapixels poses as yet unknown challenges in the areas of tracking precision, speed, and interaction technique in general. In this section we present a flexible and scalable interaction toolkit that allows absolute and almost delay‐free input in the form of laser pointer interaction. Besides offering an intuitive interaction technique, and in contrast to previous research, we concentrate especially on satisfying the requirements of usage with large, high‐resolution displays particularly concerning mobility, accuracy, interaction speed, and scalability. Subpixel‐accurate tracking methods and the possibility of combing any number of cameras to increase overall resolution facilitate high technical accuracy. Furthermore, we apply a combination of dynamic and static Kalman filters in order to compensate for natural hand tremor in real time. In particular, we propose the use of an interactive laser pointer with an infrared laser diode (see Figure 17), which allows interaction without visible reflection on the display. In this way, no displayed information is overlapped by the laser reflection, and the style of the cursor (the visual feedback) can be changed in a very flexible manner. We compared our interactive laser pointer with a conventional mouse in a controlled experiment on the basis of the ISO standard 9241‐9. The 16 participants performed unidirectional tapping tasks with varying distances on the Powerwall in the University of Konstanz. Before we describe the evaluation study in more detail, relevant prior research is discussed in the following section. Subsequently, more detailed information about our laser pointer interaction toolkit and the developed hardware input devices is provided.
14
Newsmap Visualization of Marcos Weskamp, http://marumushi.com/projects/newsmap
Designing Input Devices for LHRDs
3.3.1
Related Work
In recent years, laser pointers have been widely used as presentation aids and have been integrated in remote controls, USB sticks, pens, and various other common devices. It has thus become a well‐known device, and the idea of additionally using it as an input device dates back to the end of the 1990s. Technical Solutions In 1998, Kirstein & Mueller [1998] presented a video‐based tracking system that was able to detect a single laser point on a projection surface. Although their hit rate of 50% was rather low, the basic idea seemed promising. They also proposed dwelling as an interaction technique for laser pointers; an action is triggered whenever the user keeps the laser reflection in an active area for a defined time. Olsen & Nielsen [2001] introduced enhanced actions with dwelling and the laser state, depending on the currently focused UI‐widget. They also compared a conventional mouse with their tracking system in an evaluation with eight participants. The movement time (MT) with the laser pointer was more than twice as long as the measured MT of the standard mouse. Clearly, the low frame rate of 7 fps (frames per second) and the remarkable delay of approximately 200 ms had a noticeable effect on the evaluation results. Chen & Davis [2001] combined eight interlinked cameras to track laser reflections on a back‐projection system named “Interactive Mural” with a display area of 1.8 x 0.6 meters and a resolution of 3796 x 1436 pixels. They detected multiple laser pointers in parallel with an interlaced frame rate of 60 Hz and distinguished different strokes by separate Kalman filters. Likewise, Ahlborn et al. [2005] also focused mainly on the practical issues of laser pointer tracking and described a robust and efficient dot detection method. Empirical Studies Cavens et al. [2002] compared a laser pointer emitting red light with a traditional mouse, and in a further study they compared the red laser pointer with one emitting invisible infrared light. The mouse and red laser pointer showed similarly good movement times, whereas the infrared laser pointer performed significantly worse. Only four and six persons respectively participated in these studies; in view of these small numbers and the remarkable tracking delay, the results should be interpreted carefully. In a study with 10 participants, Peck [2001] examined usage parameters for the design of laser pointer interaction techniques and found that a user needs between 0.9 and 1.4 seconds to acquire a target after turning on the laser. Furthermore, an additional time of at least one second is required to determine a dwell on a target. Peck also showed that the dwell area, and therefore the jittering, measures about 0.4° vertically and between 0.4° and 0.6° horizontally depending on the distance to screen. In a comparable evaluation, Myers et al. [2002] showed that, in contrast to Peck, the jittering is horizontally stable but vertically distance‐dependent. In a second experiment, Myers et al. compared a traditional mouse with a laser pointer and a touch‐sensitive SmartBoard. As expected, the direct interaction on the SmartBoard led to a significantly better performance rate with 11.80 Bits/s (index of performance in bits per second according to ISO 9241‐9), followed by the mouse with 6.98 Bits/s and the laser pointer with 5.08 Bits/s [Myers et al. 2002]. Oh & Stuerzlinger [2002] presented a similar result. They also compared a mouse with a visible laser pointer and identified an index of performance of 3.98 Bits/s for the mouse and 3.04 Bits/s for the laser
61
62
Design and evaluation of novel input devices and interaction techniques
pointer. Since their authors used different calculation methods, the absolute performance values of these two studies are not directly comparable. Nevertheless, a relative performance advantage of at least 30% for the mouse versus the laser pointer is generally observable. The cited studies and systems were employed in conjunction with conventional projection screens (e.g., 1.8 x 1.2 m, [Oh & Stuerzlinger 2002]) with small amplitudes (distance between targets: e.g., 60 cm, [Myers et al. 2002]) and short distances to display (e.g., 1.5 m, [Myers et al. 2002]). Whether or not these empirical findings were also transferable to large, high‐resolution displays such as the Powerwall at the University of Konstanz, with its display area of 5.20 x 2.15 m and resolution of 4640 x 1920 pixels was a driving question in our research. Here, the distance between targets can amount to more than 5 meters and users are not always able to survey the entire display because of their limited field of view. Hence, users have to turn their heads to switch between targets. To answer this question, a formal evaluation was undertaken and is described in section 3.3.4 (p. 83). First, however, we describe our laser pointer interaction toolkit as well as the developed hardware input device which we used as test environment for the controlled experiment. 3.3.2
Requirements & Features
Although some research regarding laser pointer interaction has already been carried out in the past few years, so far there has been no reference system that combines the individual and very specific solutions of different works in one flexible yet robust software toolkit. The laser pointer interaction toolkit introduced here represents such a combination and, in addition, claims to be especially suited to interaction with large, high‐resolution displays. Moreover, the much larger display size of LHRDs, the higher resolution as well as the users' mobility and their typical behaviour also have to be considered. To achieve an adequately high tracking resolution, our toolkit allows the interlinking of any number of cameras in a flexible client‐server architecture and therefore scales almost linearly. As well as increasing the overall resolution, the interaction precision is enhanced by applying sub‐pixel accurate tracking algorithms and a combination of static and dynamic Kalman filters. We were therefore able to compensate for natural hand tremor and the associated jittering of the cursor. Further main issues relating to our laser pointer interaction, are minimizing the interaction lag and supporting high interaction speed. With increasing distance from the display, even small laser pointer movements of only a few degrees already cause rapid cursor motion. To control that extremely responsive cursor effectively, users need an instant and correct visual feedback of their interaction. By the use of industrial cameras and optimized detection algorithms, we can track the laser with a frame rate of over 80 fps and a tracking and transmission delay of less than 10 ms in total. The result is that users receive a natural and direct feeling of interaction and high interaction performance. Technically, the cameras are positioned behind (back‐projection) or in front of the display in such a way that each camera looks onto a particular, predefined area of the display, and in combination they cover the entire screen. Automatic calibration allows the cameras to be freely positioned either in the centre of, or at an angle to, the specified display area. In addition to the camera’s extrinsic parameters, which derive from the display segmentation and the camera
Designing Input Devices for LHRDs
alignment, intrinsic parameters such as radial and tangential distortion are also acquired through the calibration. If the environment is stable, it is sufficient to calibrate the system once and thereafter to simply load the parameters determined earlier. A further feature of our laser pointer interaction toolkit is the support for visible (red, green, blue) and infrared laser‐rays. Existing systems work in the main with red laser pointers, in which only the laser point or the laser point in addition to the cursor is visible on the display. In consequence of tracking delay and inaccuracy, laser point and cursor neither act identically nor match exactly and these facts can irritate the user. We propose the primary use of infrared laser pointers. Infrared rays are not visible to the human eye and therefore allow visualization of just the virtual pointer, which can also be varied according to the system’s state, thus matching the user’s expectations. Moreover, in the case of a visible laser the natural trembling of the user's hand is clearly evident to everyone, for instance, the audience in a presentation situation. When using an infrared laser, the laser pointer trembles but is invisible while the jitter compensation reduces the trembling of the visible cursor. So the pointer remains largely steady even in situations with a higher stress level. 3.3.3
Design & Development
Within the seminar “Interaction Techniques for High‐Resolution Displays” in summer term 2006 a first feasibility study of an interactive laser pointer was conducted by Sebastian Rexhausen [Rexhausen & Gerken 2006] under the supervision of and in cooperation with the author of this thesis. The resulting prototypic installation used a conventional red laser pointer as pointing device and four low‐cost Logitech USB‐cameras for optical tracking (640 x 480 pixels resolution). In order to evaluate the feasibility of this prototype in combination with LHRDs, it was installed at the Powerwall of the University of Konstanz. The prototype offered the possibility to move the virtual pointer of the operating system, however the interaction lag was high and speed was very low with a maximum tracking rate of 30 frames per second. If the laser pointer was moved faster, the cameras lost track of the reflection resulting in missing movements. Moreover the positioning of the cameras and the calibration of the system took more than two hours, since the tracking areas of the cameras needed a defined overlap and the cameras had to be positioned precisely in orthogonal to the projection surface. Nevertheless, there was a certain inaccuracy of up to 10 cm between the actual position of the reflection and the tracked position. This was caused by the focal distortion of the camera lenses, the inaccurate camera orientation and the low resolution of the cameras. However the interaction concept was promising and showed great potential for further improvement. Based on these experiences, we derived several technical requirements for laser pointer interaction, in particular for use with LHRDs: robustness, scalability, responsiveness, speed, accuracy, and flexibility. We addressed these requirements (discussed below) in an iterative development which was driven by practical usage experiences gained during various demonstrations, presentations, and exhibitions over a time period of almost three years. Furthermore the conducted experiments informed the design of the interactive laser pointer and helped to identify usability flaws and potential for improvement. Up to now, four functional hardware devices have been developed as well as multitudinous software versions which finally resulted in a software toolkit named SquidyVision which is an essential component of the Squidy
63
64
Design and evaluation of novel input devices and interaction techniques
Interaction Library discussed in section 5.2 (p. 120). SquidyVision is not limited to laser pointer interaction; it also supports the tracking of finger positions on multitouch surfaces. Thus, we could successfully apply the developed techniques and gained insights to a wider field of application domains – relevant also for its commercial use. The multitouch table of the ICT AG Kohlberg15, is sold with SquidyVision for the optical tracking of finger positions. Since November 2009, SquidyVision has been free software and published as part of the Squidy Interaction Library under the GNU Lesser General Public License16 (LGPL). 3.3.3.1 Technical Requirements and Solutions
Robustness: The tracking robustness is a critical aspect for optical tracking systems in general. This includes the accurate identification of a target and keeping it tracked as long as it is available. In order to reduce potential disturbing factors and due to usability reasons we decided to utilize infrared laser diodes (785 nm) as light sources and industrial cameras which are also sensitive to near infrared light. The cameras were further equipped with daylight cut filters which effectively reduce light intensity below 750 nm. Since projectors, sun light, and warm‐light bulbs also emit infrared light, we developed a compensation algorithm which reduces the measured light intensity of all steady or very slow moving sources (e.g., the rising sun). This dynamic heuristic is based on the assumption that a user cannot keep the laser pointer completely steady due to the natural hand tremor. The jittering and the normal pointing behaviour of the user help to discriminate between disturbing light sources and the interactive laser pointer. This technique is extremely important for the robust tracking of our interactive laser pointer, since we use a class 1 laser diode that emits infrared light with an intensity of only 0.55 mW. Due to the low radiance intensity, the infrared laser pointer is, in contrast to commonly used class 3 red laser pointers (mostly 5 mW), absolutely harmless to the human eye and can be used in public areas without any safety concerns. Scalability: In order to provide laser pointer interaction on LHRDs, a single camera system is insufficient for two reasons. First, even if using a wide angle lens, the camera needs to be positioned at a great distance from the display in order to cover the entire LHRD (e.g., wall sized‐display). Second, a single camera is limited in its resolution and this restricts the accuracy of the interactive laser pointer. If the resolution of the camera is multiple times lower than the resolution of the display, it is difficult or practically impossible to hit a small object such as the Windows Start button or the closing cross button. In this case, the pointer cannot be moved smoothly but it visibly skips multiple display pixels. This imprecision can be partially compensated by interaction techniques such as Adaptive Pointing introduced in section 4.2 (p. 96). However, in order to provide high resolution optical tracking, multiple cameras have to be combined in a defined array covering collectively the entire LHRD. We developed a network‐based client‐server
15 16
ict Innovative Communication Technologies AG, Kohlberg, http://www.ict.de GNU Lesser General Public License, http://www.gnu.org/copyleft/lesser.html
Designing Input Devices for LHRDs
architecture that enabled us to plug‐in multiple cameras to the same computer, or alternatively to several independent computers connected via Ethernet connections. Each camera is driven by an individual client that processes the video stream, identifies one or multiple laser pointer reflections, and sends the position data to the server. Just communicating abstract data (in contrast to the full video stream) effectively reduces the needed network bandwidth and keeps the computing load at the connected clients. Thanks to this distributed computing approach our solutions scale very well with the number of cameras and therefore enables high‐precision optical tracking on LHRDs. Responsiveness & Speed: The responsiveness of the tracking system and the achievable interaction speed have great impact on the efficiency of users hand‐eye coordination and thus also on user performance in general. The importance of a preferably delay‐free tracking process is corroborated by MacKenzie & Ware [1993], who have determined a direct correlation between the measured performance of a device and the interaction delay – the time between input action and output response. It turned out that the negative influence on performance was negligibly small for delays below 25 ms. Taking this lag as an upper limit, we calculated the desired camera features for the case of applying laser pointer interaction to the Powerwall of the University of Konstanz (which is also the experimental setting for the comparative study discussed in section 3.3.4, p. 83): Starting with an average delay of 8.3 ms as a result of the display rate (60 Hz), and a maximum image computation and data transmission time of 10 ms (measured in our case), the camera’s refresh rate should not cause a delay of more than 6.7 ms on average in order to stay below 25 ms for the total system (8.3+10+6.7 = 25). To satisfy this requirement, we used three identical industrial USB‐cameras (model IDS 1540‐C, cost about EUR 650) with 80 fps (6.25 ms average delay) at a resolution of 640 x 512 pixels and a 4.8 mm wide‐angle‐lens. These cameras were positioned vertically centred behind the Powerwall, each covering 1/3 of the display. Recently, we were able to further reduce the interaction lag and increase the achievable pointing speed with SquidyVision by utilizing the graphics processing unit (GPU) instead of the central processing unit (CPU) for image analysis. The GPU enables efficient parallel processing based on NVIDIA’s parallel computing architecture CUDA17. Moreover we have been since able to replace the USB‐cameras with high‐bandwidth cameras (IDS GigE UI‐ 5460HE) based on gigabit Ethernet. The higher bandwidth of gigabit Ethernet (1 Gbit/s) compared to USB 2.0 (480 Mbit/s) enables us to increase the tracking frequency up to 120 frames per second (with a image resolution of 640 x 480 pixels) which assures also that very rapid movements and quick contacts are recognized and interpreted by the system. Accuracy: Thanks to the scalability of the system multiple cameras can be used in parallel in order to keep an optimal ratio between display resolution and tracking resolution (sum of all camera resolutions if arranged without overlap). In the case of the laser pointer
17
CUDA (Compute Unified Device Architecture), http://www.nvidia.com/object/cuda_home_new.html
65
66
Design and evaluation of novel input devices and interaction techniques
interaction (about 1530 x 640 pixels tracking resolution) at the Powerwall of the University of Konstanz (4640 x 1920 pixels display resolution) we had a ratio of about 1:3 which limits the pointing accuracy to three display pixels. This ratio is far from being optimal in terms of the Shannon sampling theorem [Shannon 1949], however we decided to keep the number of cameras and their costs low, while focusing on software‐ based improvements of the pointing accuracy. Instead of interpreting the brightest pixel of the current camera image as laser pointer reflection (if it is brighter than a predefined threshold), we used a sub‐pixel accurate blob detection based on [Oh & Stuerzlinger 2002]. Here, bright areas (blobs) are identified and their centre is calculated by weighting the intensity values. In this way, the position of this centre is not limited by the camera’s resolution, thus improving the total accuracy. However, this improvement is practically only valuable if the laser reflection and its representation on the camera image are larger than a camera pixel. Thus, larger laser diameters can improve the accuracy when applying sub‐pixel accurate blob detection algorithms. The tracking accuracy could be further improved by using more cameras; however users are unable to hold the laser pointer steady because of natural hand tremor. Peck [2001] identified an average deviation of 0.4° while remaining on one point for 3 seconds. Applying this data to the Powerwall, users would find it difficult to hit targets smaller than 18 pixels (2.09 cm) in height and width. This limitation would seriously impair the use of laser pointers for LHRDs, whose main application is the visualization of complex information spaces. For this reason we increased the interaction accuracy by compensating for the jittering with a multi‐model Kalman filter [Kalman 1960]. The Kalman filter models behaviour and predicts the next position based on previously measured deviations and movement speed. This prediction is compared with the measured data resulting in an iterative update of the movement model. This enabled us to reduce both human‐caused and technically caused noise. In order to support fast movements as well as precise hovering, a static, dynamic or weighted combination of both is used for the prediction based on a multi‐model approach. For the cursor’s final position, our laser pointer interaction toolkit does not use the measured coordinates but rather the smoothed predictions; this enables steady hovering in one position as well as smooth movements with different speeds. This configuration was evaluated in the comparative evaluation study discussed in section 3.3.4 (p. 83). In response to the results of this study, the pointing accuracy was further improved by applying the Adaptive Pointing interaction technique introduced in section 4.2 (p. 96). Thus we applied improvements on several layers: on the hardware layer by using multiple cameras; on the image processing layer by using sub‐pixel accurate algorithms; and on the interaction technique layer by using Adaptive Pointing. Flexibility: In our first feasibility study it took more than two hours to position the tracking cameras and to calibrate the interaction space. Addition, even a well calibrated system had an inaccuracy of up to 10 cm. In order to minimize the setup time as well as this inaccuracy, we developed a mainly automatic calibration method which reduced the calibration time to a few minutes (dependent on the number of utilized cameras). Moreover the calibration method also accounts for the focal distortion caused by the lenses (intrinsic
Designing Input Devices for LHRDs
67
camera parameters) and trapezoid distortion which is introduced if the camera is not precisely facing the tracking surface orthogonally (extrinsic camera parameters). During the calibration process, the cameras' positioning relative to the display and the corresponding tracking areas are determined automatically by sequentially visualizing a regular pattern (similar to a checkerboard) on each display segment (see Figure 19, left). The calibration algorithm determines the positions of all corner points of the white and black squares and matches them to the display coordinates. For this purpose we utilize state‐of‐the‐art methods for corner point detection which are provided by the OpenCV18 computer vision library. The number of displayed corner points is adjustable in order to also enable high precision tracking for curved displays. In this case the curvature of the display is measured with a fine mesh of hundreds of corner points. The granularity is only limited by the display resolution and the resolution of the tracking cameras. This calibration method gave us the flexibility to apply our laser pointer interaction to very different displays: the planar Powerwall of the University of Konstanz, the cascaded rear‐projection cubes at the Media Room19 of the Human‐Computer Interaction Group, the 360° PanoramaScreen20 of the ZKM | Center of Art and Media in Karlsruhe, and a conventional front‐projection screen in a conference room in the Canary Islands (see Figure 18 and Figure 19). Although these displays differ in their size, resolution, projection direction, and curvature, the laser pointer interaction could be applied uniformly across them all. After calibrating the particular setting, the parameters are saved in a configuration file which is automatically loaded at the next start enabling a fast start‐up procedure.
Figure 18: Laser pointer interaction at the large, high‐resolution Powerwall of the University of Konstanz (left) and at the Cube Wall at the Media Room (right) consisting of two individual rear‐projection displays each equipped with an infrared sensitive camera for optical tracking.
18
OpenCV (Open Computer Vision Library): http://sourceforge.net/projects/opencvlibrary/ Media Room of the Human‐Computer Interaction Group at the University of Konstanz, http://hci.uni‐konstanz.de/mediaroom/ 20 PanoramaScreen of the ZKM | Institute for Visual Media, Karlsruhe, http://on1.zkm.de/zkm/stories/storyReader$5803#panoramascreen 19
68
Design and evaluation of novel input devices and interaction techniques
Figure 19: Left: Calibration of the tracking area on the 360° high‐resolution PanoramaScreen of the ZKM Karlsruhe. Right: Demonstration of the laser pointer interaction and the artistic installation “Globorama” at the 13th International Conference on Intelligent User Interfaces [König et al. 2008].
3.3.3.2 Hardware Design So far, we have described the tracking system and corresponding aspects of the laser pointer interaction. However, the actual user interface for the end user is the hardware device. Therefore, the ergonomic design of the device, the provided interaction functionality and the perceived affordance stimulated by the device are major critical aspects for interaction quality and performance. We iteratively developed and tested several versions of the device which are described in the following paragraphs. Thereafter, we will discuss the final design along with the design space classification introduced in section 3.2 (p. 41). Version 1 The basic idea underlying laser pointer interaction is to use the well‐known laser pointer for controlling an interactive display. Besides tracking the reflection of the laser ray at the display surface for controlling the virtual pointer, the user needs additional degrees of freedom in order to control conventional WIMP applications such as for selecting an object or for activating a button. Since LHRDs are special environments which are used in addition to and less as replacement for traditional desktop work environments, the interaction techniques utilized on LHRDs should either be very intuitive or at least similar to the desktop interaction techniques users perform daily, in order to minimize learning time and to reduce usage errors. This is of particular importance, since LHRDs are often used in presentation environments in which users show higher stress levels for several reasons, e.g. due to their prominent role as presenter and the focused attention. Thus, the cognitive load caused by the interaction with LHRDs should be kept minimal. We therefore considered an infrared laser pointer with physical buttons as a good starting point for studying the hardware design and the laser pointer interaction in general. There are also more uncommon interaction techniques developed mainly for pen input which replace button‐clicks by predefined pen gestures [Hinckley et al. 2005], crossing‐based menus [Apitz & Guimbretière 2004], or hovering widgets [Grossman et al. 2006]. We decided to keep the interaction techniques at the beginning similar to those of the standard mouse, in order to enable us to perform the comparative evaluation study discussed in section 3.3.4 (p. 83). Thus the interaction performance of the input devices could be investigated with minimal influences from other undesired factors. Moreover, this initial setting builds the reference design for developing and evaluating more uncommon interaction techniques such as pointing gestures, crossing‐based menus, or other new techniques.
Designing Input Devices for LHRDs
So far, infrared laser pointers were mostly used in military settings for weapon training with high power laser diodes. For safety reasons, we needed a very low power laser pointer which we therefore had to build independently. Moreover this infrared laser pointer should be equipped with physical buttons which transmit their state (button pressed / released) wirelessly to a receiver in order to allow for the mobility needed for physical navigation in front of a LHRD. For the first version of our interactive laser pointer we developed, in cooperation with the “Wissenschaftliche Werkstätten21” of the University of Konstanz, a pen‐shaped laser pointer with an IMM‐CD849B low power infrared laser diode and a battery compartment for two AAA batteries (see Figure 20). In order to realize physical buttons and wireless data transmission, we used the button module and the infrared transmission system of a commercial remote controller (Infiniter LR1 PowerPoint Wireless Remote Controller). We shortened the original remote controller, mounted it on top of our laser pointer and connected the power cables to our battery module. The remote controller came with a USB infrared receiver which converts the pulsing infrared signal to page‐up and page‐down key events originally designed for controlling Microsoft Powerpoint. We converted these keyboard events into left and right mouse button events in order to fully provide the same functionality as the mouse. This allowed users to use our interactive laser pointer and a standard mouse interchangeably which provides an optimal evaluation setting for a controlled experiment. Unfortunately, the emission angle of the data transmission diode was very narrow which restricted the mobility to a small cone‐like interaction space. We therefore manipulated the emission angle by applying a small hot glue dot on the diode lens resulting in a wider distortion of the pulsed infrared light. This was a very simple trick that improved the interaction angle; however the user was still restricted with respect to angle (about 60 degree) and distance (about 2 meters) to the receiver. Moreover, the data transmission only worked with a direct line‐of‐sight between laser pointer and receiver, which is not always supported in collaborative settings in which multiple people are moving in front of a LHRD. Nevertheless, the first version of our interactive laser pointer enabled us to gain first insights and experiences and to perform quantitative experiments.
Figure 20: Version 1 of the interactive laser pointer based on a pen metaphor (built in December 2006). The laser pointer is equipped with a low power infrared laser diode, battery compartment, and an augmented button module with infrared transmission component (on top).
21
Workshops for Scientific Support and Equipment of the University of Konstanz, http://www.uni‐konstanz.de/struktur/technik/
69
70
Design and evaluation of novel input devices and interaction techniques
Version 2 In order to improve mobility, we decided to develop a second laser pointer version which integrates a wireless data transmission of the physical button states based on a ZigBee22 module replacing the infrared data communication of Version 1. ZigBee defines a high level network protocol for low power radio‐frequency communication. In contrast to the former optical data transmission, radio‐frequency communication does not require a line‐of‐sight and the utilized ceramic antenna enables communication ranges of almost 20 meters (unfortunately the metallic case impaired the communication quality – Version 3 addressed this problem by using plastic windows). Furthermore, a custom‐built button module was directly embedded in the case. In order to emphasize the analogy to mouse interaction, the buttons which emulate the left and right mouse buttons are also physically positioned to the left and right. Thus, the perceived affordance could be increased by fitting the physical layout to the mental model of the user. A third button was positioned in front of the two buttons forming the corner points of a notional triangle (see Figure 21). The intention was to highlight the third button as user‐programmable button and to emphasize the orientation of the laser pointer. The visual communication of the “top” of the laser pointer was further supported by forming the hardware case like a text marker. This was meant to facilitate handling the laser pointer like a pen, whereas the rectangular body of the case and the button layout on the upper side were suggestive of a TV remote control. These two variants of handling reflect our experiences that users change their handling dependent on their distance to the LHRD. If they are writing directly on the LHRD, as they may be used to doing on a blackboard, they handle the laser pointer like a pen. When steering to a specific point from far away, they handle the laser pointer in the whole hand as is familiar from using remote controls. Thus we supported both handling variants and also gained case volume in comparison to the cylindrical shape of Version 1. This enabled us to reduce the length of the laser pointer by placing the batteries side by side. Since users of the interactive laser pointer can control a LHRD from distant positions, they are not always able to perceive the visual feedback of the operating system, e.g., changing the icon of the pointer. We therefore integrated multicolour LEDs directly on the laser pointer closed to the buttons. Thus, users get personal feedback wherever they are.
Figure 21: Second generation of our interactive laser pointer with embedded button module, multicolour LEDs for visual feedback and wireless communication based on ZigBee (built in June 2007). The case design supports two different handlings styles: pen‐like writing as known from text markers or controlling from distant positions as known from TV remote controls.
22
ZigBee Alliance, http://www.zigbee.org/
Designing Input Devices for LHRDs
71
Version 3 Thanks to the successful tests with the first and second version of our laser pointer we were given the opportunity to contribute to the artistic installation Globorama which had been designed by Bernd Lintermann of the ZKM | Karlsruhe and Joachim Böttger of the Computer Graphics and Media Design Group of the University of Konstanz. The idea was to use our interactive laser pointer to navigate within high‐resolution satellite images which are displayed on a large 360° panoramic display. However, this project raised very tough requirements: The laser pointer was required to function for 8 hours a day over at least four weeks without any support. Thousands of visitors were expected to visit the installation and interact with the laser pointer. The laser pointer needed to be safe from theft and stable enough to endure thousands of clicks. And the aesthetic appearance and perceived affordance required further improvement.
Figure 22: Version 3 of the interactive laser pointer with improved button module, visual feedback on both ends, accelerometer for gesture recognition, mechanical vibrator for tactile feedback, ZigBee wireless communication, and an alternative wired option (built in September 2007).
In order to address these requirements we developed the third generation of our laser pointer which consisted of a translucent PVC case (polyvinyl chloride) strengthened by two aluminium shells. For improved maintainability the shells were clamped by three o‐rings enabling battery replacement without the need of a screw driver or any other tool. We choose the translucent PVC case because of several reasons: First, the communication quality could be improved, since the ZigBee antenna was no longer covered by the metallic case. Second, the weight of the laser pointer could be reduced. Third, additional visual feedback could be provided at both ends of the laser pointer by embedding multicolour LEDs. Sandblasting was used to achieve an equally diffuse illumination at the translucent surface of the PVC case. The ZigBee microcontroller as well as the button module was integrated on a professionally built double layer circuit board. In order to improve the ergonomic handling of the buttons and their perceived affordance, the button size was increased and the visual contrast was improved by using black plastic knobs on the brushed aluminium background. Furthermore we designed the third version as a multimodal user interface. In addition to manually pointing with the laser diode, physically pressing the buttons, and visual feedback given by the LEDs, we furthermore integrated a three‐axis accelerometer with a sensitivity of ± 6g that enabled the identification of moving gestures and orientation of the laser pointer. Based on this laser pointer version, diverse gestures sets for mind mapping sessions were investigated in the course of the masters thesis by Anton Stasche [Stasche 2008]. Moreover, a mechanical vibrator was integrated into the laser pointer providing tactile feedback as an additional feedback modality. Therefore, the third generation of our laser pointer provided various interaction possibilities and great potential for further research. Since the laser pointer needed to be safe from theft, we decided to also develop a wired version for
72
Design and evaluation of novel input devices and interaction techniques
the artistic installation Globorama. Thus no battery had to be replaced and the data communication was not influenced by the handling of the laser pointer. This was also a disadvantage of the wireless version. The antenna of the ZigBee microcontroller was positioned at the end of the laser pointer where no metallic case restricts the data transmission. However the users tended to keep the end of the laser pointer very close to their body which also leads to a remarkable disturbance of the wireless data communication. In September 2007, the wired version was exhibited at the ZKM PanoramaFestival23 in Karlsruhe and in May 2008 at the ThyssenKrupp Ideenpark24 at the trade fair centre Stuttgart with great success and was used there by several thousand visitors (see section 0, p. 87 for more details). Prototype 3.5 Since mobility is a fundamental requirement for an input device designed to support physical navigation in front of LRHDs, we redesigned the interactive laser pointer in order to achieve fully functional wireless data communication. Our approach was to arrange the antenna beside the laser diode at the top of the device in order to achieve more distance from the human body, the metallic case of the device, and other shielding objects. Thus, the head of the device has to be enlarged and reshaped. Unfortunately, the resulting hardware design did not turn out to be satisfactory. We asked several scientific, industrial and non‐expert users for their opinions and reactions to the device. They commented that the laser pointer’s look and feel was very technical and massive and some people even mentioned that it looks like a weapon. We therefore decided to stop further development steps of this version and looked for better designs.
Figure 23: Prototype of the next laser pointer generation 3.5 (built in December 2008). The antenna is integrated within the translucent head and the lower side is rounded for better ergonomic handling. Since the hardware design was not satisfactory, development was not finished.
In a first step, we asked students of the course “Interaction design for high‐resolution displays” to design a new pointing device with modelling clay (see Figure 24). They were informed about 23 24
ZKM PanoramaFestival, Karlsruhe, http://www.zkm.de/panoramafestival/ ThyssenKrupp Ideenpark, Neue Messe, Stuttgart, http://www.zukunft‐technik‐entdecken.de/
Designing Input Devices for LHRDs
73
the current design and were free to develop an improvement of the current version or a completely new device. Some of these device prototypes were very ambitious and in practice not realizable or were designed only for a very specific usage context. However, almost all designs showed ergonomic shapes and the proposed handling modes were quite common. Based on the discussions during this design workshop we agreed on two clay models which we considered suitable for further improvement (see Figure 25 and Figure 26). The first one was very much in contrast to the pen‐ and remote control‐like shape used before. Due to its size and shape it keeps the finger muscles in a relaxed medium contracted posture (both agonist and antagonist muscles in balance) which results in ergonomic handling. In order to further investigate this rather mouse‐like design, we gave the clay model to an industrial partner who constructed a three‐dimensional plastic prototype based on a rapid prototyping printer (see Figure 25).
Figure 24: A collection of design ideas for a new pointing device as inspiration for the redesign of the interactive laser pointer (just four representative models of over 10 created design concepts). The device prototypes were made by students and lecturers of the course “Interaction design for high‐ resolution displays” in winter term 2008/2009.
Figure 25: Proof‐of‐concept prototype (disassembled in the left figure, assembled on the left side of the right figure) of the selected mouse‐like clay model (at the very right). The clay model was converted into a digital CAD25 model and physically printed with ABS 26 material.
25
Computer‐aided design (CAD)
74
Design and evaluation of novel input devices and interaction techniques
The other clay model we selected for further investigation was an improvement of the earlier laser pointer versions which were stimulated by the pen and remote control concept. This clay model was designed by the author of this thesis based on experiences and insights gained in previous project work. The shape of this model has a narrow waist in terms of width and height in order to enable a comfortable grip (see Figure 26). Still both ends are large enough to accommodate the microcontroller, antennas and sensing technology. Moreover the edges are rounded to reduce pressure at the contact areas at the hand. In order to support both right‐ and left‐handed use, this shape was design symmetrical. In several discussions the ergonomic quality of taking and releasing the device (e.g., from a desktop) was considered resulting in a further design variant: the clay model was completely arched, offering space below its waist. Therefore the user was able to pick up the device directly without the need to reposition their fingers. This arched design was also chosen in order to improve the perceived affordance of picking up the device based on the visual analogy to an arched pot handle. In general, the basic intention was to provide a more slight and graceful design with organic curves and better ergonomic handling. In contrast to the weapon‐like prototype preceding it, this design was meant to associate with positive feelings and should lower physical as well as psychological thresholds for its usage.
Figure 26: Clay model of a new hardware design for the interactive laser pointer. The design is characterized by organic curves and a slight appearance. The upper figure illustrates the first straight version, whereas the lower figure presents the improved design providing easier device acquisition.
Version 4 With the help of the clay models and based on various discussions and informal interviews we decided to implement the curved device design. The mouse‐like clay model (see Figure 25) did not stimulate absolute pointing behaviour in mid‐air in contrast to the curved version (see Figure 26) which kept a basic pen‐ or laser pointer‐like shape. Moreover, the curved version also
26
Acrylonitrile Butadiene Styrene (ABS), a terpolymer of acrylonitrile, butadiene and styrene which can be used as base material for thermoplastic processing methods.
Designing Input Devices for LHRDs
75
facilitated direct writing on the display analogue to writing on blackboards. Technically, the curved version also provided better potential for wireless communication thanks to the larger size which ensured that the antenna is not covered by the hand or other body parts. Based on the clay model, a digital CAD model was made in order to explore its technical feasibility and to construct the detailed electronic and mechanical design (see Figure 27).
Figure 27: CAD models of the fourth generation interactive laser pointer, simulating different materials and surface treatments (designed in March 2009).
Modelling the laser pointer device in digital space also enabled us to explore the visual effect of various alternative materials and surface treatments such as brushed or varnished aluminium and diverse coloured plastics. In order to further support the slim, non‐technical design we choose black polyvinyl chloride (PVC) as a basic material. PVC provides a comfortable, smooth and warm haptic (PVC’s heat transfer coefficient brushed aluminium (
235
∙
0.16
∙
) in contrast to the formerly used
) and it is furthermore almost half of the weight with a density
of 1.4 g/cm³ (PVC) compared to 2.7 g/cm³ (aluminium). Moreover, PVC does not have to be specially treated in order to be corrosion‐resistant. This is an essential requirement when hundreds or thousands of users are touching the device during exhibitions over a longer period of time. Aluminium can be varnished or anodised in order to prevent oxidation; however this treatment only has an effect on the very thin surface layer. Thus, mechanical impacts such as scratches are very apparent. Furthermore, PVC provides more flexibility in positioning the antenna because of its lower influence on radio‐based communication as compared to metal‐ based materials. Transparent PVC material is also available which can be used to produce translucent inlays for the illumination of the physical buttons and the top of the device providing visual feedback. A final reason for why we chose PVC was that it is one of few plastic materials which can be treated with a CNC milling machine27 offering higher production efficiency and precision. A disadvantage compared to aluminium is the lower hardness of PVC. It also looks less valuable compared to anodised aluminium; however this can also be an advantage in terms of lowering the psychological threshold. Since most gaming devices are made with plastic materials, PVC replaces the serious look‐and‐feel of former aluminium based laser pointers with a more fun‐related, harmless appearance. 27
Computer Numerically Controlled (CNC) milling machine
76
Design and evaluation of novel input devices and interaction techniques
Figure 28: Initial clay model of the laser pointer (left) and the final device (right, built in October 2009).
Figure 29: Different perspectives on the interactive laser pointer of the fourth generation. Left: Illustration of the three axes measured by the inertial sensor (linear accelerometer).
The fourth generation of our interactive laser pointer was built in October 2009 and is the result of a three‐year iterative improvement of the device technology, its visual appearance and the ergonomic hardware design. The development was driven by rapid prototyping (virtually and physically), empirical testing, user feedback, real‐world applications and the effective cooperation between experts in different professions (e.g., electronics, mechanics, computer science and usability engineering). The final design provides all features of previous versions such as an infrared low‐power laser diode, physical buttons, a three‐dimensional accelerometer, and a mechanical vibrator. Moreover it provides fully functional, bidirectional wireless communication (serial data transmission protocol based on 868 ‐ 915 MHz radio frequency). The communication is provided by a pair of microcontrollers of which one is integrated in the head
Designing Input Devices for LHRDs
of the laser pointer and the other is embedded in a USB module which can be plugged in a standard PC running our software toolkit. Multiple interactive laser pointers can be used in parallel without introducing interferences since each microcontroller pair uses an individual wavelength band. Besides transmitting button states and accelerometer data, the bidirectional communication enables the particular control of the vibrator and the illumination of the physical buttons as well as the LEDs embedded below the translucent inlay at the top of the device. That facilitates interaction techniques such as a physical colour chooser in which each button represents a different colour available for selection and the currently selected colour is represented by the visual feedback given at the top. The wireless data transmission is performance‐optimized in order to reduce interaction lags and to offer high interaction speed as well as immediate feedback. In order to control the LEDs, vibrator motor, laser diode, accelerometer, data transmission mode, and power state, a single byte is sent via a specifically defined serial protocol (see following data type definitions). Bit Values
7 1
6 1
5 4 3 LED REGISTER NUMBER 100 = button left 011 = button centre 101 = button right 001 = two front ambient LEDs 010 = front centre LED
2 RED 0 = off 1 = on
1 GREEN 0 = off 1 = on
0 BLUE 0 = off 1 = on
Table 1: Definition of the data byte for setting the colour of the specified multicolour LED.
Bit Values
7 1
6 0
5 0/1
4 0/1
3 0/1
2 0/1
1 LASER 0 = off 1 = on
0 MOTOR 0 = off 1 = on
Table 2: Definition of the data byte for controlling the vibrator motor and the infrared laser diode.
Bit Values
7 0
6 0
5 0/1
4 0/1
3 0/1
2 TRANSMISSION MODE 0 = pull 1 = push
1 ACCELERO‐ METER 0 = off 1 = on
0 POWER MODUS 0 = active 1 = sleep
Table 3: Definition of the data byte for setting the data transmission mode (continuous or on request), the accelerometer state, and the power mode. Pressing the centre button on the laser pointer reactivates the microcontroller from power‐saving sleep mode.
Bit Values 1st byte 2nd 3rd 4th 5th
7
6 5 4 DEVICE IDENTIFICATION NUMBER
3
2 1 0 BUTTON‐ BUTTON‐ BUTTON0‐ RIGHT LEFT CENTER 0 = up 0 = up 0 = up 1 = down 1 = down 1 = down ACCELEROMETER VALUE Z‐AXIS ACCELEROMETER VALUE X‐AXIS ACCELEROMETER VALUE Y‐AXIS BATTERY VOLTAGE
Table 4: Definition of the data byte(s) giving feedback about button states and optionally (if accelerometer is activated) also about the acceleration values on the three axes (see axis orientation in Figure 29, left) as well as the current battery voltage. This feedback is sent continuously (push mode) or alternatively on request (pull mode) any time a byte is received at the laser pointer’s microcontroller.
77
78
Design and evaluation of novel input devices and interaction techniques
In order to bundle all this multimodal input and output technology as well as the embedded microcontroller, batteries, and antenna within this small and highly curved device case, a sophisticated construction for the arrangement of the components and the multi‐layer circuit boards were needed. In close cooperation with mechanics and electronics experts of the “Wissenschaftlichen Werkstätten” of the University of Konstanz, we constructed the hardware design with respect to following requirements (discussed together with our final solutions):
Device shape: the iteratively developed curved design of the hardware case should be preserved despite technical complexity. The electronics parts were distributed on three circuit boards connected by ribbon cables enabling the tight arrangement of the boards adjacent to the batteries, below the upper surface for button support, and at the top of the device to provide visual feedback under the translucent inlay as well as to offer an optimal position for the antenna (see Figure 31). Weight distribution: the centre of gravity should be in the hand (second half of the device length) in order to enable comfortable handling. This is achieved by positioning the heavy two AA batteries one after another at the tail of the device (see Figure 30). Wireless communication quality: the antenna should have maximum distance to any shielding material. This is achieved by arranging the antenna directly at the top of the laser pointer even before the laser diode (which has a metallic case). The antenna is therefore given the largest possible distance to the hand of the user, to the user’s body and to other parts of the device. Button arrangement: the three buttons should be easily accessible, should provide good tactile feedback, and should support the visual design concept. We arranged the buttons at the first fourth of the device length which is a good position for ergonomic interaction with the thumb. Since it is easier to adduct the thumb from this comfortable position than to abduct, we arranged the third (user programmable) button behind the “left” and “right” buttons which are also more often used than the third one. In order to support blind interaction, we provide passive tactile feedback of the buttons based on their physical design. They stick out at the top of the device thanks to their slightly higher dimensions and the curved design of the device case. Moreover the surfaces of the buttons are polished in contrast to the grooved surface of the device case. In order to communicate the differences between the left/right and the third button, we gave them unique forms (trapezoid vs. circle) and arrangements (left, right, centre). The visual form resulting of the button shape and their arrangement is very similar to the shape of the translucent inlay at the top of the device. Thus the visual design concept is applied consistently (see Figure 29). Active tactile feedback: the tactile feedback provided by the vibrating motor should be perceivable. We therefore positioned the vibrator closed to the button module in order to transmit the vibrations to the buttons as well. If tactile feedback is given by the vibrating motor when a button was successfully pressed, the user has the impression that the physical button is vibrating. Thus we can provide direct feedback at the location where the interaction takes place. To ensure that the tactile feedback is also perceived if the user does not touch a button at this moment, the vibrating motor is directly mounted to the PVC case which transmits the vibration also to user’s hand (see Figure 30).
Designing Input Devices for LHRDs
79
Easy maintenance: the interactive laser pointer should be easy to maintain. We choose to use standard batteries which are inexpensive and available almost everywhere. In order to prevent vandalism the batteries are covered and locked by a single screw. As an alternative to battery replacement, we also provide a USB charging cable which can be plugged in any powered USB port without the need of a specific driver (see Figure 32). At the side of the laser pointer, the charging cable is connected to a lockable, tight‐ connection cable port which enables permanent power connection, e.g., for the utilization of the laser pointer in exhibitions. Therefore, there is no need for the replacement of the batteries and the tight‐connection port prevents damage caused by tension. The charging cable is very flexible and available in different lengths. If other electronic parts of the laser pointer have to be repaired, they are accessible by removing the maintenance cover at the bottom of the device which is locked by a single screw. The circuit boards are fixed by screws and connected via plugged ribbon cables. Thus, all parts of the device are easily accessible and replaceable within minutes if needed.
Figure 30: CAD model of the milled PVC main case showing the battery compartment and the mountings for the circuit boards, buttons, power port, and vibrator.
80
Design and evaluation of novel input devices and interaction techniques
Figure 31: Circuit boards of the interactive laser pointer (individually scaled for better visibility). Upper left: button module with LED illumination and inertia sensor. Upper right: microcontroller board with antenna, laser diode connection and all input/output signal conductors. Bottom: main board with power and load management as well as vibrator connection. See Appendix A, p. 157, for further layouts.
Figure 32: Interactive laser pointer with open battery compartment, released maintenance cover, rechargeable batteries, and USB charging cable. The covers can be slid in from the corresponding side (head or tail) and fixed with the screw. Thus the plain covers accommodate their form to the arched shape of the main case.
Designing Input Devices for LHRDs
3.3.3.3 Interactive Laser Pointer @ Design Space Classification For the sake of clarity and completeness, we describe in the following our final design of the interactive laser pointer along with the design space classification introduced in section 3.2 (p. 41). Moreover, this systematic description enables direct comparison with future versions and other solutions. Since the interactive laser pointer integrates three different input sensors which have to be considered specifically, we enumerate them as follows. Input sensors of the interactive laser pointer: (1) Camera‐based tracking of the optical reflection caused by the infrared laser diode (2) Inertial sensing based on the three‐dimensional accelerometer (3) Physical buttons INPUT DEVICE PROPERTIES ‐ Physical property sensed
‐ Type of motion
‐ Continuous vs. discrete input
‐ Degree of freedom
‐ Agent of control / input modality
‐ Direct vs. indirect control
‐ Feedback / output modality
Interactive laser pointer (fourth generation) (1) Position of the reflection of the infrared laser diode (2) Motion and orientation of the laser pointer device based on the accelerometer (3) Position of the buttons (up/down) (1) Linear movement (2) Linear and angular movement (3) Linear movement (1) Continuous input (2) Continuous input (3) Discrete input (1) Three integral dimensions (2) Three integral dimensions for motion and two integral dimensions for orientation (no valid measure for the orientation with respect to the gravity axis ) (3) Three separable dimensions (1) Hand / arm, active input mode (2) Hand / arm, active or passive input mode (3) Finger, active input mode The device can be utilized directly on the display, but also from a distant position. The device is a physical intermediary. The triggered action and visual feedback can be directly related to the input (dependent on the application design). Tactile & kinaesthetic feedback: ‐ vibrating motor (active) ‐ physical button design, e.g., shape, displacement distance, displacement force (passive) ‐ pen‐based design of laser pointer device (passive) Visual feedback: ‐ illumination of all three buttons (active) ‐ ambient and centre LEDs at the head (active) Acoustic feedback: ‐ mechanical click sound when pressing the buttons (passive) ‐ no active sound feedback at the device, but
81
82
Design and evaluation of novel input devices and interaction techniques
‐ Multi‐device, multi‐user support
INPUT DEVICE PARAMETERS ‐ Resolution
‐ Sampling rate
‐ Lag
‐ Transfer function
‐ Hardware design
‐ Naturalness
possible in combination with a external sound system e.g., for providing surround sound Thanks to the utilized radio‐frequency band, communication protocol, and microcontrollers, interference with other input/output devices is almost impossible. Dependent on the implemented interaction technique, the input of the interactive laser pointer replaces or complements current standard input devices. Multiple laser pointers can be used in parallel: the wireless data communication works without interference and the number of optically tracked laser pointer reflections is only limited by the tracking resolution and the size of the display. However, the identification of an individual user has to be done on the application layer. (1) dependent on number and type of cameras and lenses used and distance to the projection surface (2) about 0.03 g resolution (3) 1 (just one sensor at each button) (1) between 80 and 120 frames per second (2) analogue sensor, continuous measurement (3) analogue sensor, continuous measurement (1) about 6.7 ms in average for image acquisition and additional 10 ms for image analysis (2) about 8.3 ms in average caused by data transmission (3) about 8.3 ms in average caused by data transmission (1) position‐to‐position (dependent on interaction technique) (2) velocity‐to‐position (dependent on interaction technique) (3) position‐to‐position (dependent on interaction technique) Pen‐ and remote controller‐based hardware metaphor, milled PVC case, grooved surface, curved design, black case with translucent illuminated inlay and white back‐ illuminated buttons, removable batteries, maintenance cover, power port with suitable USB charging cable Dimensions: width total: 3.4 cm (min. body width: 2.5 cm) height total: 3.4 cm (body height: 2.3 cm) length total: 19.2 cm Weight: about 160 grams (dependent on battery type) The well‐known laser pointer is used not merely as a presentation aid for accentuation purposes but additionally to control the cursor or generally the entire user interface. Users typically utilize a laser pointer as a natural extension of their hand, so the cognitive load for interaction is imperceptibly low since pointing is a fundamental human gesture. The mental association of physical laser pointer and virtual cursor movement is easy and is processed subconsciously.
Designing Input Devices for LHRDs
‐ Motor space / footprint
‐ Mobility
(1) Since the reflection of the laser diode is tracked, users can point to almost any pixel on a LHRD just by turning it without the need of moving the device to another location (e.g., as known from the mouse). (2) Dependent on the utilized interaction technique. (3) Only the button is pressed; the device can keep its position and orientation. (1) Entire room, as long as the device points at the display and a reflection of the laser diode is trackable. (2) Only limited by the wireless communication range (about 20 meters in buildings and more than 50 meters with unobstructed line‐of‐sight) (3) Only limited by the wireless communication range (about 20 meters in buildings and more than 50 meters with unobstructed line‐of‐sight)
Table 5: Specification of our interactive laser pointer (fourth generation) along the design space classification introduced in section 3.2, p. 41.
The design space classification also considers usability measures which describe the resulting qualities of the selected design. In the following, we will discuss a controlled experiment investigating the effectiveness and efficiency of using the interactive laser pointer and complement these quantitative findings with practical experiences and more qualitative findings gained in the course of the artistic installation Globorama (see 0, p. 87). 3.3.4
Evaluation
In order to assess the general feasibility of the Laser Pointer Interaction for LHRDs, an experiment on the basis of the ISO standard 9241‐9 with the first version of our interactive laser pointer was already conducted in February 2007 on the Powerwall of the University of Konstanz. The primary goal of this study was to compare the interactive laser pointer to the mouse as the standard input device. Existing studies that have been carried out with normal projection displays suggest that interaction with the mouse is more precise and faster – with the drawback that a stationary surface is needed for its use. With the laser pointer, however, participants can move freely in front of the display. Apart from comparing the two devices, the effect of eye‐to‐ display distance was also under scrutiny. Peck [2001] examined the deviation when pointing at a fixed target with a regular red laser pointer from a distance of 1.5 m and 3 m. Similarly, Myers et al. [2002] examined 1.5 m, 3 m, and 4.5 m. The results of both studies underline the intuitive assumption that the laser pointer’s performance deteriorates at larger distances due to the effects of natural hand tremor. The experiment was based on the unidirectional tapping task (Fitts’ tapping task) for evaluating the “efficiency and effectiveness of existing or new input devices” as described in ISO 9241‐9 (cp. [Douglas et al. 1999]). The unidirectional tapping task is a serial point‐and‐select task with users controlling the on‐screen pointer to alternately click on two targets of width W that are aligned horizontally at a distance (amplitude) A. Participants were asked to alternately select the targets as quickly and precisely as possible (see Figure 33). These types of tests were pioneered by Fitts ([Fitts 1954], [Fitts & Peterson 1964]) and have been applied in several evaluation studies concerning input devices (cp. [MacKenzie 1991]).
83
84
Design and evaluation of novel input devices and interaction techniques
3.3.4.1 Participants and Design Sixteen participants (8 female, 8 male) aged 19‐30 were recruited via different mailing lists at the University of Konstanz. Most of the participants were students at the university; none were students from the computer science department. The test was designed as a 2×2 within‐subjects design with the factors device (mouse and laser pointer) and distance (3 m and 6 m) appearing in combination in the different conditions. The order of these four conditions was counterbalanced across participants, using a Latin square design. The dependent measures included movement time MT in seconds, error rate Err, as well as the effective throughput or effective index of performance IPe in Bits/s. The latter represents one of the benchmarks for comparing input devices and is one of the most widely used measures for the appraisal of input device performance (a detailed discussion can be found in [MacKenzie 1991]). The calculations of effective width (We), effective index of difficulty (IDe), and effective throughput were carried out as suggested by ISO 9241‐9 or [Soukoreff & MacKenzie 2004] respectively. In the experiment, targets having width W of either 80 pixels (9 cm) or 140 pixels (15 cm) and a centre‐ to‐centre distance A of 550 pixels (62 cm), 1350 pixels (151 cm) or 3800 pixels (426 cm) were used, corresponding to levels of difficulty (index of difficulty, ID) between 2.3 Bits (easy), and 5.6 Bits (hard). The index represents both the width W and distance A in a single value. The configurations provided target stimuli that covered the central, proximal, and peripheral space of the Powerwall display. 15 trials had to be performed for each of the 2 (A) x 3 (W) target configurations. A trial was considered to consist of the movement towards the target, and its subsequent selection via a click. Hence, a block was complete after 2 x 3 x 15 clicks (as a minimum) plus one additional click for each configuration to select the first target (96 clicks in total). The order of the W‐A configurations was random for every block and participant.
Figure 33: Unidirectional Tapping Task with width W and amplitude A based on ISO standard 9241‐9.
3.3.4.2 Apparatus & Procedure The experiments were conducted on the premises of the Powerwall facility in the University of Konstanz. Participants stood in front of the 5.20 × 2.15 m display during all of the experimental conditions. A Logitech MX Laser Cordless Mouse was employed for the mouse conditions. The pointer speed was kept at a medium level to let the movement range cover the complete screen area without clutching. The level remained constant throughout the experiment. A 1.10 m high lecture desk provided the stationary rest for the mouse – this is the current standard practice for interacting with the display. The custom‐built laser pointer (version 1, see section 3.3.3.2, p.68) could be handled freely. The interaction (click events and pointer movement) was recorded by a
Designing Input Devices for LHRDs
85
software suite specifically developed for this evaluation and that also provided all the task stimuli (targets to click). It ran on the main computer connected to the Powerwall display with the maximum resolution of 4640 × 1920 pixels. The standard pointer of Microsoft Windows Server 2003 was used. Demographic data and preference ratings (for device choice) were obtained with the help of pre‐ and post‐test questionnaires respectively. At the beginning of each session the participant was welcomed in the reception area of the facility and given a short overview of the procedure. After reading a short written introduction and filling out the pre‐test questionnaire, the participant was given a description and concurrent demonstration of the test. It was emphasized that the targets had to be selected “as quickly and accurately as possible” (see Appendix B, p. 158, for more details). The participant was then asked to stand at a distance of 3 m or 6 m centrally in front of the display. In order to allow her/him to become accustomed to the device and distance, every test condition began with five blocks of a 64‐click task that was not considered for analysis. Hence, in total each participant had to perform at least 1664 clicks: for each of the four conditions 64 x 5 clicks for training plus 96 clicks for the task. 3.3.4.3 Results Of the 5760 unidirectional trials, 18 were identified as outliers due to accidental double clicks or other disturbances in a regular trial and were removed from the analysis. As expected, the performance of the mouse was generally better than the performance of the laser pointer (see Figure 34). At a distance of 3 m, a mean IPe of 3.52 Bits/s for the laser pointer and 3.96 Bits/s for the mouse was measured. The error rate (Err) at 3 m was 8% for the mouse and 14% for the laser pointer. Average movement times of 954 ms for the mouse and 1086 ms for the laser pointer were obtained. Significant effects of the factor device were found for all measures IPe (F1,15 = 30.570, p