IBSBI 2014, October 16 -18, 2014, Athens, Greece
DESIGN AND IMPLEMENTATION OF A MULTI-SENSOR MONITORING SYSTEM FOR STRUCTURAL INTEGRITY ASSESSMENT: The Case of Attiki Odos, Pallini Cable-Stayed Bridge Vassilis Gikas1, Phaedon Karydakis2, George Piniotis3, Thanassis Mpimis4, Fanis Papadimitriou5 and Alexandros Panagakis6 1,3,4
National Technical University of Athens, School of Rural and Surveying Engineering, Greece 2 National Technical University of Athens, School of Civil Engineering, Greece 5,6 Attikes Diadromes SA, Attica Tollway Operations Authority, Greece e-mail:
[email protected],
[email protected],
[email protected],
[email protected],
[email protected],
[email protected]
ABSTRACT: This article presents the design and implementation of a multisensor geodetic monitoring system used to record the response and evaluate the structural integrity of a small-sized, cable-stayed bridge for a number of static & dynamic load scenarios and ambient vibration tests. Preliminary data analysis revealed the main dynamic characteristics of the bridge, whereas in this paper emphasis is given in the dynamic behavior of stay cables. KEY WORDS: Bridge load testing; vibration monitoring; OMA; microwave interferometry; digital image correlation.
1
INTRODUCTION
Static and dynamic load tests have traditionally been used in order to verify the actual structural behavior of bridges compared with those predicted by analytical models. Also, structural performance examination of bridges includes ambient vibration tests, which are used to provide critical information about the behavior of a bridge due to operational conditions that relate mainly to vehicular traffic and variations in environmental parameters such as wind load and temperature [1, 2]. In this regard, this article presents the design, deployment and implementation of a multi-sensor system that was realized to perform a series of non-destructive tests of a single-span, cable-stayed bridge. As a whole, the goals and objectives of this work is twofold. Firstly, to perform a structural integrity verification study of the test bridge. This goal aims to obtain a better understanding of the bridge response to static and dynamic loads and to produce a “foot-print” of the current condition of the structure that can be used for future
2
Proceedings IBSBI 2014
condition assessment in relation to its present status. Secondly, to generate a library of “reference datasets” for use in research related to Structural Health Monitoring (SHM) of bridges. Specifically, it is envisioned that the quality, the volume, the spatial distribution and the great variety of data collected would allow research to be undertaken in many areas, including the assessment of the potential of individual sensors for SHM, optimal sensor placement studies, data fusion techniques for bridge monitoring as well as damage detection modeling [3]. In order to accommodate the second objective, provision was taken so that: (a) a great number o heterogeneous multi-sensor systems was used, (b) a complete as possible coverage of all structural elements (i.e. deck, cables and pylons) was attained during field campaigns and, (c) various Non-Destructive Testing (NDT) scenarios were implemented.
2 TESTING SCENARIOS AND MONITORING METHODS 2.1 Static and Dynamic Tests In this study two types of deformation monitoring scenarios are considered. Static load tests aim to verify the structural integrity of the bridge in relation to the assumptions made at a design stage. Such tests are associated with the analysis of the geometry and the materials of the structure, and conclude to an assessment and (potentially) calibration of the Finite Element Model (FEM) of the structure. In this study, in order to realize the static tests a three-axle truck, weighting 300 kN (total mass of 30 metric tons) was used. Subsequently, for a number of predefined truck locations, the deck settlements, the cable vibrations and the pylon movements were measured, analyzed and compared with the corresponding values of the FEM analyses. Dynamic tests are carried out to perform a modal analysis to identify the main dynamic properties of the bridge by applying well established output-only modal identification methods [4]. In this study, dynamic tests involve the same truck used for static testing being driven in the centre of the deck at constant speed (10 km/h, 20 km/h and 40 km/h). Also, testing involved truck runs at constant speed with a road bump of 30 mm as well as emergency brake tests. These tests, in addition to information on the natural frequencies and damping ratios of the bridge, they provide a picture of the variation in the dynamic amplification factor. Moreover, they are used in order to assist in the excitation of cables in order to compute their dynamic properties. Also, in this study a number of ambient vibration tests of variable time length for the three structural elements (deck, pylons and cables) of the bridge were undertaken.
2.2 Monitoring Methods and Systems As already stated, in order to generate a pool of “benchmark” bridge monitoring datasets a variety of heterogeneous sensor systems was employed. These systems feature different operating principles, produce observables of various
Piniotis et al.
3
types, whereas, each system has its own advantages and limitations. However, in order to facilitate comparisons between sensors and for research concerning sensor fusion, particular attention was paid so that all monitoring systems were synchronized using the GPS PPS time stamp. Specifically, six types of sensors used for data collection as follows: Precise Leveling (PL): A precise level (Leica DNA03; ±0.3 mm/km @ 1σ) was used to measure the vertical deflections of the deck along three lines (road axis and sidewalks) during the static load tests. Digital Inclinometers (DIN): Digital inclination sensors (Leica Nivel 220) were placed at five locations along one of the sidewalks of the deck to measure the deflection of vertical in two perpendicular directions. These sensors were located at points of expected maximum change in deck curvature. The measurements produced will be processed to produce deck settlements that, ultimately, shall allow comparisons with precise leveling. Ground-Based Microwave Intreferometry (GBMI): The GBMI technique was used to monitor deck settlements and in-plane cable vibrations during the static, dynamic and ambient vibration tests. The operating principle of the method relies on the computation of scattering object displacements using the phase information obtained by a microwave radar sensor from repeated electromagnetic pulse transmissions [5]. In this study, the IDS IBIS-S system used consisting of the radar module, a control PC and a power supply unit. The system operates at a maximum frequency 200 Hz and provides displacement accuracy better than 0.1 mm. Digital Image Correlation (DIC): Video-based measurements were used to compute point displacements in two directions [6]. The iMETRUM Video Gauge system used to produce 2D vertical displacements for a number of specifically designed (ring type and tape) targets placed on the bridge deck, the pylon and the cables. Original displacements were computed on the video frames with an accuracy of at least 0.1 pixels, whereas actual displacements are obtained after a scale factor and relevant corrections have been applied. Accelerometers (ACC): Two types of accelerometers (high sensitivity piezobeam and integrated K-BEAM) were used to record the deck and cable response of the bridge [7, 8, 9]. These units were operated by personnel of the System Dynamics Laboratory of the University of Thessaly in the frame of collaboration with the project participants from the National University of Athens. Integrated GNSS / Inertial system (GNSS/INS): A high accuracy integrated GNSS/INS system was fixed on the truck vehicle to record continuously its position and kinematics. This information is valuable for bridge-vehicle interaction studies planned for the future as well as for documentation purposes of the tests.
4
Proceedings IBSBI 2014
In addition to the monitoring systems used in this study, environmental parameters were digitally recorded, whereas field operations were video recorded for documentation purposes.
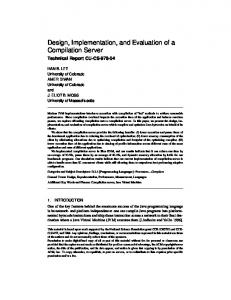
3 BRIDGE DESCRIPTION AND SENSOR DISTRIBUTION 3.1 The Bridge The bridge under test is a roadway, single-span, cable-stayed bridge that overpasses “Attiki Odos” tollway which connects the metropolis of Athens to its international airport. The bridge has a suspended span 58.3 m long, variable width between 13.4 m and 18.5 m and pylon height 18.5 m. It consists of steelcomposite deck with girder and floor beams with concrete slab of variable thickness 0.20 m to 0.40 m. The bridge features two Λ-shaped pylons, in which their stretched and distressed legs are made of prestressed concrete and of steel respectively (Fig. 1). The two pylons are connected near the top. The deck is suspended by three cables from each of the two pylons.
Figure 1. Structural elements of Pallini cable-stayed bridge (Attikes Diadromes SA)
3.2 Monitoring Setup Fig. 2 shows the distribution of all monitoring sensors used as well as the targets and other observation points considered during the field trials. Specifically, one GBMI unit and two DIC cameras were used at a time. Therefore, most of the tests were repeated in order to collect observations from all station points shown in Fig. 2. Also, this plot shows the six truck vehicle locations considered during the static tests. Specifically, in order to maximize the effect of truck loading on the structure the vehicle was placed asymmetrically, by the sidewalk curbs, at the cross sections passing the six cable anchor points. Table 1 provides a classification of the systems used to monitor the bridge elements (deck, pylon and cables) in relation to the test types (static, dynamic and ambient) adopted. Particularly, for the static tests that required several hours to complete is critical that variations in environmental
Piniotis et al.
5
conditions are as small as possible. Therefore, all tests were performed night time. video camera
GBMI
camera
L4
L5
L6
L1
L2
L3
level
level camera thermometer
GBMI Accelerometer
GBMI deck target
camera
Digital inclinometer
GBMI cable target
Leveling point
DIC target
GPS/INS
Figure 2. Monitoring systems and sensor distribution Table 1. Use of monitoring systems for the three test types; PL: Precise Levelling, DIN: Digital Inclinometers, GBMI: Ground-Based Radar Interferometry, ACC: ACCelerometers, DIC: Digital Image Correlation, T: Temperature element →
DECK
CABLES
PYLON
TRUCK
↓mode PL DIN GBMI ACC DIC GBMI ACC DIC GBMI DIC GPS/INS
4
VIDEO
DYNAMIC
AMBIENT
STATIC
OTHER T
BRIDGE DECK AND CABLE RESPONSE – FIRST RESULTS
At the time of writing this paper (July 2014) fieldwork has been completed, whereas data analysis is confined in selected sensor datasets, including some preliminary modal analyses tests. These analyses aim to assist in the design of various FEM sensitivity tests to study the structural integrity of the bridge. In this paper only some preliminary results obtained for the deck and cables response using the GBMI system for the static and dynamic tests will be discussed. Firstly, the modal identification of the bridge deck using the displacements determined from Digital Image Corellation (DIC) ambient measurements revealed the first bending mode at 1.22 Hz, the first torsional mode at 2.13 Hz and the second bending mode at 2.71 Hz. This task was achieved using the
6
Proceedings IBSBI 2014
Frequency Domain Decomposition (FDD), which is a well known output-only modal identification method. Also, preliminary analysis of the available data indicated higher modes, not reported here as further investigation is still required. Fig.3 shows the GBMI derived displacements as follows: (a) the deck settlements obtained by the anchor point of the long cable and, (b) the cable movements obtained perpendicular to the cable axis at a distance about 1/3 of the cable length measured from its top anchor point. As expected, deck settlements are becoming more significant for the truck locations which are closer to the target points observed. Notably, the minimum and maximum values are obtained for load scenarios L0 and L3 respectively.
L0
L0 L1 L4
L1 L2
L0 L5
L6
L4 L2
L0 L5
L6
L3
L3
GBMI
Figure 3. GBMI derived displacements at deck and long cable
Fig. 4 shows the PSD plot obtained from the radar subset that contains the displacements occurred for the long cable, for the case of an empty bridge (L0). The first three peaks at 1.24, 2.16 and 2.76 Hz (marked with squares) are the cable’s response to the bridge deck’s stimulation, since they have been identified as deck modes. The plot also exhibits two dominant peaks at 2.86 and 3.14 Hz ((marked with circles). The latter peak appears to be the first modal frequency of the cable (local mode), whereas the first peak is attributed to the deck-cables interaction (global mode). Notably, this peak value (2.86 Hz) is evident (marked with circle) in the PSD plot of the radar data acquired from the long cable for the case of an empty bridge (L0) (Fig. 5). Finally, Fig. 4 exhibits the peaks at 6.24, 9.38, 12.52, 15.7, 18.46 and 21.38 Hz (marked with triangles) that appear to be the next six modal frequencies of the cable. It is worth mentioning that the values of all the aforementioned
Piniotis et al.
7
frequencies are very close to the integer multiples of the fundamental cable frequency (3.14 Hz), which implies that the dynamics of the stay-cable can be described by the taut string model.
Figure 4. PSD of the long cable radar data for the Figure 5. PSD of the deck target radar data for th L0 bridge loading scenario (log scale) L0 bridge loading scenario (log scale)
The global and local character of the frequency values 2.86 Hz and 3.14 Hz respectively are also verified in Fig. 6, which depicts the Short Time Fourier Transform (STFT) plot of the long cable radar data derived for all bridge test loading scenarios. From this plot it is evident that every time the truck brakes to reach the predetermined location of each loading scenario (L1, …, L6), the frequency at 2.86 Hz is uniformly stimulated for all scenarios (circle marks in Fig.6). On the contrary, the level of stimulation of the frequency value 3.14 Hz is strongly depended on the truck position along the bridge deck, exhibiting its greatest value for the truck position that is closest to the long cable.
3.14 Hz L1
L2 L3 L4 L5
L6
2.86 Hz
Figure 6. Short Time Fourier Transform (STFT) Figure 7. PSD of the long cable radar data for the plot of the long cable radar data for all the bridge L3 bridge loading scenario (log scale) loading scenarios time period
Fig. 7 shows the PSD plot obtained from the radar displacements measured on the long cable for the time span of the truck vehicle standing next to that cablet (L3). As expected, the dominant peak in this plot is 3.18 Hz (marked with circle), which corresponds to the first modal frequency of the cable (3.14Hz) that exhibits a shift as a result of the cable stretching due to truck loading.
8
Proceedings IBSBI 2014
Moreover, the peaks at 6.36, 9.54, 12.72, 15.88, 19.08, 22.24 and 24.46 Hz (marked with triangles) refer to the next seven modal frequencies of the cable. As part of an undergoing study, the evaluation of tension forces of staycables and their changes (using their modal frequencies in the application of the taut string model) for the unloaded and loaded bridge would yield critical information regarding the structural integrity of the bridge. At a next stage, the findings discussed in this paper will be further evaluated and used to assist in the assessment of the bridge condition and to the updating of FE models.
5
REMARKS AND FUTURE WORK
This paper presented the design and implementation of a multi-sensor monitoring system used to record the response of a small size, cable-stayed bridge for a complete set of static and dynamic load scenarios and ambient vibration tests. Currently, the structural integrity of the bridge is being investigated through a number of sensitivity tests on selected parts of the monitoring data. As following steps, it is planned to undertake a thorough evaluation of the performance of the various sensors involved in the tests through independent checks. Such cross-comparisons would allow a comprehensive characterization of their potential under real operating conditions that, by extension, would contribute in optimal sensor placement studies and sensor fusion techniques.
REFERENCES [1] Batel, M, “Operational Modal Analysis-Another Way of Doing Modal Testing,” Sound and Vibration, August, 2002. [2] Gikas, V, Karydakis, P, Mpimis, A, Piniotis, G, Rodopoulos, J, “Structural Integrity Verification of a Cable-stayed Footbridge Based on Conventional and Non-Conventional Geodetic Data”, 2nd Joint Int. Symp.on Deformation Measurements, Nottingham, Sept. 9-10, 2013. [3] Papadimitriou, C, Fritzen, C-P, Kraemer, P and Ntotsios, E, “Fatigue Predictions in Entire Body of Metallic Structures from a Limited Number of Vibration Sensors Using Kalman Filtering”, Structural Control and Health Monitoring, 2010. [4] Cunha, A, Caetano, E, Magalhaes, F and Moutinho, C, “From input-output to output only modal identification of civil engineering structures,” SAMCO final report, 2006. [5] Gikas, V, “Ambient Vibration Monitoring of Slender Structures by Microwave Interferometer Remote Sensing”, Journal of Applied Geodesy, Vol. 6, No. 3-4, pp. 167-176, 2012. [6] McCormick, N, Lord, J, “Digital image correlation for structural measurements”, Proc. of the Institution of Civil Engineers, Civil Engineering 165, Issue CE4, pp. 185-190, 2012. [7] Moschas, F, Stiros, S, “Measurement of the Dynamic Displacements and of the Modal Frequencies of A Short-Span Pedestrian Bridge Using GPS and an Accelerometer”, Engineering Structures, Vol. 33, No. 1, 2011. [8] Kaloop, M, R, Li, H, “Tower Bridge Movement Analysis with GPS and Accelerometer Techniques: Case Study Yonghe Tower Bridge”, Information Technology Journal, Vol. 8, No. 8, pp. 1213-1220, 2009. [9] Kaloop, M, R, Sayed, M, A, Kim, D, Kim, E, “Movement Identification Model of Port Container Based on Structural Health Monitoring System”, Structural Engineering and Mechanics, Vol. 50, No. 1, pp. 105-119, 2014.