Design and implementation of a voluntary collective earthquake insurance policy to cover low-income homeowners in a developing country Mabel C. Marulanda1, Omar D. Cardona2, Miguel G. Mora3 and Alex H. Barbat4
Abstract. Understanding and evaluating disaster risk due to natural hazard events such as earthquakes creates powerful incentives for countries to develop planning options and tools to reduce potential damages. The use of models for earthquake risk evaluation allows obtaining outputs such as the loss exceedance curve, the expected annual loss and the probable maximum loss, which are probabilistic metrics useful for risk analyses, for designing strategies for risk reduction and mitigation, for emergency response strategies and for risk financing. This article presents, based on probabilistic risk models, the design and implementation of a risk transfer instrument to cover the private buildings of the city of Manizales, Colombia. This voluntary collective instrument provides financial protection to both, the estate-tax payers and the low-income homeowners through a cross subsidy strategy; besides, it promotes not only the insurance culture but also the solidarity of the community. The city administration and the insurance industry are promoting this program using the mechanism of the property-tax payment. This collective insurance helps the government to access key resources for low-income householders recovery and improve disaster risk management at local level. Keywords: Seismic risk insurance instruments, earthquake risk model, probable maximum loss, expected annual loss, risk premium, cross-subsidy strategy
1
INTRODUCTION
Social, environmental and economic sustainability depend not only on the identification of risk conditions but also on planning measures and implementing development activities that allow reducing possible future losses of society. Thus, the level of risk is directly related to the development and the capacity to intervene the existing risk. Sustainable development means actions at a short, medium and long term that focus on a prevention culture construction. Nevertheless, this is not an easy task because the costs of prevention 1
Researcher Centre Internacional de Mètodes Numèrics en Enginyeria (CIMNE). Universidad Politécnica de Cataluña. Campus Norte. C/Gran Capitán sn Mod. C1, 08034, Barcelona, Spain.
[email protected] 2 Professor, Universidad Nacional de Colombia. Sede Manizales. IDEA, Cra 27 No.64-60. Manizales, Colombia.
[email protected] 3 Researcher, Centre Internacional de Mètodes Numèrics en Enginyeria (CIMNE). Universidad Politécnica de Cataluña. Campus Norte. C/Gran Capitán sn Mod. C1, 08034, Barcelona, Spain.
[email protected] 4 Professor Centre Internacional de Mètodes Numèrics en Enginyeria (CIMNE). Universidad Politécnica de Cataluña. Campus Norte. C/Gran Capitán sn Mod. C1, 08034, Barcelona, Spain.
[email protected]
Nat Hazards (2014) 74:2071–2088 DOI 10.1007/s11069-014-1291-4
1
have to be paid in the present and its benefits, which are not tangible, lie in a distant future. The benefits are the disaster that did not happen, as was pointed out by Kofi Annan, UN General Secretary, in 1999. In addition, individuals faced with the possibility of a catastrophic loss tend to ignore the event until it occurs. Usually, prior to a catastrophe, individuals underestimate the chances of such a disaster occurring (Marulanda et al., 2008). Risk management is a fundamental development strategy that considers four principal policies: risk identification (risk assessment, risk communication and awareness), risk reduction (prevention and mitigation), disaster management (emergency response, rehabilitation and recovery) and risk financing (retention and transfer) (Birkmann et al., 2013). One of the key strategic activities of disaster risk management is the risk assessment, which requires the use of reliable methodologies that allow an adequate probabilistic calculation of losses in the exposed elements due to the occurrence of extreme events. The results obtained by using models of catastrophe risk assessment make feasible determining the potential deficit in the case an extreme event occurs. Catastrophe risk models –based on probabilistic metrics such as the Probable Maximum Loss and the Average Annual Loss– are used to estimate, sometimes building by building, the losses of different exposed elements portfolios. Usually, these kind of evaluations have been performed by private financial markets; nevertheless, at present, it is understood that estimations and quantification of potential losses in a given exposure time are of interest not only for private insurers, reinsurers and investors, but also for governments since the budget for both the emergency response and the recovery and reconstruction could mean a fiscal exposure and a non-explicit contingent liability for governments at city and country levels (Pollner, 2001; Andersen, 2002). In addition, contingency losses estimation provides information and permits setting out ex ante strategies for reducing or financing them (Marulanda et al., 2008; 2010; Cardona and Marulanda, 2010; 2010). Assessment of potential losses allows both the consideration of budget allocation for structural retrofitting in order to reduce damages and the implementation of an effective financial protection strategy to provide loss coverage of public infrastructure and private buildings, to protect thus government resources and to safeguard socioeconomic development. In summary, to achieve a greater awareness, security culture and economic prosperity, the financial protection must be a permanent and long term policy (Freeman et al., 2003). Some government catastrophe schemes have been proposed around the world, some of them being implemented. A publication made by the Consorcio de Compensación de Seguros in Spain (Consorseguros, 2008) provides a detailed review of those schemes existent worldwide. One of the most known earthquake insurance scheme is the Turkish Catastrophe Insurance Pool that was launched in 2000 and it became the first catastrophe insurance program in a middle-income country. This insurance focuses on the registered urban dwellings (middle-income homeowners) while the rural settlements (low-income homeowners), which are excluded from this program, are financially supported by the government (Gurenko et al., 2006). Other existent initiatives are the disaster microinsurance meant to providing low-income households and businesses with easily accessible and affordable insurance scheme. Mechler et al. (2006) present a background of the disaster microinsurance and an overview of this kind of scheme and of its characteristics.
2
It is important to remember that insurance or, in general, risk financing strategies, are not mitigation measures strictly speaking, because they do not reduce damage, and its objective is to cover economic losses once the risk is materialized (Cardona et al., 2008d). However, “world experience shows that disaster insurance has two big advantages: stimulate prevention oriented by insurers and guarantee financing and efficiency in post disaster reconstruction activities” (Vargas, 2002). The persistence of negative impacts in the city of Manizales, Colombia, has become a concern due to the fiscal and the social difficulties they represent for the local government. Given the joint work between the local government, the academia and the private sector of Manizales, since several years ago, a notable progress in risk management has been achieved. The development of detailed seismic information, including the microzonation of the city (ITEC, 2004), as well as the gathering of accurate information of the assets of the city, have been the base to design an innovative insurance scheme and to promote the insurance culture, in terms of the earthquake insurance promotion for low-income homeowners. The computer platform used for these evaluations was the RN-Col v.2.1, a probabilistic seismic risk assessment model (today the R System) developed by Evaluación de Riesgos Naturales – (ERN, 1999). The social benefit of the risk transfer mechanism of Manizales is evident when properties of the low-income homeowners are covered without cost for them. This is the reason why the design and the implementation of a voluntary collective insurance policy to protect the public and private assets of the city have become a key objective of the development plan of the local government (Cardona et al., 2004; 2005a; 2005b; Marulanda, 2009, 2013). The premium or insurance value is set according to the official value or the cadastral value of the property and it is included into the property-tax billing. As the insurance subscription is voluntary, when the payment of the property tax is made (each two months or once a year), each householder decides whether to include or not the charge of the insurance premium of his property. The city administration uses its information systems to compute and to ease the collection of the insurance payment of the properties of the city, the insurance company has the direct contractual relationship with the insured and, therefore, it solves problems and processes the claims derived from the policy (Marulanda, 2009). In this article we describe the probabilistic seismic risk model and the steps followed to obtain the probable losses and the average annual loss of each private building of the city of Manizales. We also show how the results are used for designing the collective risk transfer instrument that covers the losses of poor homeowners by cross-subsidies. 2
DESCRIPTION OF THE PROBABILISTIC SEISMIC RISK MODEL
Seismic risk models are used to calculate the probable losses that a catastrophic event could generate in a region. Limited information is available for low frequency, catastrophic events, fact which leads to large uncertainties related to the seismic events that require a probabilistic treatment (Egozcue et al., 1991). The probabilistic risk assessment model simulates scientifically credible events that might happen in the future. In general, the catastrophe models maximize the available information necessary to assess the potential
3
lossees that can produce p extrreme eventss and it is im mportant to have in minnd the effeccts of the uncertainties upon the outputs that havve to be con nsidered in decision-ma d aking. The structure off a risk mod del is compoosed of a seequence of processes p oor modules allowing a to peerform hazaard assessm ment, vulneerability asssignation, risk r evaluattion (assesssment of potenntial losses) (Barbat et e al., 20066; Barbat et e al., 2010 0) as well aas of a nu umber of appliications maaking use of o the risk results (Wo oo, 1999, 2011; 2 Grosssi and Kun nreuther, 20055; Cardona et e al., 2008aa). The basiic structure of such a model m is show wn in Figurre 1. The grey part correspponds to RN N-Col v.2.1 computer system s mod dules.
RN-Col v.2.1. v
Figuree 1.Risk modeel structure.
The following sections s disscuss how tthe RN-Col computer system (ER RN, 1999) has h been used to assess the t seismic risk of thee city of Manizales, M Colombia. C FFor the seismic risk estim mation, it waas necessary y to includee the inform mation of th he seismic hhazard cond ditions of the reegion, the seismic s micrrozonation of the city and a the exposure, that iis, the physical data of eaach buildingg of Manizales and thee information that chaaracterizes eeach buildin ng class. Oncee the complete requireed informattion was inccluded in th he computaational system, loss exceeedance currves, probab ble maximuum losses and averag ge annual llosses or pure p risk prem miums (Carrdona et al. 2008d, Maarulanda 2013, Marulan nda et al. 22013) were obtained for ddifferent dedductibles, maximum m lim mits of excess of loss and coinsurrance. Thesse results allow w us to analyyze which was w the bestt or the mosst suitable pure p premiuum for the collective insurrance instruument.
3
EXPOSU URE
The exposure or o the expo osed assets include an n inventory y of buildinngs to estim mate the probaable lossess. The expo osure consiidered in the t evaluation perform med in this article consiisted of alll the 85,816 6 private bbuildings off Manizaless, Colombiaa (cadastrall data of 20099). Each prooperty was characterize c ed by the esssential inforrmation succh as locatio on, value of replacement, constructio on class andd year of con nstruction. When updaated propertty values weree available, the databasse was updaated. The caadastral infformation w was mainly obtained
4
from m the Municcipal Directorate of Diisaster Risk k Managemeent and addditional info ormation was ttaken from other municcipality dataabases5. 6 Accoording to thhe socio-ecconomic claassification n used in Colombia C , three portffolios or groupps of buildiings were deefined: (a) llow-incomee household ders portfoliio (correspo onding to socioo-economic layers 1 and a 2 of Coolombia), (b) ( property y-tax payerr’s portfolio o (socioeconnomic layerss 3 to 6 of Colombia) and (c) com mplete portffolio (socioo-economic layers 1 to 6). Table 1 shhows the thrree portfolioos with theiir number of records annd the insurred value whicch, in this caase, is the caadastral valuue.
T Table 1.Generral data of thee portfolios off private buildiings of Manizzales. The in nsured value iis given in Col$ (US$ 1= Col$ 2,000) Portffolio 1 2 3
Description n Exemptt of property tax x Non-exxempt of properrty tax Total prrivate buildingss
Number of records
% registerss
15,342 70,474 85,816
18% 82% 100%
Insured vvalue (Millioon COL$$) $ 778,590 $ 3,0336,460 $ 3,1115,050
% insured value 3% 97% 100%
Figurre 2 shows the physicaal value of th the private buildings b off Manizales . The yellow w colour correesponds to the t building gs with a vvalue below Col$8,950,000 (socioo-economic layers 1 and 22), and the colours c from m orange too red corresp pond to buildings withh values greaater than Col$$8,950,000, that is, to th he layers 3 tto 6 of the taxpayers. t
Figuree 2. Exposed value v of the prrivate building gs of the city of o Manizales, Colombia
5
More detailed parametters were includeed by field visits, aerial photograp phs and maps. Ad dditionally, in casses where information did not m new sources, ann optimization algorithm was used d to define it (Maarulanda, 2009). exist orr it was not possibble to infer it from The ssocio-economic classification c in Colombia is maade by “layers” according a to diffferent socio-econnomical characterristics of the populattion: Layers 1 annd 2 include peop ple with very low w economic capaccity, while layers from 3 to 6 incluude property tax payers. This classifiication is used too differentiate ch harge public servvices, allowing th he assignment off subsidies and th the collection of contribution panish) (Statisttic National Administrative Departtment of Colombbia, DANE, in Sp 6
5
4
SEISMIC HAZARD MODULE
The seismic hazard module defines the probability of exceeding certain levels of the ground motion intensity at particular locations. The analysis comprehends the sources, the frequency of occurrence and a measure of the intensity of the earthquakes at specific sites. The definition of these parameters of the seismic events is based on the review of the historical information available for the studied area and on scientific studies. The module generates a set of thousands of stochastic events once the probability distributions of each parameter are defined, which characterize the activity rates of each faulting system. More detailed information about the description of the seismic hazard module can be found in Cardona et al. (2008d), Cardona et al. (2010b), Marulanda (2013), Marulanda et al. (2013). In the case of Manizales, the module of seismic hazard includes: -
The seismic parameters, such as the lower and upper bound magnitudes, the occurrence rate of the earthquakes and other parameters defining the seismic hazard of Colombia (AIS-300, 1996, 2010; Salgado et al. 2010, 2013).
-
The attenuation of the seismic event from its epicenter to the site under consideration, has to be included. The attenuation laws capture how intensity changes when an earthquake propagates over an area. Thereby, the model considers the propagation of the seismic waves by means of probabilistic spectral attenuation laws. The definition of the attenuation laws for different types of seismological sources (“active” for continental sources and “subduction” for subduction sources) based on regional recent strong motion records of Colombia, was made by Gallego, (2000). The local soil effects can generate important effects on the amplitude and on the frequency of the waves. Manizales counts with detailed studies on the dynamic properties of soils and on the topographic effects (CEDERI, 2002), according to which the city is subdivided in microzones.
-
The information of the seismic hazard is used as a step to obtain results for the probable losses. The figure 3 shows a screenshot of the SisMan7 V1.1.0 system containing results of spectral acceleration for a specific return period and using the seismic microzonation of the city (ITEC, 2004). This program allows the visualization of the seismic hazard used by the RN-Col. The system comprehends the entire geographical information of the city, including general cartography, rivers, roads, places of interest, location of essential and special buildings, geology and geotechnical information. This tool allows displaying the seismic hazard in any area of Manizales, considering the local site effects. Exceedance rates for multiple spectral ordinates of acceleration, velocity and displacement are 7
Sistema de Información Sísmica de Manizales, SisMan. Program that allows the visualization of the seismic hazard used by the RN-Col.
6
oobtained to provide p the design speectra, inform mation which is also usseful for thee seismic ddesign of buuildings.
Figgure 3.Screensshot obtained with the interractive softwarre tool SisMan n for the seism mic microzonaation of M Manizales, Colombia
5
VULNER RABILITY MODULE E
Vulnnerability fuunctions pro ovide all thee necessary information n to calculatte the probaability of reachhing or excceeding a lo oss value, ggiven a seismic deman nd. They quuantify the level of damaage expecteed in each building b claass for diffeerent levels of the intennsity of thee seismic evennts. In orderr to define these t curvess, the inven ntory of builldings –expposure– is classified c into different building b typ pes with di different chaaracteristicss (in functiion of the type of mateerials and sttructure, bu uilding use, number off levels, yeaar of constrruction). Daamage is estim mated in term ms of the Mean M Damaage Ratio, MDR, M which is definedd as the ratiio of the expected repair cost to the economic e vvalue of the structure. A vulnerabillity curve iss defined relatiing the MD DR to the eaarthquake inntensity, wh hich can be expressed, at each loccation, in terms of the maaximum accceleration (uuseful for 1-2 1 story bu uildings), sppectral acceeleration, veloccity or interrstory drift (useful ( for m multi-story buildings) (Miranda, 11999). The range of damaage ratio caan go from 0% (no daamage) to 100% (total loss). Due to the fact that the seism mic intensity and the level l of exppected dam mage have high h uncertaainties, the damage ratio is also a raandom valu ue. Detailedd informatio on on this isssue is giveen in Cardo ona et al. (2008d), Cardonna et al. (20 010b), Maruulanda, 2013 3 and Marullanda et al.,, 2013
7
The urban characteristics and the urban evolution of Manizales increase continuously its susceptibility to seismic hazards. The city has grown in an abrupt topography area with special geological particularities, and with a lack of urban planning that has led to build in dangerous areas. Although at the beginning of the XIXth century, the most common class of buildings had a bahareque8 structure, when two disastrous fires occurred in the city in 1923 and 1925, the population started to build with other kinds of materials, safer to fires. Thus, the culture of the wood or bahareque technology was abandoned to adopt concrete and masonry as building materials. These more rigid and fragile structures, together with the increase of population and the fast urban growing, entailed a more vulnerable city to seismic actions. Nevertheless, after the earthquake of 1979 that produced important losses in the city, the first earthquake resistant building code was made in 1981 at city level, before Colombia adopted one at national level. Colombia counts with seismic building codes since 1984 (Law 400 of 1984); these codes have been continuously updated allowing a better quality of construction and this fact is reflected in the decrease of the seismic vulnerability of the assets. A total of 20 building classes are included in the RN-Col system as it is detailed inTable 2. Figure 4 and Figure 5 show vulnerability curves in terms of peak ground acceleration and inter-story drift, respectively, for several construction classes (Cardona et al., 2008a; 2008b; 2008c; 2008d). Table 2.Building classes of Manizales considered in the RN-Col System 1 2 3 4 5 6 7 8 9
Description Adobe / tapial earth walls Bahareque Non-reinforced masonry - without diaphragm (1 story) Non-reinforced masonry - rigid diaphragm (1 story) Non-reinforced masonry (>2 stories) 1st and 2nd floor non-reinforced masonry Light roof warehouse and non-reinforc. masonry walls Light wood structure Church
Code 10 11 12 13 14 15 16 17 18 19 20
Description Semi-confined masonry Confined masonry Reinforced masonry Waffle/Flat slab Weak reinforced concrete frames with masonry infill Strong reinforced concrete frames with masonry infill Reinforced concrete frames with concrete shear walls Reinforced concrete shear walls Light roof warehouse, steel columns and masonry walls Light roof warehouse, concrete columns and masonry walls Steel frames
8 The bahareque is a mixed timber, bamboo and mud wall construction technique. It is frequently used in some Latin-American countries.
8
Figure 4.Vu ulnerability fuunctions based d on peak grou und acceleratioon
Figure 5.Vu ulnerability funnctions based on maximum m inter-story drrift
6
RISK MO ODULE
The risk module evaluates the potentiial effects or o consequeences of thee natural haazardous evennts by meanns of the co onvolution of the hazaard with thee vulnerabiility of the exposed elem ments. It exppresses risk in terms off physical daamage, abso olute or relaative econo omic loss
9
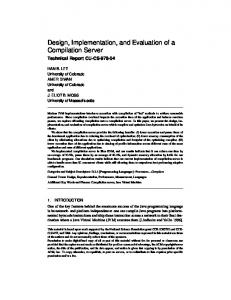
and/or affected population. Thus, this risk module calculates losses by transforming the damage ratio obtained in the vulnerability module into economic loss by multiplying it by the value at risk. The same procedure is followed for each asset class at each location. Losses are then aggregated according to the procedure proposed by Ordaz et al. (1998) and by Ordaz (2000). The loss module estimates the net losses. The main metrics used in the probabilistic risk assessment are the following: Loss Exceedance Curve, LEC (Grossi and Kunreuther, 2005) or the Exceedance Probability Curve, EP Curve which represents the annual frequency of exceedance of a specific loss is the most important catastrophe risk metric used by risk managers, since it estimates the amount of funds required to meet risk management objectives. The LEC can be calculated for the largest event in one year (Occurrence Exceedance Probability Curve, OEP curve) or for all the events (cumulative) in one year (Aggregate Exceedance Probability Curve, AEP Curve). Once obtained, the Loss Exceedance Curve allows calculating other appropriate metrics for the financial analysis of the losses such as the Average Annual Loss or the Probable Maximum Loss. Average Annual Loss, AAL, is the expected loss per year. It is also denominated Pure Risk Premium. Computationally, the AAL is the sum of the product of the expected losses due to a specific event and the annual occurrence probability of that event, for all stochastic events considered in the loss model. The average annual loss considers the losses in each building for all the events that can occur supposing that the process of occurrence of hazard events is stationary and that the damaged structures are strengthened immediately after an event. Probable Maximum Loss, PML (equivalent to OEP curve) represents the loss amount for a given annual exceedance frequency, or for its inverse, the return period. Thus, the PML expresses the economic value of loss with regard to the return period. The PML is an appraiser of the size of the maximum losses reasonably expected in a set of elements exposed to a hazard event. Typically, PML is a fundamental metric to determine the size of reserves that, for example, insurance companies or a government should maintain to avoid excessive losses that might exceed their capacity to spend. The risk model defines it as the average loss that could occur for a given return period. Figure 6 shows the PML curve obtained for the complete portfolio of private buildings of Manizales. The red dot in this curve indicates that, in the case of the insurance of Manizales, the used return period is 1500 years9, that would mean a PML of 13,6% of the portfolio. Table 3 shows the probabilistic results for each portfolio of the city with the 3% of deductible which is the current standard deductible for earthquake in the insurance market. Nevertheless, Table 4 shows the results for different deductibles (0%, 1,5% and 3%) to illustrate their effects on the values of the pure premium and the PML. Figure 7 shows a detailed visualization of the pure premium of each building using the SisMan+ Risk system (INGENIAR and ITEC, 2005). The aim of SisMan+ Risk tool is to facilitate the risk visualization (i.e. pure risk premium, potential losses scenarios), thus better understanding risk and proposing actions to intervene in high-risk areas.
9
For insurance purposes, the return period defined in Colombia is 1500 years.
10
Figure 6. PML curvee of the privatte buildings off Manizales
Tablee 3. Results obbtained for no on-taxpayers, ttaxpayers, and d the total porrtfolio of builddings with a deductible d of 3%
ASPECT Num mber of buildiings IInsured valuee (M Million Col$)) P Pure Premium m Return perriods 100 yearrs 500 yearrs 1000 yeaars 1500 yeaars Exp pected Loss (%)
PML
D DEDUCTIBLE 3% PRIVATE BUIL LDINGS EXEMPT E NON-EXEMPT 15.342
TOTAL
70.474
78.590
85.816
3.036.460 3 0
3.115.050 0 0
0
Millio on Col$ $ 56
/00 cadastraal 0,741
Millio on Col$ $
% cadastraal
Million Col$
% cada astral
Milllion Col$
% cadastral c
$ 1,39 94 $ 5,38 88 $ 7,42 21 $ 8,93 36 $ 26,747
1.42% 5.48% 7.55% 9.09% 26.51%
$ 115,079.72 $ 320,464.01 $ 441,982.26 $ 523,991.72 $ 1,160,86 60.83
3.0 03% 8.4 43% 11.5 59% 13.7 72% 29.7 72%
$ 1116,445.89 $ 3225,644.18 $ 4449,192.38 $ 5332,788.96 $ 1,1187,607.83
2.99% 8.35% 11.49% 13.60% 29.64%
Million Col$ 5.736 6
/00 cada astral 1,9 963
Milllion Col$ 55.792
Tablee 4. Effects of deductible in the premium value and PM ML for the totaal portfolio Deducctible Deducctible Pure p premium Purre premium PML P 1500 [%] [% %] [Million Col] [[‰] [M Million Col] 0 3..210 $ 9,747 16.00% 0 $ 46,725.75 2..388 $ 7,116 14.75% 1..5 $ 93,451.49 1..982 $ 5,792 13.60% 3
11
PM ML 1500 [M Million Col] $ 4498,441.35 $ 4459,413.84 $ 5532,788.96
/00 cadastral c 1,982
Fiigure 7.Screennshot of the SisMan+Risk sshowing the reesults of the pure premium for the buildin ngs of Manizaless
7
IMPLEM MENTATIO ON OF THE E COLLEC CTIVE INS SURANCE E INITIATIVE
Extreeme disasteers are chaaracterized by the occcurrence off low frequuency/high severity phennomena andd by the diffficulty of ppredicting th he moment and place oof their occcurrence. The level of sevverity of thee consequennces and lo osses generaated by largge events caan cause insollvency probblems and economic e innsecurity in n a city or even e at natiional level. Thus, a strateegy to facee those prob bable lossees is the deesign of altternative strructures ad dequately combbining finanncial instru uments to ccover different levels of losses. The layers of the finanncing structuure must bee establisheed according g to the cossts of the avvailable insttruments and tthe capacityy of the go overnment tto acquire them. t From m the governnmental sid de, these kind of structurees allow to face the connsequences of extremee events witthout comprromising the ffinancial andd fiscal stab bility and m minimizing social s losses (Pollner, 22001, Maru ulanda et al., 22008, Cardoona, 2009, Cummins C annd Mahul, 2009). matically shhown in Fig gure 8, is A finnancing struucture of risk retention and risk traansfer, schem a biddimensionall representattion of the lloss, frequen ntly used in n the insurannce modelin ng. In its simpplest form, the t structuree basically consists of three main parameterss that must be taken into account whhen it is designed: the deductible or retentio on limit –thhis is the prriority or attachment poinnt of risk traansfer layer– r–, the maxiimum limit of responsiibility –or excess e of loss llimit of the risk transfeer layer– annd the total value of thee exposure. In turn, theeses loss layerrs can be composed of other ssub-layers where each one reprresents a financial f instruument, suchh as a reserrve fund, a contingent credit, insu urance/reinssurance, a cat c bond, taxess or other credits, c amo ong others pprovided by y the multillateral finanncing organ nizations such as the Worrld Bank an nd the Inter--American Developmen D nt Bank. Thhe size of th he layers
12
and tthe adoptedd combinatio on depend oon the costss of the finaancial instruuments whicch cover each level of lossses. Additionally, it is not cost-efffective to use u a uniquee instrumentt; lack of liquiddity can im mpede to cov ver a compllete portfolio. For exam mple, in thee case of in nsurance, prem miums couldd be prohibiitively highh if one wan nts to cover the lower llayer of lossses, that is, thhe more freequent losses or the uupper layers (Banks, 2004, 2 Maruulanda et all., 2008, Carddona, 2009 and Marulaanda 2013).. In the casse of the co ollective inssurance initiative of Maniizales whiich covers with crooss-subsidies the low w-income hhomeownerrs (nontaxpaayers), Figuure 9 shows alternativve values off coverage, in millionns Colombiaan pesos (MD DP).
Fiigure 8.Financcing structure of risk retentiion and risk trransfer in Man nizales to coveer private prop perties
Figurre 9 illustraates the hyp pothetical e conomic co osts of each h strategy thhat can be explored e by a governmennt, considerring risk reetention (ow wn capital) and risk trransfer, (in nsurancereinssurance andd the capitall market). Inn general, this t schemee can be connsidered as feasible or apppropriate in all cases. The risk aappetite of the t governm ment wouldd define wh hat limits (k1, k2, k3) of retention r an nd transfer instrumentss are optimal accordinng to the cost of the nsidering origiin of resourrces required for variouus levels off coverage (ERN-AL, 2011). Con m the figure that t it is not ot optimal to o finance the aalternatives indicated, it can be dedduced from the eentire loss frrom a singlee financing source; therre are otherr financing aalternatives that can cost less at cerrtain intervaals. For thaat reason, in theory, it is necesssary to con nstruct a functtion of totall costs that represents r th the weighted d sum of fin nancing souurces and that, using optim mization alggorithms, heelps to find the optimu um cost (in this case thhe minimum m) based
13
on that function. Although an algorithm that helps finding the optimal cost can be developed, in practice this would be subjected to the insurance and reinsurance market conditions, which are also driven by capacity vs. demand.
Own Capital/Reserve Funds
Cost of the Instrumen t
Insurance/Reinsurance
0
Capital Market/Cat Bonds
k1 k2 Amount of Resources Needed ($)
k3
k
Figure 9.Scheme of the general financial cost according to the losses that must be covered
Overall, the designed structure of risk retention and transfer takes into consideration the interaction between the different beneficiaries: householders with intermediate-high economic capacity to pay their insurance, low-income homeowners and the municipal government as the co-responsible of losses. The alternative chosen was oriented towards the economic capacities, the social conditions, the will of the government and the attractive incentives for the majority of the homeowners. Different structures of risk retention and risk transfer were proposed according to the results of different portfolios obtained with the risk modeling. It was also considered the analysis of alternatives related to the retention levels and maximum limits of coverage based on the budget availability in the city. Once a set of structures were exposed, the Mayor, the Financial and Legal Secretariats of the local administration and the Disaster Risk Management Directorate of Manizales chose the structure most affordable for all involved parties. As shown in the Figure 8, the deductible chosen was 3% because the pure premium for private buildings was more affordable than the one with a lower deductible. A lower pure premium was not convenient because it would mean a lower coverage with greater values of retention. This priority or deductible must be assumed by the insured (the property-tax payers), but the government covers these first layer of losses of the low-income homeowners through a reserve fund for disaster risk management. This fund is composed by a percentage assigned from the local budget and, above a given excess of loss threshold, by a national contingent credit (World Bank CAT DDO of US$250 millions) agreed by the national government with the World Bank, with which the national government supports financially the local government. When the attachment point is reached the transfer layer is covered by the collective insurance instrument provided by La Previsora insurance company up to an excess of loss that was defined between the insurance company and the city administration. Thus, to cover up the total cadastral value of all properties the upper layers are estimated to be supported with another percentage of the national contingent credit, or with the support of other resources of the national government.
14
Now then, one of the proposals of the design of a collective voluntary insurance was to cover, in some way, the losses of the poor people of the city. So, when analyzing the three portfolios, it was possible to reveal that the cadastral value of the low-income properties was not significant when compared with the rest of the value of the private buildings of the city. This gave the possibility to consider a subsidy for the socio-economic layers 1 and 2, assuming their pure premium the taxpayers that decided to subscribe the insurance program (Marulanda, 2009; Marulanda 2013).
Average pure premium (‰)
Because this is a voluntary insurance program, the percentage of taxpayers that pay the premium could vary significantly. Figure 10 shows the cost of the blanket pure premium of the non-exempt homeowners according to the level of insurance participation and considering the cross subsidy (covering the low-income homeowners or property tax exempts). It can be seen that, for a participation of 10%, the premium without the portfolio of low-income homeowners is 2.1‰ while, when it is included, the value is 2.3‰. When the participation increases to 20%, the premium without subsidy is 2.0‰ and, when including the subsidy, it is 2.1‰. These values are affordable for both, the city administration and the participant taxpayers, given that, although the pure premium increases when including the subsidy, as expected, this increase is not significant. This demonstrates that the proposed cross-subsidy mechanism for covering the expected losses of low-income people is viable (Marulanda, 2009; 2013). 2.4 2.3 2.2 2.1 2.0 1.9 1.8 1.7 1.6 1.5 1.4 1.3 1.2 1.1 1.0 100%
Premium including exempts
Non-exempts pure premium
80%
60%
40%
20%
0%
Percentage of non‐exempts (%)
Figure 10. Blanket pure premium for non-exempt properties portfolio for different levels of insured value with respect to the total portfolio.
In summary, Figure 11 shows schematically the basic collective insurance structure of Manizales. The first layer of this structure (deductible or priority) is the responsibility of each owner with the exception of socio-economic layers 1 and 2 for which the municipal government assumes this first layer of the losses. The second layer of the structure is the insurance instrument itself, where the middle and high income homeowners which participate in the program are contributing to cover the losses of the lowest socio-economic
15
layers. When losses exceed the upper limit of the policy, other alternatives are considered, such as the financial support of the national government or donors or NGOs. Exposed value
NATIONAL GOVERNMENT NGOs
RETENTION
PML
TRANSFER
Subsidy
RETENTION
Municipality
Lower limit 6
5
4
3
2‐1
SOCIO‐ECONOMIC LAYER
Figure 11. Basic financing structure of risk retention and transfer developed for the city of Manizales to cover low-income homeowners
8
CONCLUSIONS
Within the framework of the collective insurance program of Manizales, a blanket premium of 2.5‰10 of the cadastral value of each building has been estimated and agreed with La Previsora insurance company. The deductible is 3% of loss value in case of earthquake and at least three current minimum legal monthly salaries. In the cases of other natural hazards or events like strike, riot, civil or popular commotion, bad intentioned acts to third parties or terrorism, the deductible was agreed to be 10% of the loss of the affected building and at least two minimum legal monthly salaries. The insurance company La Previsora issued a matrix policy for which the Manizales municipality is the taker on behalf of the citizens. This policy is filed in the Mayor’s office, in a notary’s office and in a branch of the insurance company of Manizales, and is available to the users for revision. Given that the average participation has been of the order of 12% of the taxpayers of the city11, an agreement between the public administration and the insurance company was settled. At present, with this percentage of participation of taxpayers, the total low-income homeowners of Manizales are covered with the collective insurance. This innovative financial protection instrument implemented in Manizales, Colombia, that has been improved with careful studies of scientific-technical and actuarial character constitutes, without any doubt, a successful experience and it is a good practice promoted by the local government and the national insurance market. This initiative is mainly a social action of the local government which, when it is feasible, is also supported by the national government. The cost effectiveness is clear from sustainability, prevention, socio-economic well-being, financial protection and reduction of the macroeconomic contingent liabilities points of view. It has been based on technical studies made with robust engineering risk models, but the most important elements of this 10 11
Within the technical premium, the operational costs, acquisition and utility are included, among others. The owners with mortgage are not participating in the program because they already have compulsory property insurance.
16
initiative are the political will, governance, citizen solidarity, and risk perception of the society and the government leaders and officials. This mechanism of risk transfer can be replicated in other disaster-prone developing countries, if appropriate risk studies are made for its implementation. This initiative has been acknowledged as one of the best disaster risk management practices in the Latin America and the Caribbean region by the United Nations International Strategy of Disaster Risk Reduction (Regional platform for disaster risk reduction in the Americas, Chile, November 2012) Finally, it is important to mention that the results of a probabilistic risk model are useful for different other applications in a city or a country. For example, the risk results obtained for Manizales were also used to calculate the Urban Seismic Risk Index, USRi, of the city’s districts by means of a holistic approach to seismic risk evaluation (Carreño et al., 2007, Marulanda et al., 2009, Barbat et al. 2011). ACKNOWLEDGEMENTS This work has been partially sponsored by DESURBS-FP7-2011-261652. The authors are also grateful for the support of the World Bank, the IDRC ECOPOLIS Graduate Research Program of Canada and of the Ministry of Education and Science of Spain, project “Enfoque integral y probabilista para la evaluación del riesgo sísmico en España”CoPASRE (CGL2011-29063). REFERENCES AIS-300 C (1996) Estudio general de amenaza sísmica de Colombia. In (ed.), Vol. pp. Asociación Colombiana de Ingeniería Sísmica, Bogotá, Colombia. Andersen TJ (2002) Innovative Financial Instruments for Natural Disaster Risk Management. In Technical paper. (ed.), Vol. pp. Inter-American Development Bank, Banks E (2004) In Alternative Risk Transfer: Integrated Risk Management Through Insurance, Reinsurance, and the Capital Markets. Vol. pp. John Wiley & Sons, Barbat AH, Carreño ML, Pujades LG, Lantada N, Cardona OD, and Marulanda MC (2010) Seismic vulnerability and risk evaluation methods for urban areas. A review with application to a pilot area. Structure and Infrastructure Engineering 6, 499-. Barbat AH, Pujades LG, N. L, and R. M (2006) Performance of buildings under earthquakes in Barcelona, Spain. Computer-Aided Civil and Infrastructure Engineering 21, 573-93. Birkmann J, Cardona OD, Carreño ML, Barbat AH, Pelling M, Schneiderbauer S et al. (2013) Framing vulnerability, risk and societal responses: the MOVE framework. Natural Hazards 67, 193-211. Cardona OD (2009) In La gestión financiera del riesgo de desastres: Instrumentos financieros de retención y transferencia para la comunidad Andina. Vol. pp. Lima. Cardona OD, Lavell AM, Mansilla E, and Moreno AM (2005a) Avances en las estrategias de desarrollo institucional y sostenibilidad financiera de la gestión del riesgo de desastres en América Latina y el Caribe. In diálogo Regional de Poítica sobre Prevención de Desastres. (ed.), Vol. pp. Banco Interamericano de Desarrollo, BID, Washington. Cardona OD and Marulanda MC (2010) Mecanismos Financieros, Seguro y Reaseguro contra Desastres Naturales en América Latina y el Caribe: Experiencias Recientes. In (ed.), Vol. pp.
17
Secretaría Permanente del Sistema Económico Latinoamericano y del Caribe, SELA, Caracas. Cardona OD, Ordaz MG, Marulanda MC, and Barbat AH (2008a) Estimation of Probabilistic Seismic Losses and the Public Economic Resilience—An Approach for a Macroeconomic Impact Evaluation. Journal of Earthquake Engineering 12, 60-70. Cardona OD, Ordaz MG, Marulanda MC, and Barbat AH (2008b) Fiscal Impact of future earthquakes and country’s economic resilience evaluation using the disaster deficit index. In 14th World Conference on Earthquake Engineering. (ed.), Vol. pp. Beijing, China. Cardona OD, Ordaz MG, Moreno AM, and Yamin LE (2004) Análisis de riesgo de desastres extremos en Colombia con fines de valoración de la exposición fiscal. In Informe del estudio sobre definición de la responsabilidad del Estado, su exposición ante desastres naturales y diseño de mecanismos para la cobertura de los riesgos residuales del Estado. (ed.), Vol. pp. ACCI, DNP, Banco Mundial, Cardona OD, Ordaz MG, Moreno AM, and Yamin LE (2005b) Obligaciones contingentes del Estado por desasatre, requerimiento de recursos y posibilidades de asignación. In Informe del estudio sobre definición de la responsabilidad del Estado, su exposición ante desastres naturales y diseño de mecanismos para la cobertura de los riesgos residuales del Estado. (ed.), Vol. pp. ACCI-DNP, Banco Mundial, Cardona OD, Ordaz MG, Reinoso E, Yamín LE, and Barbat AH (2010) Comprehensive Approach for Probabilistic Risk Assessment (CAPRA): International Initiative for Disaster Risk Management Effectiveness. In 14th European Conference on Earthquake Engineering. (ed.), Vol. pp. Ohrid, Macedonia. Cardona OD, Ordaz MG, Yamin LE, Arámbula S, Marulanda MC, and Barbat AH (2008c) Probabilistic seismic risk assessment for comprehensive risk management: modeling for innovative risk transfer and loss financing mechanisms. In 14th World Conference on Earthquake Engineering. (ed.), Vol. pp. Beijing, China. Cardona OD, Ordaz MG, Yamin LE, Marulanda MC, and Barbat AH (2008d) Earthquake Loss Assessment for Integrated Disaster Risk Management. Journal of Earthquake Engineering 12, 48-59. Carreño ML, Cardona OD, and Barbat AH (2007) Urban Seismic Risk Evaluation: A Holistic Approach. Natural Hazards 40, 137-72. CEDERI (2002) Microzonificación Sísmica de la Ciudad de Manizales. In (ed.), Vol. pp. Centro de Investigación en Materiales y Obras Civiles, Centro de Estudios sobre Desastres y Riesgos, Departamento de Ingeniería Civil y Ambiental, Universidad de los Andes, Bogotá, Colombia. Consorseguros (2008) La cobertura aseguradora de las catástrofes naturales. Diversidad de sistemas. In Seguros CdCd (ed.), (ed.), Vol. pp. Madrid. Cummins JD and Mahul O (2009) In Catastrophe Risk Financing in Developing Countries: Principles for Public Intervention. Vol. pp. World Bank, Egozcue JJ, Barbat AH, Canas JA, Miquel J, and Banda E (1991) A method to estimate occurrence probabilities in low seismic activity regions. Earthquake Engineering and Structural Dynamics 20, 43-60. ERN-AL (2011) Probabilistic modelling of disaster risk at global level: Development of a methodology and implementation of case studies. Phase 1A: Colombia, Mexico, Nepal. In Backgroud paper prepared for the 2011 Global Assessment Report on Disaster Risk Reduction. Prepared by the Consortium Evaluación de Riesgos Naturales - América Latina. (ed.), Vol. pp. UNISDR, Geneva, Switzerland. ERN (1999) Sistema para la evaluación de pérdidas por terremoto en edificaciones con fines de seguro (Version 2.5.1). Bogotá.
18
Freeman PK, Keen M, and Mani M (2003) In Dealing with increased risk of natural disasters: challenges and options. Vol. pp. International Monetary Fund, Fiscal Affairs Dept., Gallego M (2000) Estimación del riesgo sísmico en la república de colombia[Thesis]. Type, Universidad Nacional Autónoma de México, Ciudad de México. Grossi P and Kunreuther H (2005) In Catastrophe Modeling: A New Approach to Managing Risk. Vol. pp. Springer US, Boston. Gurenko E, Lester R, Mahul O, and Gonulal S (2006) In Earthquake Insurance in Turkey. History of the Turkish Catastrophe Insurance Pool. Vol. pp. The World Bank, Washington, D.C. INGENIAR and ITEC (2005) Sistema de Información Sísmica de Manizales. Versión Riesgo. ITEC (2004) Sistema de Información Sísmica de Manizales – SISMan. Marulanda MC (2009) Design and implementation of a collective disaster risk transfer instrument for the insurance coverage of low-income homeowners by cross-subsidies in Manizales, Colombia : technical report. In ECOPOLIS Graduate Research and Design Competition (Global). (ed.), Vol. pp. Universidad Nacional de Colombia, Manizales, CO, Marulanda MC (2013) Modelación probabilista de pérdidas económicas por sismo para la estimación de la vulnerabilidad fiscal del Estado y la gestión financiera del riesgo soberano[Thesis]. Type, Universidad Politécnica de Cataluña (UPC), Barcelona, Spain. Marulanda MC, Cardona OD, and Barbat AH (2010) Revealing the socioeconomic impact of small disasters in Colombia using the DesInventar database. Disasters 34, 552-70. Marulanda MC, Cardona OD, and Barbat AH (2009) Robustness of the holistic seismic risk evaluation in urban centers using the USRi. Natural Hazards 49, 501-16. Marulanda MC, Cardona OD, Ordaz MG, and Barbat AH (2008) In La gestión financiera del riesgo desde la perspectiva de los desastres: Evaluación de la exposición fiscal del estado y alternativas de instrumentos financieros de retención y transferencia del riesgo. Vol. pp. Centro Internacional de Métodos Numéricos en Ingeniería, Barcelona, Spain. Marulanda MC, Carreño ML, Cardona OD, Ordaz MG, and Barbat AH (2013) Probabilistic earthquake risk assessment using CAPRA: application to the city of Barcelona, Spain. Natural Hazards 1-26. Mechler R, Hochrainer S, Linnerooth-Bayer J, and Pflug G (2006) Public sector financial vulnerability to disasters: The IIASA CATSIM Model. In Measuring Vulnerability to Hazards of Natural Origin: Towards Disaster Resilient Societies. Birkmann J (ed.), Vol. pp. 380-98. United Nations University Press, Tokyo. Miranda E (1999) Approximate Seismic Lateral Deformation Demands in Multistory Buildings. Journal of Structural Engineering 125, 417-25. Ordaz MG (2000) Metodología para la Evaluación del Riesgo Sísmico Enfocada a la Gerencia de Seguros por Terremoto. In (ed.), Vol. pp. Universidad Nacional Autónoma de México, México D.F. Ordaz MG, Miranda E, Reinoso E, and Pérez-Rocha LE (1998) Seismic Loss Estimation Model for México City. In Universidad Nacional Autónoma de México. (ed.), Vol. pp. México DF., México. Pollner JD (2001) Managing catastrophic disaster risks using alternative risk financing and pooled insurance structures. In Technical paper ; no. WTP 495 (ed.), Vol. pp. World Bank, Vargas JE (2002) In Politicas Publicas para la Reduccion de la Vulnerabilidad Frente a los Desastres Naturales y Socio-naturales. Vol. pp. Naciones Unidas, CEPAL, División de Medio Ambiente y Asentamientos Humanos, Woo G (2011) In Calculating catastrophe. Vol. pp. Imperial College Press ; Distributed by World scientific Publishing Co., London; Singapore.
19
Woo G (1999) In The Mathematics of Natural Catastrophes. Vol. pp. Imperial College Press,
20