... DC-DC fullbridge converter, hard-switched converter, soft-switch converter, ...... model: system specifications, free parameters and design parameters are ...
Design, simulation and evaluation of two different topologies for the 2.4 MW 4/6 kV DC-DC fullbridge converter Master of Science Thesis
M AJID FAZLALI M AZIAR M OBARREZ
Department of Energy and Environment Division of Electric Power Engineering C HALMERS U NIVERSITY OF T ECHNOLOGY G¨oteborg, Sweden 2012
Design, simulation and evaluation of two different topologies for the 2.4 MW 4/6 kV DC-DC fullbridge converter MAJID FAZLALI MAZIAR MOBARREZ
Department of Energy and Environment Division of Electric Power Engineering CHALMERS UNIVERSITY OF TECHNOLOGY G¨oteborg, Sweden 2012
Design, simulation and evaluation of two different topologies for the 2.4 MW 4/6 kV DC-DC fullbridge converter
c MAJID FAZLALI
MAZIAR MOBARREZ, 2012.
Department of Energy and Environment Division of Electric Power Engineering Chalmers University of Technology SE–412 96 G¨oteborg Sweden Telephone +46 (0)31–772 1000
Chalmers Bibliotek, Reproservice G¨oteborg, Sweden 2012
Design, simulation and evaluation of two different topologies for the 2.4 MW 4/6 kV DC-DC fullbridge converter MAJID FAZLALI MAZIAR MOBARREZ Department of Energy and Environment Division of Electric Power Engineering Chalmers University of Technology
Abstract In this thesis, a hard switched and zero-voltage switching fullbridge converter for high power applications are compared in terms of their losses. Important issues in designing these kind of converters are to achieve high efficiency with low cost and low weight. Managing the converter parasitics and calculating the losses for the switches as well as for the high frequency transformer with square wave input are important issues in designing such a high power density converter which are discussed in this thesis. The proposed fullbridge converters are designed to convert 4 kV input voltage to 6 kV with a rated power of 2.4 MW. The comparison is done for three different frequencies: 500 Hz, 1 kHz and 2 kHz. Also, the simulation result s and loss calculations are presented. Based on the design and analysis of both hard and soft switching schemes of the high power density DCDC full bridge converter, it has been concluded that since for the lower frequencies the efficiency is almost the same for the two topologies, hard switched is preferable due to the lower cost. However, for the higher frequencies where the total losses are dominated by the switching losses, the soft switched topology is superior. The core loss of the transformer which was exposed to the high frequency square wave excitation has been calculated by using FEM simulation and it shows that the transformer contribution of the total loss of the converter is about 30% at all three studied frequencies for the phase shift controlled converter. The total efficiency of the hard switched converter is 97.3%, 96.3% and 94.5% for 500Hz, 1 kHz and 2 kHz switching frequencies respectively. For the zero voltage switching converter, the total efficiency changes like 97.8%, 97.1% and 96% for 500Hz, 1 kHz and 2 kHz respectively. As it is seen, for the low switching frequencies, the two topologies have almost the same efficiency. However, by increase in the switching frequency, the efficiency of the hard switched converter has higher reduction in comparison with the zero voltage switching converter. The less reduction of efficiency for the zero voltage switching topology is due to elimination of the switching losses in this topology. Index Terms: DC-DC fullbridge converter, hard-switched converter, soft-switch converter, zero-voltage switching, phase shift control, switching losses, high power density transformer.
iii
iv
Acknowledgements This work has been carried out at the Department of Energy and Environment at Chalmers University of Technology. We would Like to express our sincere appreciation to our supervisor and examiner, Prof.Torbj¨orn Thiringer, for his time, patience and help during the thesis work. We enjoyed each of our meetings with him and learned new things. A very special thank to Mohammadamin Bahmani for his help with the magnetics part of the thesis, availability and nice discussions. Thank to all the employees and staff in the division for making our thesis work a pleasant stay. Finally, we would like to thank our families continues supports and love. Maziar Mobarrez Majid Fazlali G¨oteborg, Sweden May, 2012
v
vi
Contents Abstract
iii
Acknowledgements
v
Contents
vii
1 Introduction
1
1.1
Problem Background . . . . . . . . . . . . . . . . . . . . . . . . . . . . . . . . . . . . .
1
1.2
Previous Work . . . . . . . . . . . . . . . . . . . . . . . . . . . . . . . . . . . . . . . . .
2
1.3
Purpose . . . . . . . . . . . . . . . . . . . . . . . . . . . . . . . . . . . . . . . . . . . .
2
2 DC-DC Converter Topologies 2.1
2.2
Fullbridge DC-DC Converter
5 . . . . . . . . . . . . . . . . . . . . . . . . . . . . . . . .
6
2.1.1
Duty Cycle Control . . . . . . . . . . . . . . . . . . . . . . . . . . . . . . . . . .
6
2.1.2
Phase Shift Control . . . . . . . . . . . . . . . . . . . . . . . . . . . . . . . . . .
6
Resonant DC-DC Converters . . . . . . . . . . . . . . . . . . . . . . . . . . . . . . . . .
7
2.2.1
Load Resonant Converter . . . . . . . . . . . . . . . . . . . . . . . . . . . . . . .
9
2.2.2
Resonant Switch Converter . . . . . . . . . . . . . . . . . . . . . . . . . . . . . .
12
3 Components of the DC-DC Fullbridge Converter 3.1
3.2
3.3
19
IGBT . . . . . . . . . . . . . . . . . . . . . . . . . . . . . . . . . . . . . . . . . . . . .
19
3.1.1
IGBT operation Characteristic . . . . . . . . . . . . . . . . . . . . . . . . . . . .
20
3.1.2
IGBT Loss Calculation . . . . . . . . . . . . . . . . . . . . . . . . . . . . . . . .
22
3.1.3
Snubber Circuit . . . . . . . . . . . . . . . . . . . . . . . . . . . . . . . . . . . .
26
Diode . . . . . . . . . . . . . . . . . . . . . . . . . . . . . . . . . . . . . . . . . . . . .
28
3.2.1
Diode Characteristic . . . . . . . . . . . . . . . . . . . . . . . . . . . . . . . . .
28
3.2.2
Diode Loss Calculation . . . . . . . . . . . . . . . . . . . . . . . . . . . . . . . .
30
Transformer . . . . . . . . . . . . . . . . . . . . . . . . . . . . . . . . . . . . . . . . . .
32 vii
Contents
3.4
3.3.1
Basic Magnetic Theories . . . . . . . . . . . . . . . . . . . . . . . . . . . . . . .
32
3.3.2
Core Material Selection . . . . . . . . . . . . . . . . . . . . . . . . . . . . . . .
33
Output Filter . . . . . . . . . . . . . . . . . . . . . . . . . . . . . . . . . . . . . . . . . .
35
4 Design of the DC-DC Fullbridge Converter 4.1
Component selection in this project . . . . . . . . . . . . . . . . . . . . . . . . . . . . .
39
4.1.1
IGBT Selection . . . . . . . . . . . . . . . . . . . . . . . . . . . . . . . . . . . .
40
4.1.2
Diode Selection . . . . . . . . . . . . . . . . . . . . . . . . . . . . . . . . . . . .
41
Resonant Components for Soft Switching . . . . . . . . . . . . . . . . . . . . . . . . . .
43
4.2.1
Design of the Snubber Circuit . . . . . . . . . . . . . . . . . . . . . . . . . . . .
43
4.2.2
Evaluation of the Converter for Different Load Conditions . . . . . . . . . . . . .
48
4.3
The Output Filter Inductor Design . . . . . . . . . . . . . . . . . . . . . . . . . . . . . .
49
4.4
Loss Calculation . . . . . . . . . . . . . . . . . . . . . . . . . . . . . . . . . . . . . . .
54
4.4.1
IGBT and Diode Loss Calculation . . . . . . . . . . . . . . . . . . . . . . . . . .
54
4.4.2
Transformer . . . . . . . . . . . . . . . . . . . . . . . . . . . . . . . . . . . . . .
59
4.4.3
The Output Filter Inductor . . . . . . . . . . . . . . . . . . . . . . . . . . . . . .
62
Comparison and total results . . . . . . . . . . . . . . . . . . . . . . . . . . . . . . . . .
63
4.5.1
Comparison between semiconductor losses . . . . . . . . . . . . . . . . . . . . .
63
4.5.2
Comparison Between Converter Magnetic Components . . . . . . . . . . . . . . .
64
4.5.3
Total Efficiency of the Converter . . . . . . . . . . . . . . . . . . . . . . . . . . .
64
4.2
4.5
5 Simulation Setup 5.1
Fullbridge Converter . . . . . . . . . . . . . . . . . . . . . . . . . . . . . . . . . . . . .
6 Conclusions and Future Work
69 69 81
6.1
Results from Present Work . . . . . . . . . . . . . . . . . . . . . . . . . . . . . . . . . .
81
6.2
Future Work . . . . . . . . . . . . . . . . . . . . . . . . . . . . . . . . . . . . . . . . . .
83
7 Appendix 7.1
Paper . . . . . . . . . . . . . . . . . . . . . . . . . . . . . . . . . . . . . . . . . . . . .
References
viii
39
85 85 93
Chapter 1
Introduction 1.1 Problem Background Today’s world is moving toward replacing fossil fuels with renewable energy resources and undoubtedly, wind power is coming as an important energy source. Since the efficiency of the wind energy systems has been improved in recent decades, and its completely clean energy, wind power has become a suitable complement for the fossil fuels and non-renewable energy sources. An attractive option to use wind energy, is to build large offshore wind farms instead of building small onshore units. There are several advantages with the offshore wind farms, usually the average wind speed is higher out in the sea so the cost of electricity production would be less, also lack of the space and environmental impacts of wind turbines is a problem for offshore installations. For all the offshore installations, cable transmission is the only solution [1]. In the case with long distances, it is not reasonable to use AC cable transmission and high voltage direct current(HVDC) cable transmission is usually considered [2]. If a HVDC system would be used instead of a AC transmission system in a wind farm, the traditional 50 Hz transformers could be replaced with DC-DC converters including medium or high frequency transformers. Also the AC cables should be replaced with DC cables. For wind farms, and especially for offshore locations, the weight of the components is an important issue; the weight of the medium frequency transformers in the DC-DC converters is significantly lower than the weight of an equivalent traditional 50 Hz transformers. Also, the DC cables have lower losses than the AC cables and there is no limitation for the transmission distance. Today, the key component for the HVDC cable transmission is the DC-DC converters. It changes the ratio between the input and output voltages and currents by using power 1
Chapter 1. Introduction
electronics, and of course with the help of passive components. Today, low power DCDC converters are common and make up for a major part of the turn-over in the power electronics market while high power and high voltage DC-DC converters in the MW range are not yet readily available on the market.
1.2 Previous Work Most of the earlier studies on DC solutions for wind farms studied the possibility of using HVDC as transmission system. The losses and cost of a DC transmission has been compared to conventional AC transmission systems. The previous studies came to the conclusion that for the long distances DC transmission system has lower losses and lower cost in comparison with AC systems. As it was mentioned earlier, one of the key components in the HVDC transmission is the DC-DC converters which play the role of transformers in AC systems [3]. In previous studies, different topologies for the DC-DC converters has been studied, however a few studies has been done for high power DC-DC converters. This is due to lower demand for the high power converters. To reduce the weight and the size of the converters high switching frequency is required. Higher frequencies results in higher switching losses which leads lots of studies to be done in using soft switching technics [2]. Moreover, different switching patterns has been investigated for controlling the switches of the converter like PWM, phase shift.
1.3 Purpose This thesis focuses on the high voltage and high power DC-DC converters, and two different DC-DC converter topologies in wind farm applications are discussed. The objective of this thesis is to compare two different DC-DC fullbridge converter topologies for a high voltage and high power application, like a wind park transmission system. Also, reduction of the losses in high power and high voltage DC-DC converters by using soft switching technic is a target to study. The variations in the input and output voltage ratio makes the topology design a great challenge. An area of research itself is high frequency, high power and high voltage transformers, which are an essential component in DC-DC converters for the wind farms. In addition, the mechanisms for the losses, stray capacitances in the windings and the leakage inductance of the transformer have to be determined. It is obvious that simulations will be done only for the DC-DC converter topologies, not for the DC grid. 2
1.3. Purpose
A part of the present work is to study previous materials; also make a model in power system block set in Simulink for the DC-DC-converter assuming an ideal magnetic material. Finally, make the design using available power electronic semiconductor components, and determine the losses for the two topologies.
3
Chapter 1. Introduction
4
Chapter 2
DC-DC Converter Topologies One of the topologies that is used for converting DC voltage at a specific level to another level is the fullbridge converter.The topology of the fullbridge converter is shown in Fig. 2.1.
Fig. 2.1 Fullbridge converter topology
The four IGBT switches transform an DC input voltage to a square wave voltage, this square wave voltage is transformed to a higher voltage level in the transformer. After that, the square wave with the high voltage level will be rectified in the output diode rectifier at the secondary side. This converter is classified in the primary switch converter family since there is an isolation between input and output. One of the most important things about the fullbridge converter is the control of its switches. The easiest method is using the duty cycle control; in this method, the output voltage is proportional to the duty cycle. This method causes high switching losses and affects the efficiency of the converter [4]. The second method is called phase-shift control, in this method each leg controlled individually. The operation of the fullbridge converter with these two methods will be discussed in the following. 5
Chapter 2. DC-DC Converter Topologies
2.1 Fullbridge DC-DC Converter 2.1.1 Duty Cycle Control In the fullbridge converter with duty cycle control, the voltage across the transformer in on-state where the switches in the two legs are on is equal to the input voltage. And in off-state where all the switches are off, the load current freewheels in the output diodes, this gives zero voltage across the transformer. Based on this explanation, the mean voltage across the transformer in duty cycle control is equal to the output voltage divided by the transformer ratio [4]. The operation principle of the fullbridge converter with duty cycle control is shown in Fig. 2.1.1. For t < t1 , all the switches are off and the load current flows through the output diodes as it is shown in Fig. 2.2(a), this state is called passive state. The active state starts by switching on S2 and S3 at t = t1 , this has been shown in Fig. 2.2(b). It takes a while for the current to reach the load current, after that the output bridge is not short circuited anymore as in Fig. 2.2(c), and the current stays constant. At t = t3 switches S2 and S3 are turned off and the current starts decreasing but due to leakage inductance of the transformer it takes some time for the current to reach zero, so the current is forced to flow through D1 and D4 until the current reaches zero Fig. 2.2(d). When the current reached zero at t = t4 , all the switches are off and the load current flow through the output bridge, as is shown in Fig. 2.2(e). The next half period starts at t = t5 as the same way [4]. The idealized current and voltage waveforms for the switches and transformer in duty cycle control mode are shown in Fig. 2.3 and Fig. 2.4. The relation between the input and output voltage is expressed as
n1 Vo =2 D Vi n2
(2.1)
2.1.2 Phase Shift Control Another way to control the switches in the fullbridge converter is to use the phase-shift control method. In this method, each leg of the converter is operated at 50 percent of the period, this means that the top switch is on for half of the period and the bottom switch is on for the other half of the period. The output of each leg is equal to the input voltage in half of the period and for rest of the period is equal to zero. By changing the phase between these two voltages, the voltage to the transformer can be controlled. The definition of the phase shift and the operation of the phase-shift control is shown in Fig. 2.5 and Fig.2.6. 6
2.2. Resonant DC-DC Converters
(a) Switches are of, t < t1
(b) S2 and S3 are on, t1 < t < t2
(c) S2 and S3 are on, t2 < t < t3
(d) D1 and D4 are conducting, t3 < t < t4
(e) Switches are of, t4 < t < t5
Fig. 2.2 The operation principle of a fullbridge converter with duty cycle control.
The phase shift variable φ is defined as [5] φ=
(t1 − t0 ) 0≤φ≤1 (TS /2)
(2.2)
Also conversion ratio is defined as:
M(φ) =
VLoad = nφ Vd
(2.3)
2.2 Resonant DC-DC Converters Switching frequencies in the range of kHz is used to reduce the size and the weight of transformer and filter components, in this way the size of the converter can be reduced. 7
Chapter 2. DC-DC Converter Topologies
Figure 2.3: The voltage and current of the switches for duty cycle control(D = 0.4)
Figure 2.4: Voltage and current of the transformer for duty cycle control
To reduce the cost as well as the size, problems occur with an increase in switching frequency such as high switching losses, high switch stress and etc that should be solved. The topologies discussed in the previous section, are classified as hard switching DC-DC converters. Since the entire load current switches on and off during each period, there are high switching losses in these types of converters as well as switch stresses and the EMI(electromagnetic interface). By using soft switching converters, the switches can change state in zero current and/or zero voltage condition. There are different topologies for achieving soft switching, most of them use an LC tank to achieve this, while snubber circuit in other topologies results in soft switching [5]. The two most important topologies of resonant converters are • Load resonant converters • Resonant switch converters In load resonant converters, an LC tank is used to make the voltage and the current to oscillate, therefore the converter switches can be turned on and off at zero voltage and/or zero current. Resonant switch converters use resonant elements to shape the voltage across the switches and current through them. 8
2.2. Resonant DC-DC Converters
Fig. 2.5 Definition of the phase shift control concept
2.2.1 Load Resonant Converter As it was mentioned above, load resonant converters use an LC tank which can be a series LC tank, a parallel LC tank or a combination of series and parallel. The LC tank shapes the switch voltage and current to provide zero voltage and/or zero current switching. The relation between switching frequency and resonant frequencies will result in three different operation modes [4].
Switching F requency(Ws) = 2πfsw
(2.4)
1 LC
(2.5)
Resonant F requency(Wr ) = √
There are three different operation modes for load resonant converters which are • Discontinuous-conduction mode (DCM) : Ws < 1/2W0 • Continuous-conduction mode (CCM):1/2W0 < Ws < W0 • Continuous-conduction mode: Ws > W0 9
Chapter 2. DC-DC Converter Topologies
(a) S2 and S3 are on
(b) S2 and S4 are on
(c) S1 and S3 are on
(d) S1 and S4 are conducting
Fig. 2.6 Operation principle of a fullbridge converter with phase shift control.
Fig. 2.7 Series-loaded resonant DC-DC converter topology
Series-loaded Resonant DC-DC Converters
In this topology, as shown in Fig. 2.7, the output load appears in series with the resonant tank. As a consequence, these converters appear as a current source to the load, i.e. they are not well-suited for multiple outputs. In return, this converters possess inherent shortcircuit protection capability. Without transformer, this converters can only operate as a step-down converter [4]. For Discontinuous-conduction mode (DCM): Ws < 1/2W0 ; current is forced to flow through the inductor and commutates to the diodes that are antiparallel to each switch,then no voltage appears over the switch during turn off. It means that the switches turn off at zero current and zero voltage. Because of the DCM operation, the turn on of switches occur in zero current, but not at zero voltage. Large peak current and high conducting losses are disadvantages of operation in this mode. 10
2.2. Resonant DC-DC Converters
For Continuous-conduction mode (CCM): 1/2W0 < Ws < W0 ; the switches turn on at a finite current and at a finite voltage, thus resulting in a turn on switching losses. The turn on occurs naturally at zero current and at zero voltage then there is not turn off losses. For Continuous-conduction mode (CCM): Ws > W0 ; the switches turn on at finite current, but they are turned on at zero current and zero voltage. The possible turn on losses in the switches can be eliminated by connecting a snubber consisting of a capacitor in parallel with each switch. Parallel-loaded Resonant DC-DC Converters
The topology of this converter is shown in Fig. 2.7.
Fig. 2.8 Parallel-loaded resonant DC-DC Converter topology
This type of converter has the same operation as series-loaded resonant converters, but the output of this converter is connected in parallel with the resonant tank circuit. So, these converters appear as voltage source and will be more suitable for multiple outputs. On the other hand, parallel-loaded resonant converters do not possess short circuit protection and peak inductor current, and peak capacitance voltage can be several times higher than the load current and input voltage [4]. For Discontinuous-conduction mode (DCM):Ws < 1/2W0; the current of inductor and voltage of the capacitor cross zero when the switch is turned off and because of discontinuous operation turn on of switches will be done when current and voltage are zero. Consequently, there are no switching losses. For Continuous-conduction mode (CCM): 1/2W0 < Ws < W0 ; there is turn on losses in this operating mode, because both the voltage of the capacitor and the current of the inductor become continuous. However, there are no turn on losses in the switches since the reverse current of inductor commutates naturally to the antiparallel diodes, then the current and voltage of the switches cross zero. For Continuous-conduction mode (CCM): Ws > W0 ; there are no turn on losses because of natural commutation of the antiparallel diodes, the same as for the previous case. 11
Chapter 2. DC-DC Converter Topologies
But the switches are turned off at finite current and voltage then there are turn off losses, these losses can be eliminated by adding a snubber, such as a parallel capacitance for switches. Hybrid-Resonant DC-DC Converters
This type of converter combines the characteristics of the series resonant and parallel resonant converters. There are different arrangements for the hybrid-resonant converters, but only the arrangement shown in Fig. 2.9 is considered [6].
Fig. 2.9 Hybrid-resonant DC-DC converter topology
As it is shown in Fig. 2.9, the topology of this type of converter is like the series-loaded resonant converters with one capacitor CP in parallel with the transformer. This converter behaves like a series resonant converter at low frequencies and like a parallel resonant converter at higher frequencies. However there are some disadvantages in this converter; the need of a wide frequency range makes the dimensioning of passive components difficult, it means that large resonant inductance and capacitance are needed. Nevertheless, its easy controllability made this converter popular in high-frequency high voltage applications [6].
2.2.2 Resonant Switch Converter Resonant switch converters use resonant elements to shape voltage across the switches and current through them. These elements are inductors, such as the transformer stray inductance and capacitors, like the output capacitance of a semiconductor switch. In the case, when parasitic elements of the converter devices that are not large enough, resonant components can be put in series or parallel with the devices for compensation. When the MOSFET is used as a switch, its output capacitor can be used to achieve soft switching, but when the IGBT is used, this capacitor is too low and a snubber capacitor should be used in parallel with the IGBT [7]. 12
2.2. Resonant DC-DC Converters Single Active Bridge DC-DC Converters(SAB)
In this type of converters, a controllable fullbridge IGBT inverter on the primary side is connected via a high-frequency transformer to a fullbridge diode rectifier, this has been shown in Fig. 2.10. For this converter, soft switching is obtained by means of resonance between snubber capacitors, stray inductance and magnetizing inductance of the transformer. The snubber capacitors are used to achieve zero voltage turn off switching [4].
Fig. 2.10 Single active bridge DC-DC converter topology
The single active bridge converter can operate in two different modes, Discontinuous Conduction Mode (DCM) and Continuous Conduction Mode (CCM). In the discontinuous conduction mode; because of snubber capacitors, switches turn off under zero voltage condition and turn on under zero current condition due to discontinuous current flow. In the Continuous conduction mode; switches turn on and turn off under zero voltage condition. turn on of the switches are not at zero current condition since continuous current flows through the freewheeling diodes.
Dual Active Bridge DC-DC Converters (DAB)
This type of converter consists of two active bridges, unlike other cases with one active bridge and one diode rectifier, two active bridges are controllable, and one of them operates in the inversion mode and the other one operates in the rectification mode. More details are shown in Fig. 2.11. Totally, in this topology, eight switches are needed, which makes the control more complex. A further drawback is the higher costs of switches compared to diodes, particularly for high power applications, where several parallel and/or series switches modules are necessary [6]. 13
Chapter 2. DC-DC Converter Topologies
Fig. 2.11 Dual active bridge DC-DC converter topology
Full-Bridge DC-DC Converter with Phase-Shift controlled
The operation principle of the fullbridge converter with phase shift control is similar to the converter with traditional duty cycle control. The input voltage across the transformer is achieved by turning two switches on. The difference is the method of switching control. In this control method, the switching losses can be lowered by the capacitors across the switches which are charged after turn off of a switch and they cause zero voltage during turn on switching. In Fig. 2.12, the inductance Ls include both transformer leakage inductance and the the additional discrete inductance element. Also, for each switch, one lossless snubber is assumed and are shown as C1 , C2, C3 and C4 .
Fig. 2.12 Fullbridge DC-DC Converter with Phase-Shift controlled
In this topology, it can be seen that all the switching occur in soft switching conditions. At turn off, the snubber capacitors cause the voltage rise time of the switches to increase, which results in lower losses. This will be discussed in detail in Section 4.1.3. To achieve soft switching at turn on, the snubber capacitors that were charged during turn off, should be discharged before turning-on. Otherwise, huge amount of current goes through the switches and causes high turn on losses [5]. Actually, there are two different kinds of switching transitions in this type of converter; resonant transition and linear transition. The linear transition occurs under full load cur14
2.2. Resonant DC-DC Converters
rent and the capacitor should be charged even under light load condition. In the linear transition, the leading leg capacitors are charged and discharged. However, the resonant transition depends on the stored energy in the stray inductance of the transformer and in the primary inductor. In the resonant transition, the lagging leg capacitors are charged and discharged. The primary inductor should be calculated carefully to make sure that the resonant transition is finished under desirable current level. In this kind of converters, larger snubber can be used for the leading lag and smaller ones for the lagging lag [8]. The conduction path of the fullbridge converter by phase shift control is shown in Fig.2.13. In this topology, the period that the energy is actively transmitted from the source Vd through the switches and the transformer is called ”passive to active ” and all the other subintervals are called ”active to passive subinterval”. The conducting path can be divided into 10 subinterval that are explained respectively: • Subinterval 1, Q3 and Q2 are conducting and the negative current in primary side of the transformer is nI, where n is the transformer ratio and I is the load current. • Subinterval 2, Q3 is turned off and the current charges the snubber capacitors on the leading leg C3 and C4 . There should be sufficient energy in the output filter inductor to charge the C3 to Vg while the voltage of C4 becomes zero. It should be noticed that the parallel capacitor of Q3 , reduces the voltage rise time and causes lower turn off switching losses. • Subinterval 3, the voltage of C3 reaches to Vd then the diode D4 clamps and Q4 can be turned-on at zero voltage. • Subinterval 4, Q2 is turned off and the current charges the capacitors on the lagging leg C1 and C2 . Ls ,C1 and C2 form a resonant network that rings with approximately sinusoid waveform. There should be sufficient energy in the primary inductance to charge C2 to Vd while C1 voltage becomes zero. • Subinterval 5, the voltage of C2 reaches Vd then D1 clamps and Q1 can be turned-on at zero voltage. • Subinterval 6, Q1 and Q4 are conducting and the positive current in primary side of the transformer is nI. • Subinterval 7, Q4 is turned off and the current charges the snubber capacitors on the leading leg C3 and C4 . It should be sufficient energy in the output filter inductor to charge C4 to Vd while C3 voltage becomes zero. • Subinterval 8, the voltage of C4 reaches Vd then D3 clamps and Q3 can be turned-on at zero voltage. 15
Chapter 2. DC-DC Converter Topologies
• Subinterval 9, Q1 is turned off and the current charges the snubber capacitors on the lagging leg C1 and C2 . Ls ,C1 and C2 form a resonant network that rings with approximately sinusoid waveform. There should be sufficient energy in the primary inductance to charge C1 to Vd while C2 voltage becomes zero. • Subinterval 10, the voltage of C1 reaches Vd then D2 clamps and Q2 can be turned-on at zero voltage. The zero voltage switching allows operation with high reduction in switching losses and also in the stresses. So high switching frequencies can be used in this type of converter. These advantages make this converter well suited for high power, high frequency applications. In addition, the diode turn off losses (reveres recovery losses) are also reduced since the voltage over the diode now slowly become negative so the diode with low losses can move into blocking status. The driving signals for the switches S1 to S4 are explained in Section 2.1.1. Fig. 2.14 shows the formation of the primary side voltage Vp and current Ip of the transformer.
16
2.2. Resonant DC-DC Converters
(a) Subinterval 1
(b) Subinterval 2
(c) Subinterval 3
(d) Subinterval 4
(e) Subinterval 5
(f) Subinterval 6
(g) Subinterval 7
(h) Subinterval 8
(i) Subinterval 9
(j) Subinterval 10
Fig. 2.13 The operation principle of a phase shift control converter.
17
Chapter 2. DC-DC Converter Topologies
Fig. 2.14 Phase shift control-current and voltage waveforms, primary side of transformer
18
Chapter 3
Components of the DC-DC Fullbridge Converter In this chapter the different components of the DC-DC fullbridge converter are explained. First of all the operation of the IGBT with its losses are studied. After that, the effect of the snubber circuits and the soft switching operation mode are discussed. The diodes are some other components of the converter. There are two types of diodes in the converter, one type are called freewheeling diodes that are located in parallel with the IGBT and the second type are located in the secondary side of transformer and are used for rectifying. Further, the operation of diodes and their loss calculation is investigated. The last part is about the output filter. The output filter consists of the inductor and the capacitor that are used to limit the ripple of output current and output voltage. The design of the inductor is mentioned at the end of this chapter.
3.1 IGBT The idea of designing the Insulated Gate Bipolar Transistor (IGBT) cames from characteristics of MOSFETs and BJTs. BJTs have low voltage drop in the on state, but have longer switching times, especially at turn-off. MOSFETs can be turned on and off fast due to large gate impedance, but their on-state conduction losses are higher in comparison with the BJTs in the same ratings [4]. These characteristics led to the combining of BJTs and MOSFETs to achieve a new device with positive characteristics of both MOSFETs and BJTs (low conduction losses and fast switching). Regarding the physical setup IGBTs can be divided in to two groups [4] • Non-punch-through IGBTs (NPT-IGBTs) 19
Chapter 3. Components of the DC-DC Fullbridge Converter
• Punch-through IGBTs (PT-IGBTs) A circuit symbols for an n-channel IGBT are shown in the following Fig. 3.1:
Fig. 3.1 Symbol of an IGBT
The i-v characteristic of the IGBT, Fig. 3.2, shows that the controlling parameter is an input voltage(the gate-source voltage) rather than an input current. So IGBTs are called voltage control devices.
Fig. 3.2 IGBT characteristic
The transfer curve iD − VGS is shown in Fig. 3.3, if VGS is less than threshold voltage VGS (th), the IGBT is in the off state. The maximum voltage that should be applied to the gate-source terminal is usually limited by the maximum drain current that should be permitted to flow in the IGBT. 3.1.1 IGBT operation Characteristic On-State Operation
In this part the voltage drop over the drain and source during conduction will be discussed. The equivalent circuit for IGBT during normal condition is shown in Fig. 3.4. By using the equivalent circuit VDS (on) can be expressed as 20
3.1. IGBT
Fig. 3.3 i-v curve of an IGBT
VDS (on) = VJ1 + Vdrif t + ID Ron−stand
(3.1)
The voltage drop across the injection junction J1 is like a voltage drop across a normal PN junction. This voltage can be considered to be 0.7-1 V. Vdrif t is much less in the IGBT than in the MOSFET, so the overall voltage drop across the IGBT for high current, is less than in the MOSFET. Turn-on Transient
The voltage and current waveforms of an IGBT in the converter during turn-on is shown in the Fig. 3.5. The turn-on switching period is (tri + tf v1 + tf v2 ) and there is power dissipation during this period. The faster turn-on switching makes less power dissipation in the switch [4]. Turn-off Transient
The voltage and current waveforms of an IGBT in the converter during turn-off is shown in the Fig. 3.6 One of the differences between IGBTs and MOSFETs is in the drain current waveform. In the IGBT, the drain current has two distinct time intervals. There is a rapid current 21
Chapter 3. Components of the DC-DC Fullbridge Converter
Fig. 3.4 Equivalent circuit of an IGBT
drop in tf i1 and the another voltage drop with slower speed is tf i2 . The current tail in the second time interval cause additional power loss during turn-off period, this phenomenon is called tailing [4].
3.1.2 IGBT Loss Calculation There are two types of losses in a IGBT: • Conduction losses due to voltage drop across the IGBT during the conduction state • Switching losses, this type of loss is because of the turn-on and turn-off principle of IGBTs
Ploss = Psw + Pc Psw = Pon + Pof f The calculation of these two types of losses is discussed in the following. 22
(3.2) (3.3)
3.1. IGBT
Fig. 3.5 IGBT i-v curve during turn-on
Fig. 3.6 IGBT i-v curve during turn-off
Conduction loss calculation
In conduction state there is a voltage drop across the IGBT Vce (on), this voltage drop adds a loss to our transistor losses that is called conduction loss. It can be calculated using Pc
1 = T
ZT
Vigbt Iigbt ;
(3.4)
0
Turn-on and Turn-off Loss Calculation
As it shown in Fig. 3.7 and Fig. 3.8 by having different times and the multiple of Ic and Vce the switching losses can be calculated. Times that are mentioned here are on-time, 23
Chapter 3. Components of the DC-DC Fullbridge Converter
off-time, rise time and falling time of the IGBT that are defined as following [9] • tdon : from 10% of Vge to 10% of Ic • tr : from 10% of Ic to 90% of Ic • tdof f : from 90% of Vg e to 90% of Ic • tf : from 90% of Ic to 10% of Ic
Fig. 3.7 Definitions of the turn off parameters for IGBTs
Fig. 3.8 Definitions of the turn on parameters for IGBTs
The needed times consist of off-time, rise time, on-time and fall time and those are mentioned in the data sheet but these quantities should be adjust based on the applied current. 24
3.1. IGBT
For this reason, there is a Fig. 3.9 in one data sheet, where the sufficient value can be achieved as it shown.
Fig. 3.9 Definition of switching time
In the IGBTs data sheet, the manufacturer provide information for the switching loss calculation. These information are the amount of the energy dissipating at each turn-on and turn-off, Eon and Eof f , at a certain reference voltage Vref and reference current Iref . Actually, the power dissipation of the IGBT switching is a function of the operation current, Voltage and temperature. Then, according to a SEMIKRON document [10]
Psw = fsw Esw (I; Vcc; Tj ) ˆ ˆ Vigbt Iigbt )Ki igbt ( )Kv igbt Psw−on = fsw Esw−on ( πIref Vref ˆ ˆ Iigbt Vigbt Psw−of f = fsw Esw−of f ( )Ki igbt ( )Kv igbt πIref Vref
(3.5)
The constant Ki igbt and Kv igbt are 1 and 1.33 respectively, for the IGBT. (3.5) Is used to calculate the switching loss in this project [10]. These procedures are valid for the hard switching method, and to reduce these losses, soft switching methods are used. The soft switching can be achieved by using a snubber in series or parallel of the IGBTs that are explained in next part. 25
Chapter 3. Components of the DC-DC Fullbridge Converter
3.1.3 Snubber Circuit The snubber circuits are used to achieve soft switching in resonant switch converters such as a fullbridge and a single active bridge. By using the snubber capacitors in parallel with the IGBT modules, the turn-off switching losses will reduce significantly. The turn-off snubber reduces turn-off losses by increasing voltage rise time of the IGBT, so high voltage and high current at the same time would be avoided. As it is seen in Fig.3.10 and Fig.3.11, there are two possible topologies for the turn-off snubber. In the first topology, a capacitor is put in parallel with the switch, this type of snubber is called the lossless snubber. This type of the snubber should discharge completely before the turn-off. If this is not done, the capacitor will be short circuited during turn-on and a huge current will flow in the switch. To reduce this huge current, a resistance can be connected in series with the capacitor, this has been shown in Fig. 3.11. The parallel diode with resistance provides the characteristics of a pure capacitance during charging. The negative point with this topology are the losses that are introduced with the resistance [2].
Figure 3.10: Without limited current at turn-on
Figure 3.11: With limited current at turn-on
Hard Switching
A typical hard switching waveform for a switch in the input bridge shown in Fig. 3.12(a) can be seen in Fig. 3.12(b). For the case without snubber circuit (Hard switching) when the switch S1 is on, the load current passes through this switch. To turn off S1 , the voltage across this switch must increase to lower the voltage across S2 so D2 can be forward biased. When D2 is forward biased, the current in S1 starts to decrease. This has been shown in Fig. 3.12(b). As it is seen, we have high voltage and high current at the same time which causes in high turn-off losses. Soft Switching
As it was mentioned earlier, the switching losses at turn-off can be reduced by using a snubber circuit. A turn-off snubber can be connected in parallel with the switch. This type 26
3.1. IGBT
(a) Input bridge of fullbridge DC-DC converter
(b) Typical voltage and current waveforms of an IGBT
Fig. 3.12 Hard switching of an IGBT of the input bridge of fullbridge DC-DC converter
of snubber is used to reduce turn-off losses of IGBTs in the fullbridge converter with phase shift control. The current and voltage waveforms of an IGBT during turn-off with and without snubber is shown in Fig. 3.13(a) and Fig. 3.13(b).
When a turn-off command is sent to the IGBT, the current in the IGBT, which is equal to the load current, starts to decrease immediately, because in this case the current can flow through capacitors C1 and C2 . When the current flows through C1 , the capacitor will be charged so the voltage of the switch increases. This charging current is the difference between the load current and the current flowing through the switch. The capacitor keeps charging until the voltage of the switch reaches its maximum value and D2 starts to conduct. As it is seen, the voltage and current in this case are not high at the same time so a high instantaneous power does not occur.
(a) S2 and S3 are on
(b) S2 and S4 are on
Fig. 3.13 The Voltage and current waveform of an IGBT with snubber
27
Chapter 3. Components of the DC-DC Fullbridge Converter
3.2 Diode 3.2.1 Diode Characteristic A diode is a semiconductor device that conducts electric current in only one direction. The symbol of the diode and its steady state i-v characteristic are shown in Fig. 3.14
Fig. 3.14 Symbol of diode and characteristic
As it is seen, when the diode is forward biased, it begins to conduct with only a small forward voltage across it, which is in the order of 1 volt. When the diode is reversed bias it can be considered that zero current flows through the device. In normal operation condition, the reverse bias voltage should not reach the breakdown rating. In the ideal case, the forward voltage drop can be considered zero and the reverse breakdown voltage can be assumed infinite. The idealized characteristic can be used for analyzing the converter topology but should not be used for the actual design [4]. The diode turns on rapidly so the diode can be considered as an ideal switch at turn-on. However, for turning off the diode, a negative current should flow through the device for a short time, this time is called the reverse-recovery time, to sweep out the excess carriers in the diode and allow it to block a negative polarity voltage. This has been shown in Fig. 3.15. The reverse recovery current Irr and reverse recovery time trr of the diodes increase with increasing the carrier life time. On the other hand by increasing the carrier life time, the forward voltage drop will decrease. Depending on the application requirements, various types of diodes are available: • Schottky diode
The structure of the schottky diode consists of a metal that is used as anode and the N-type semiconductor that is used as cathode. In this type of diode, electrons diffuse from the cathode to the anode because electrons have larger average energy in the semiconductor compared to the metal. Fig. 3.16 shows structure of schottky diode.
28
3.2. Diode
Fig. 3.15 Reverse recovery
Fig. 3.16 schottkydiode
The type of schottky diodes are majority carrier device that do not have storage charge, as a result they have fast switching capability, the reverse recovery time trr and reverse recovery current Irr in the schottky diodes are small in comparison to p-n junction diodes. If the required reverse blocking voltage is less < 100V schottky diodes are preferred over fast recovery diodes. Also compared to p-n junction diodes schottky diodes have very little turn-off transient and almost no turn-on transient time. The scottky diodes have low forward voltage drop, it is between 0.3 to 0.5 volt, also they are limited to their blocking voltage to 50 − 100V . [4]. They are suitable for low voltage very high frequency switching power supply applications. Power schottky diodes with forward current rating in excess of 100A are available [11]. • Fast-recovery diodes
The structure of fast recovery diode is different compared to a schottky diode. One base region between P type and n-type silicon materials was added to make a PI-N silicon. Because of the thin base region and the low reverse recovery charge, 29
Chapter 3. Components of the DC-DC Fullbridge Converter
the trr value is greatly reduced. Also, in this structure the transient forward voltage drop is reduced, the reverse working voltage is increased. Fig. 3.17 shows internal connection in fast recovery diodes.
Fig. 3.17 fastrecoverydiode
The fast recovery diodes are used in high frequency systems when a small reverse recovery time is necessary. Fast recovery diodes offer reduction in both reverse recovery current and reverse recovery time. The reverse recovery time of a fast recovery diode is less than a few microseconds at a power level of several hundreds of volts and several hundreds of amperes [4]. This improvement in turn-off performance has a bad affect on the steady state performance, because the forward voltage drop in a diode is proportional to the drift region width and inversely proportional to the carrier life time. Then when the reverse recovery time and current decrease the forward voltage drop increase. In high voltage high frequency circuits, the overall power loss is dominated by switching loss and fast recovery diodes have faster switching times and less losses. The type of diodes need to be protected against voltage transients during turn-off by using an R-C snubber circuit. The schottky diodes offers non existence recovery time and their forward voltage is nearly half of fast recovery diodes but are not available in high voltage as those of fast recovery diodes. • Line frequency diode The on-state voltage of these diodes is designed to be as low as possible and as a consequence, they have larger trr , which are acceptable for line-frequency applications.
3.2.2 Diode Loss Calculation The diode losses are divided into conducting losses and switching losses, the same as for the other semiconductor devices. The conduction loss of power semiconductors is often calculating by considering a forward voltage drop Von and on-state resistor ron . The 30
3.2. Diode
formula for calculating loss can be written as Pc
1 = T
ZT
Vdiode Idiode
(3.6)
0
The diode switching losses depend on the reverse-recovery time trr of the diode and it occurs during the transition of the diode when the condition of diode is changed from a forward to reverse-biased. When the reverse voltage is applied to the diode, the electrical charges due to the forward current should exit, then a current spike in the opposite direction of the forward current occurs. As a result switching power loss occur, Fig. 3.18 present the changing of current and voltage of diode during switching.
Fig. 3.18 Current and voltage of diode in switching
For calculation, the turn-off losses of diode, the relation found in [10] can be used. Psw = fsw Erec (
ˆ Iout Vˆcc Kv D )K i D ( ) πIref Vref
(3.7) (3.8)
The constant Kv D is 0.6 for diodes, and the constant Ki D should be calculated according to typical diode reverse recovery characteristics, that is explained below. For Ki D calculation some approximation should be done but a linear approximation is not possible because the results would not be accurate enough. Therefore, the beginning and the ending points of the reverse recovery energy curve is selected: beginning Point: (X1 , Y1 ), ending point: (X2 , Y2 ), and based on ( 3.9) the constant Ki D can be calculated. 31
Chapter 3. Components of the DC-DC Fullbridge Converter
(
Y1 X1 K i D ) = X2 Y2
(3.9)
3.3 Transformer Transformers are usually used in the power electronic converters for the purpose of galvanic insulation and also for achieving a desirable voltage level. The transformers that are used for switch mode converters, operate in high frequencies with non-sinusoidal waveforms. Also the size of the transformer has a direct impact on the size of the converter. These characteristics lead to design a high-density power transformer for our full bridge converter [12]. 3.3.1 Basic Magnetic Theories Hysteresis Loop
The relationship between the magnetic flux density B, and the magnetizing force H is expressed by the hysteresis loop as it shown in Fig. 3.19.
Fig. 3.19 Hysteresis Curve
To generate the hysteresis loop, the magnetizing force is changed then the magnetic flux is measured. If the ferromagnetic material has thoroughly demagnetized, by increasing the magnetizing force, it should follow the dashed line. This increasing continue until point ”a”. At point ”a” almost all of magnetics domains are aligned and by additional increase in the force, the flux will increase very little. This point is called magnetic saturated point. After that, when the magnetizing force reduce the curve move to point ”b”. In this point some magnetic flux remain but the magnetizing force is zero. Actually, in this condition some of the magnetic domains remain aligned but some have lost their alignment. This is referred to as the point of retentivity on the graph and indicates the level of residual magnetism in the material. When the magnetizing force is reversed, the curve moves to 32
3.3. Transformer
point”c”. In this point the flux reaches zero. This point is the point of coercivity on the curve. This force that is required to remove the residual magnetism from the material is called the coercive force or coercivity of the material. By increasing the magnetizing force in the negative direction, the material become saturated again in opposite direction, in point ”d”. By reducing the force to zero the curve will reach to point ”e”, and it will have a level of residual magnetism equal to that achieved in the other direction. To reach zero flux, the force should be increased. It should be notice that the curve did not return to the original of the graph because some force is required to remove the residual magnetism. And the curve will take a different path from point ”f” to the saturation point ”a” to complete the loop. Magnetic Core Material
The loss that occurs in the magnetic materials has an important effect on the designing of transformers. So in this part some of the most important materials will be introduced. Iron alloys, this material is made with iron and small amount of other elements like chrome and silicon. Two types of losses exist in these alloys, hysteresis loss and eddy current loss. This type of material has large value of saturation flux density, 1.8 tesla (T ). Iron alloy material usually used for low frequencies, around 2KHz or less for transformers, because of having eddy current loss. To reduce eddy current losses the core must be laminated [4]. Iron powdered and iron powdered alloys are another kind of material that are consist of small iron particles electrically isolated from each other. Because of that, they have a larger resistivity and less eddy current loss than iron alloys material. METGLAS is a group label for amorphous alloys of iron and other transition metals such as cobalt and nickel in combination with boron, silicon and other glass-forming elements. This alloy has a saturation induction of 0.75T at room temperature and 0.65T at 150 siliceous degrees. The electrical resistivity of METGLAS alloys is typically somewhat larger than the most magnetic steels. Amorphous alloys are good candidate core materials for high frequency applications [4]. Ferrites material are basically oxide mixtures of iron and other magnetic elements. They have quite large electrical resistivity but rather low flux density, around 0.3T . Ferrites have only hysteresis loss, and no significant eddy current loss occurs due to high electrical resistivity. This material is used for transformer cores that operate at high frequencies because of low eddy currents [4]. 3.3.2 Core Material Selection Core material selection is an important issue in designing high-density power transformers. So in this chapter a short study of magnetic material characteristic is made. 33
Chapter 3. Components of the DC-DC Fullbridge Converter
A perfect magnetic material has low loss, high saturation density and high permeability. By using this kind of material as core of high frequency transformer, we will have a small size transformer with high efficiency. However, in reality there is no perfect material so a trade off should be done for selecting a material [12]. Magnetic materials are widely used in different applications. These materials are classified based on their magnetic behavior and their uses. Some materials are easily magnetized and demagnetized, these kind of materials are called soft magnetic materials. Some others are difficult to magnetize and demagnetize these are called hard magnetic materials. The soft materials are usually used as material of the transformer core. For selecting a suitable material for a specific application, four characteristics of soft magnetic should study. These characteristics are [12]: • Loss density of core W/cm3 • Saturation flux density (Tesla) • Relative permeability • Temperature characteristics In Fig. 3.20 the development for different soft magnetic materials has been shown.
Fig. 3.20 The development for different soft magnetic materials [12]
As it was mentioned earlier, there are four characteristics that should be considered for selecting core material of transformer. The first one is loss density of the core; Fig. 3.21 shows the core loss density of different materials. 34
3.4. Output Filter
Fig. 3.21 Core loss density of different materials [12]
Finally among all the magnetic materials nanocrystalline and amorphous materials are the first choices for high power-density transformers due to: • Low loss density • High saturation flux density • High relative permeability • Good temperature characteristics
3.4 Output Filter The diode full-bridge rectifier generates high ripples in the current and voltage. Therefore, in order to get a smooth output voltage and current, it is necessary to design an appropriate output filter, Fig. 3.23 shows the schematic of the used output filter [5]. Obviously, the value of the inductor and the capacitor should be calculated based on the rated current and voltage and their ripple limitations. 35
Chapter 3. Components of the DC-DC Fullbridge Converter
Fig. 3.22 LC filtter
The value of the inductor has to be high enough to keep the output current ripple within limits. It is usually acceptable with a current ripple between 5-10 percent of the average load current. Waveform of the inductor current, is shown in Fig. 3.23, the inductor current ripples around output current I0 .
Fig. 3.23 LC filtter waveForm
For calculating the value of the inductor, the parameters are defined as following: Lo is output inductance, Vi is input voltage, Vo is output voltage, n is transformer ratio, D is duty cycle, Fsw is switching frequency, Iripple is current ripple and, Io is output current. The lowest necessary value of the inductance in order to limit the current ripple is calculated as nVi − Vo )(DTsw ) (3.10) Lo = ( IrippleIo The other component of the output filter is the capacitor. The value of the capacitor has to be high enough to keep the output voltage ripple within limits, as it shown in Fig 3.24 voltage across the capacitor can be expressed as Z 1 Vc (t) = Vc (t0 ) + ic (t) (3.11) c 36
3.4. Output Filter
Fig. 3.24 Output voltage of the output filter
According to 3.11, the peak to peak ripple in the output voltage can be calculated
V0
1 = Vc (t0 + Tsw/2 ) − Vc = c
Z
Ic (t) =
Q C
(3.12)
The integration of the capacitor current is equal to the charge put into the capacitor. Fig. 3.25 shows the charge of capacitor, it is marked with grey.
Fig. 3.25 Capacitor current
To calculate the value of capacitor, the parameters are defined as following: Co is output capacitance, Fsw is switching frequency, Iripple is current ripple, Io is output current, Vripple is voltage ripple and Vo is output voltage. Finally, the capacitor size is calculated as Co =
( 2F1sw )(Iripple Io ) 2Vripple Vo
(3.13) 37
Chapter 3. Components of the DC-DC Fullbridge Converter
38
Chapter 4
Design of the DC-DC Fullbridge Converter In this chapter the design of one DC-DC fullbridge converter is discussed. First of all, IGBTs and diodes should be selected and according to their current and voltage the number of modules that are located in series or/and parallel, instead of each switch, is defined. After that, the resonant components are calculated for three different frequencies. Then based on the maximum value of the leakage inductance, three different capacitor are calculated and the relationship between the minimum inductance and percentage of load is shown. In the loss calculation part, the loss of IGBTs, diodes and transformer are calculated for two different topologies and the effect of soft switching is illustrated. In this project the DC-DC fullbridge converter with these specifications will be considered: • Input Voltage:4000V • Output Voltage:6000V • Output Power:2.4MW • Transformer turn ratio:3
4.1 Component selection in this project For this converter, the selection of IGBT, diode, transformer material and the resonant components are discussed. According to the characteristics of IGBT and diodes, that are selected from ABB HiPak, the conduction and switching losses should be calculated. 39
Chapter 4. Design of the DC-DC Fullbridge Converter
For this reason, a scrip is written in MATLAB and the losses are calculated for different frequencies. 4.1.1 IGBT Selection Since the input voltage is 4000V , the maximum applied voltage of each switch is 4000V . And, due to the rating power 2.4MW , the maximum current that goes through it is 600A. According to the voltage and current of the IGBT, different arrangement of the IGBTs can be defined . For this application, the IGBT module 5SNA0650J450300 is selected. In this module when the current is 650A (half of this current value is allowed as maximum rms current) the collector emitter voltage can be 2800V . Based on the voltage and the current of this IGBT, the number of IGBTs that should be located in parallel or/and series, instead of each switch, is defined. By changing the number of IGBTs, the current and the voltage of them are changed and both losses, conducting losses and switching losses are recalculated. In this case, two parallel and two series of this IGBT module are used for each switch position. After the selection of the IGBT module, the characteristics of it, should be specified to calculate the losses. Based on the typical on-state characteristic of the IGBT, the Vceon , onstate voltage drop and Rigbton , resistive component are measured. As it shown in Fig. 4.1 the Rigbton is the slope of curve tangent line and Vceon is the crossing point of tangent line in the Vce axis.
Fig. 4.1 IGBT on stat characteristics
40
4.1. Component selection in this project
The switching loss is an other subject that can be calculated based on the typical switching energies per pule. In Fig. 4.2 the relationship between the IGBT switching current and the energy that is wasted during each turn-on and turn-off is depicted.
Fig. 4.2 Typical switching energies per pulse
In Table 4.1 the selected IGBT with its on-stand voltage drop, on-stand resistance and its switching energies are mentioned. Table 4.1: IGBT module characteristics
ABB HiPak 5SNA 0650J450300
VCE (V) 2800
IC (A) 650
V ceon (V) 1.25
Rigbton 0.011
Eon (J) 2.4
Eof f (J) 2.9
4.1.2 Diode Selection In this converter, the output voltage is 6000V , then the maximum applied voltage to each diode is 3000V . For the rated power 2.4MW , the maximum current that goes through the each diode is 400A. Then, the diode 5SLD0600J650100 is selected from ABB HiPak. This diode module can stand 3600V reverse voltage and 600A forward current, but only half of this current is allowed current. Based on the voltage and the current of each diode, the number of diodes that should be located in parallel or/and series, is defined. By changing the number of diodes, the current and the voltage of them are changed and both losses, conduction losses and switching 41
Chapter 4. Design of the DC-DC Fullbridge Converter
losses are modified, reasonably. In this case, two parallel diode module is used instead of each diode block. After selecting the diode module, the forward voltage VF and the on-state resistance RF of it should be measured by using the typical diode forward characteristics. The typical diode forward characteristic is shown in Fig. 4.3.
Fig. 4.3 Diode on stat characteristics
The switching losses of a diode are approximately the same as the turn-off losses since the turn-on losses are negligible in comparison with the turn-off losses. The power losses at turn-off is depending on reverse recovery characteristic. Fig. 4.4, shows the reverse recovery characteristic of the diode. For the diode 5SLD0600J650100, the constant Ki D is found to be 0.838. The calculation is mentioned below. The beginning Point of typical reverse recovery characteristics: (200, 0.650), The ending point of typical reverse recovery characteristics: (1200, 2.92). y1 x1 (4.1) ( )K i D = x2 y2 2.92 1200 Ki D ) = ( 200 0.650 6Ki D = 4.492 Ki D = 0.838 In Table 4.2, the selected output diode with its forward voltage, on-state resistance and its reverse recovery energy are presented. 42
4.2. Resonant Components for Soft Switching
Fig. 4.4 Diode typical reverse recovery characteristics
Table 4.2: Diode module characteristics
ABB HiPak 5SLD 0600J650100
VR (V) 3600
IF (A) 600
VF (V) 1.2
RF 0.0075
Erec (J) 1.61
Ki D 0.838
For the freewheeling diodes, 5SLD0600J650100 diode from ABB HiPak is selected. The maximum voltage that is applies to these diodes is 4000V and the maximum current that goes through it is 600A. Then two series and two parallel diode should be used together. Other explanations for these diodes are same as the output diodes.
4.2 Resonant Components for Soft Switching 4.2.1 Design of the Snubber Circuit In Chapter 2, the operation of the fullbridge DC-DC converter was discussed and it was mentioned that there are two different transitions in this type of converter, the linear transition and resonant transition. The leading leg snubber capacitors charge through the energy stored in the output filter inductance. And the lagging leg snubber capacitors use energy stored in the leakage inductance of transformer to be charged. It should be taken into account that in some cases additional inductance is needed to put in series with the leakage inductance of transformer to have enough energy stored for achieving soft switching [8]. 43
Chapter 4. Design of the DC-DC Fullbridge Converter Design Criteria
There are some design matters that should be considered when designing of the snubber circuit [8] and [2]. • The first subject that need to be considered is the minimum value of the snubber capacitor that can be used. The time for charging the snubber capacitor should be at least 5 times higher than the fall time of the IGBT current. • The second subject that is very important to take into account is finding a maximum value for the leakage inductance of the transformer. Very large inductances should be avoided due to high duty cycle loss. • The third subject is the maximum value of snubber capacitors. The maximum value for the snubber capacitors of the lagging leg should be calculated based on the maximum leakage inductance. In this thesis, three values for the lagging leg snubber capacitors have been considered. It is obvious that the values for these capacitors should be placed between the calculated maximum and minimum values. • In the forth step, the minimum inductances required to charge capacitors in the pervious item is calculated. • In the last step, the leading lag snubber capacitors will be calculated based on their charging time. To design soft switching components, some basic parameters such as: transformer ratio, duty cycle (in our case phase shift) and input current should be known. These parameters can be calculated by using ( 4.2) and ( 4.3). In our calculation, it is assumed that the current remains constant during on-state.
D=
Vload Vd n
(4.2)
iin =
Pin Vd D
(4.3)
In this thesis, since the input voltage and current are too high, the switches should be consist of several IGBT modules connected in series or parallel. If the voltage, current and the snubber capacitor of the switch are Vsw , Isw and Csw respectively, then the voltage, current and the capacitor of the single IGBT module by considering ns modules in series and np modules in parallel would be according to 44
4.2. Resonant Components for Soft Switching
Vmod =
Itotal ns Vtotal , Imod = and Cmod = Ctotal ns np np
(4.4)
Then the total energy stored in the snubber capacitor can be calculated as 2 1 1 1 ns Vtot 2 2 Wcap = ns np Cmod Vmod = Ctot Vtot = ns np Ctotal 2 2 2 np ns 2
(4.5)
As it was mentioned earlier, the principle of the turn-off snubber capacitor is to increase the rise time of the voltage during turn-off. The snubber capacitor causes a decrease in the switch current and an increase in the switch voltage to start simultaneously. However, to have a very low turn-off losses, the rise time of the voltage should be much more than the fall time of the current. In this thesis, the rise time of the voltage is considered 5 times higher than fall time of the current. This assumption is used for calculating the minimum capacitor that can be used as snubber capacitor. In the Fig. 4.5 trv is considered equal to 5tf i .
Fig. 4.5 Rise time of the voltage and fall time of the current
The minimum snubber capacitor can be calculated by using ( 4.6) where Vd is input voltage and ∆t is equal to 5 ∗ tf i . Also tf i can be obtained from data sheet of the selected IGBT. Cmin =
iin ∆t Vd
(4.6)
The next step in the design of the soft switching components, is to find a maximum value for the leakage inductance of the transformer. It is not reasonable to have a very large leakage inductance to achieve soft switching. Because, the time reversal of the current will be too large in comparison with one period and cause in a high duty cycle loss. To make it clear, let us consider an operation frequency of 1kHz, so the period would be 1000µs. Since there are two current reversal in each period, ∆t should not exceed from 45
Chapter 4. Design of the DC-DC Fullbridge Converter
100µs. So, the duty cycle loss would be limited to 20%. In this thesis, the maximum allowed time for current reversal is considered to be 10% of the whole period. However, the current reversal time should be much lower in reality. So a large leakage inductance will cause the duty cycle loss when the current in the transformer changes direction. The maximum leakage inductance, when the required time for the current to change from iin to −iin is equal to 10% of the whole period, can be calculated by using LSmax =
Vd ∆t 2iin
(4.7)
Based on LSmax calculated in ( 4.7), a maximum value for lagging leg snubber capacitors can be obtained by putting the energy stored in the maximum leakage inductance equal to the energy stored in the capacitors. CSmax =
1 LSmax i2in 2 Vd2
(4.8)
It is seen that two limits are obtained for lagging leg snubber capacitors. Three capacitors was selected between these two limits for each frequency. Table shows the values of selected capacitors in different frequencies. Table 4.3: Lagging leg snubber capacitors for different frequencies Frequencies 500 Hz 1 kHz 2 kHz C1 6.8 µf 3.3 µf 1.5 µf C2 4.7 µf 2.2 µf 1 µf C3 3.3 µf 1.5 µf 0.9 µf
Since the leakage inductance should be able to charge the lagging leg snubber capacitors, the minimum leakage inductances will be calculated based on the lagging lag snubber capacitors. For this purpose the energy stored in the capacitors should be put equal to the energy stored in the leakage inductance. So the minimum inductance is obtained from LSmin = 2
CVd2 i2in
(4.9)
As it is seen in ( 4.9), the energy stored in the leakage inductance should be twice the energy required for charging one snubber capacitor, since two snubber capacitors are connected in series and while one of them is charging, the other one is discharging. The results of the minimum inductances required to achieve soft switching for different frequencies and different snubber capacitors are shown in Fig.4.6. Another design consideration for the snubber capacitors is the time for charging the capacitors of the leading leg. In this thesis, an assumption has been made that the maximum 46
4.2. Resonant Components for Soft Switching
Operation Frequency 500Hz
Operation Frequency 1kHz 4
C=6.8e−6 F C=4.7e−6 F C=3.3e−6 F Max Leakage Inductance
7
Minimum Leakage Inductance [mH]
Minimum Leakage Inductance [mH]
8
6 5 4 3 2 1 0 0.2
0.3
0.4
0.5
0.6
0.7
0.8
0.9
C=3.3e−6 F C=2.2e−6 F C=1.5e−6 F Max Leakage Inductance
3.5 3 2.5 2 1.5 1 0.5 0 0.2
1
0.3
0.4
0.5
Load
0.6
0.7
0.8
0.9
1
Load
(a) Switching frequency 500 Hz
(b) Switching frequency 1 kHz Operation Frequency 2kHz
Minimum Leakage Inductance [mH]
1.8 C=1.5e−6 F C=1e−6 F C=0.9e−6 F Max Leakage Inductance
1.6 1.4 1.2 1 0.8 0.6 0.4 0.2 0 0.2
0.3
0.4
0.5
0.6
0.7
0.8
0.9
1
Load
(c) Switching frequency 2 kHz
Fig. 4.6 Minimum leakage inductance versus load, for different frequencies and different lagging leg snubber capacitors
allowed time for charging the capacitors should be 2% of the whole period. The snubber capacitors of the leading leg can be calculated by using
Cslead =
∆tiin Vd
(4.10)
Where δt is equal to 2% of the whole period. 47
Chapter 4. Design of the DC-DC Fullbridge Converter
4.2.2 Evaluation of the Converter for Different Load Conditions The designed converter should be able to achieve the soft switching for different load conditions. It can be seen in Fig. 4.2.1 that for the best case the converter can achieve soft switching in 60 % of the full load current. It is obvious that the converter does not always work in 60 % of the full load and higher. Therefore some modification should be done in order to make the converter work in at least 20 % of the full load current. Two methods that can be used for this purpose are • Reducing the switching time of the IGBT by decreasing the current fall time. In this method the current fall time of the IGBT during turn-off is decreased by changing the gate resistors. So it is possible to use smaller snubber capacitors in parallel with the switches, the smaller the capacitors can be charged with lower currents. Therefore the performance of the converter is improved in the low load conditions. Fig. 4.7 shows that the change in the current fall time by changing the gate resistance of the IGBT is small so this method is not able to make the converter to work in very low load conditions. • Using a semi-soft fullbridge converter topology. In this topology, the lagging leg of the converter is hard-switched and the leading leg is soft-switched. As it was mentioned earlier, the energy stored in the leakage inductance (in some cases plus some additional inductance). Since this inductance should be kept small to prevent high duty cycle losses, the charging current (proportional to load current) of this inductance should be high and this high current means that it is not possible for the converter to work in the low load. Therefore semi-soft topology is used. The topology of this type of converter is shown in Fig. 4.8.
Fig. 4.7 Switching time of the IGBT vs its gate resistor
48
4.3. The Output Filter Inductor Design
Fig. 4.8 Topology of the semi-soft fullbridge converter
4.3 The Output Filter Inductor Design In this section, the principle of inductor design will be discussed. Also, the output filter inductor will be designed based on the converter ratings. Core material selection, core size and geometry calculation, windings number of turn and the cross section calculation will be discussed in the following. To design the inductor, it should be modeled as an electrical circuit. The electrical circuit for a C-shape inductor core is shown in Fig. 4.9.
Fig. 4.9 Inductor geometry and the equivalent circuit
The equivalent circuit consists of two reluctances, the core reluctance and the air gap reluctance. The core reluctance is much lower than the air gap reluctance and it is negligible. Then the emf can be expressed as
ni = Φℜg
(4.11) 49
Chapter 4. Design of the DC-DC Fullbridge Converter
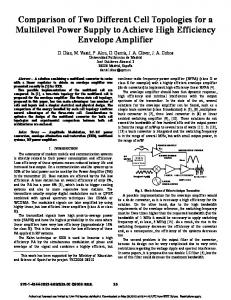
Some quantities should be specified in order to design the inductor. These quantities can be obtained by using calculations and simulations. For our case, the required quantities are shown in the following • L = 9.4mH, 18.7mH, 37.5mH, L is the required inductance of the output filter to keep the ripples in the desired range. The values are for 2kHz, 1kHz and 500Hz operation frequencies respectively. • Idc = 413A, Idc is the average current that passes through the inductor. • Ipeak = 467A, Ipeak is the peak current that passes through the inductor. • Irms = 415A, Irms is the rms current that passes through the inductor. These values has been calculated based on the simulations in Simulink and MATLAB. A C-shaped core has been selected for the inductor core. The inductor geometry and the equivalent magnetic circuit is shown in Fig 4.9. There are some constraints for the inductor design and the selected core and winding should satisfy these constraints. These constraints are discussed in the following By giving a peak winding current, it is expected to the core flux density operate at a peak value Bmax . The saturation flux density Bsat of the core material should be higher than the Bmax .
nImax = (Bmax Ac )ℜg = Bmax
lg µo
(4.12)
(4.12) is the first constraint. The turns ratio n and air gap length lg are unknown. The inductance of the inductor can be calculated as
L =
n2 µo Ac n2 = ℜg lg
(4.13)
(4.13) is the second constraint. The turns ratio n, core area Ac ,and air gap length lg are unknown. Another design constraint is that the total area of the copper in the window nAw , should be less than the available area for the winding conductors, the following inequality should be satisfied in designing the output inductor
Ku WA => nAw 50
(4.14)
4.3. The Output Filter Inductor Design
where Ku is the fraction of the core window area that is filled by copper or fill factor, WA is core window area, n is the turns ratio of the winding, Aw is wire bare area. Ku or fill factor is a constant with a value less than 1. Insulation of the wire and the fact that round wire does not pack perfectly, will reduce Ku . The typical value of Ku for a C-shaped core in design of the inductor is 0.35 [13]. The resistance of the winding can be calculated as
R = ρ
lb AW
(4.15)
where ρ is the resistivity of the conductor material, lb is the length of the wire and can be calculated as
lb = n(MLT )
(4.16)
where MLT is the mean length per turn of the winding . By combining (4.15) and (4.16) the forth constraint can be shown as
R = ρ
n(MLT ) AW
(4.17)
Combining these four constraints, (4.12) (4.13) (4.14) (4.17), and eliminating n,lg andAw will results in 2 A2c WA ρL2 Imax >= 2 MLT Bmax RKu
(4.18)
The specifications and other known quantities are in the right-hand side of (4.18) and the function of the core geometry is in the left-hand side. So in our design, we should choose a core geometry that can satisfy (4.18). For this purpose, the core geometrical constant Kg is defined as
Kg =
A2c WA (MLT )
(4.19)
The number of turns, n, of the inductor can be calculated as 51
Chapter 4. Design of the DC-DC Fullbridge Converter
n =
LImax Bmax Ac
(4.20)
To make (4.18) simple, it can be combined with (4.17) and (4.20),so the following inequality will be obtained. And the selected core must satisfy this inequality. LImax AW Bmax Ku
=< Ac WA
(4.21)
As it can be seen in (4.18), the size of the core can be reduced by choosing a core material having higher Bsat and also by allowing more copper loss. However, if there is no control on the core material and the copper loss, then the larger Kg is needed. Larger Kg can be achieved by increasing Ac and WA which means choosing bigger core. Metglas magnetic alloy 2605SA1 is used as the core material for this inductor. High saturation flux density (1.56 T), low core loss and high permeability make Metglas a suitable core material for the high frequency inductors [14]. Some other values that should be specified for designing the inductor are presented in the following • Wire resistivity ρ = 1.67e− 6 Ω − cm, windings wire is copper. • Peak winding current Imax = 467A. • Inductance L = 0.0094H, 0.0187H, 0.0375H, the values are for 2kHz, 1kHz and 500Hz respectively. • Wire bare areaAW = 210mm2 , AW is calculated by dividing rms current that passes through the inductor by maximum allowed current density. The maximum allowed current density is 2 [A/mm2 ] [4]. • Winding fill factor Ku = 0.35, [13]. • Core maximum flux density Bmax = 1.1T , is considered around 0.75 of the saturation flux density [13]. The selected cores have almost the same size as the transformer core and they have been checked to satisfy the constraints. Table 4.4 shows the core dimensions for three different frequencies. As it was mentioned earlier, one of the important issues in designing the converter is its weight, and weight of the inductor has a direct impact on the total weight of the converter. Weight of the inductor in three different frequencies with Metglas magnetic alloy 2605SA1 as the core material is shown in the following 52
4.3. The Output Filter Inductor Design
Table 4.4: The output filter inductor core dimensions for 500Hz, 1kHz and 2kHz operation frequencies
Operating frequency Core cross section[m2 ] Core window height[m] Core window width[m] Number of turns[m] Air gap length[m] Core losses[kW ] Winding losses[kW ]
500Hz 0.16 0.15 0.4 100 0.053 8.89 2.19
1KHz 0.09 0.15 0.35 88 0.047 11.58 1.43
2KHz 0.04 0.2 0.35 100 0.053 12.58 1.09
3500
3000
Weight[kg]
2500
2000
1500
1000
500
0
500
1000
2000
Frequency[Hz]
Fig. 4.10 Weight of the output filter inductor in 500Hz, 1kHz and 2kHz operating frequencies with Metglas magnetic alloy 2605SA1 as the core material
Since the shape and dimension of the core is known, the core volume can be calculated. By knowing the volume and the density of the core material, core weight can be calculated based on the following equation
W = Vρ
(4.22)
where W is the core weight, V is the volume of the core and ρ is the density of the core material. As it can be seen in Fig.4.10, the weight of the inductor decreases by increase in the operating frequency. So it can be concluded that increase in frequency will reduce the size of the inductor as well as the costs of it. 53
Chapter 4. Design of the DC-DC Fullbridge Converter
4.4 Loss Calculation 4.4.1 IGBT and Diode Loss Calculation In this section, the conduction and the switching losses for the selected IGBTs, freewheeling diodes and output diodes are calculated. The loss calculation is done for two different topologies and the results are shown in figures for comparison. The losses for two different topologies will be calculated, the first case is in hard switching mode and the second case is in soft switching mode. For the hard switching mode, the IGBT losses consist of the conduction loss and the switching loss but for soft switching, only conduction loss is considered. In the hard switching mode, the current and voltage waveforms of the IGBTs, and output diode are shown in Fig. 4.11 and Fig. 4.12. In these figures ∆t1 is the current reversal time of the leakage inductance and tb is the blanking time and Φ is the phase shift angle. The blanking time is defined to prevent the switches that are located in the same leg to be on simultaneously. According to these figures the value of the rms, average and peak of the currents and voltages are measured and the losses are calculated. For the soft switching mode the switching loss for IGBT is neglected and conduction loss is calculated by considering the current wave form and IGBT characteristics. The waveforms of current and voltage of IGTBs and the output diodes in soft switching mode are shown in the Fig. 4.13 and Fig. 4.14. The calculations are done in three different frequencies and the results for hard switching mode, are shown in Fig.4.11, Fig.4.12 and Fig.4.13. Actually, the switching loss increases by increasing the switching frequencies and in higher frequencies the total loss is dominated by the switching loss.
54
4.4. Loss Calculation
Fig. 4.11 Currents and voltages of IGBTs in hard switching mode
Fig. 4.12 Current and voltage of freewheeling diodes in hard switching mode
55
Chapter 4. Design of the DC-DC Fullbridge Converter
Fig. 4.13 Currents and voltages of IGBTs in soft switching mode
Fig. 4.14 Current and voltage of freewheeling diodes in soft switching mode
56
4.4. Loss Calculation
(a) IGBTs and freewheeling diodes losses
(b) Output diodes losses
Fig. 4.15 IGBTs and diodes losses with 500 Hz switching frequency
(a) IGBTs and freewheeling diodes losses
(b) Output diodes losses
Fig. 4.16 IGBTs and diodes losses with 1000 Hz switching frequency
57
Chapter 4. Design of the DC-DC Fullbridge Converter
(a) IGBTs and freewheeling diodes losses
(b) Output diodes losses
Fig. 4.17 IGBTs and diodes losses with 2000 Hz switching frequency
58
4.4. Loss Calculation
The result of the soft switching loss calculations are shown in Fig.4.14, Fig.4.15, Fig.4.16.
(a) IGBTs and freewheeling diodes losses
(b) Output diodes losses
Fig. 4.18 IGBTs and diodes losses with 500 Hz switching frequency
(a) IGBTs and freewheeling diodes losses
(b) Output diodes losses
Fig. 4.19 IGBTs and diodes losses with 1000 Hz switching frequency
4.4.2 Transformer The transformer design and its loss calculation is not the purpose of this thesis. However, losses and accordingly design of the transformer should be known in order to calculate the efficiency of the converter and make our two topologies comparable. In this section, 59
Chapter 4. Design of the DC-DC Fullbridge Converter
(a) IGBTs and freewheeling diodes losses
(b) Output diodes losses
Fig. 4.20 IGBTs and diodes losses with 2000 Hz switching frequency-
a short summery for different methods of loss calculation is mentioned and the results of the transformer design and transformer loss calculations are shown. There are two kinds of losses in a core material, hysteresis losses and eddy current losses. Energy is required to make a change in the magnetization of a core material. Not all of this energy is recoverable in electrical form; a fraction is lost as heat. This power loss can be observed electrically as hysteresis of the B-H loop. A current will be induced in the core materials with electric conductivity, which is called eddy current. This current dissipates power in the core, so there is another core loss that is called eddy current losses. Core Loss Calculation Methods
There are several empirical and macroscopic loss calculation methods that can be found in literatures. Some of these methods are: • Loss separation method: This method calculates the total core losses by calculating the static hysteresis loss and the dynamic eddy current loss which includes classic eddy current loss and excess eddy current loss separately. • Equivalent Elliptical Loop Approach: Is one kind of loss separation methods than can be used in finite element Ansys Maxwell 3D for core loss calculation. • Empirical Steinmetz Equations: This method is the most convenient method to use by designers, because it needs a limited number of measurements and it does not need much knowledge about magnetism. 60
4.4. Loss Calculation
The model and simulation procedure in order to calculate the core dimensions and core loss is the same procedure as [15]. In this procedure, three kind of parameters in the model: system specifications, free parameters and design parameters are defined. First of all, the required parameters from system point of view including primary and secondary voltages, rated power, operating frequency should be specified. The second group of parameters, free parameters, can be selected and varied. Maximum flux density and number of turns in the primary winding are the examples of these group of parameters. At the end, the design parameters include the geometrical values like core and windings dimensions can be calculated from the other two groups parameters. A C-shaped core is selected for the transformer in our converter, Fig. 4.21 shows the geometry of the transformer and its core. Core loss is calculated by using the loss separation method as [15]. Specifications of the transformer and its core loss and winding loss are shown in table 4.21 for three different frequencies. It should be noticed that the ratio of the transformer was considered to be 3.
Fig. 4.21 Transformer geometry
To achieve the highest efficiency, the winding losses have been assumed to be equal to core loss, (4.23) shows that core losses should be equal to winding losses in order to have the highest efficiency [13].
η=
Pout , Pout + Pcore + Pwinding dη =0 gives dPout
2 Pwinding = kPout
(4.23)
Pwinding = Pcore
(4.24) 61
Chapter 4. Design of the DC-DC Fullbridge Converter
Table 4.5: Specifications of designed transformer for different frequencies Frequency 500 Hz 1 kHz 2 kHz Phase Shift 0.5 0.5 0.5 Input Voltage [V ] 4000 4000 4000 Cross Section [m2 ] 0.15 0.07 0.03 Window Height [mm] 98.99 148.49 197.98 Window Width [mm] 386.88 311.52 311.52 Core Losses [kW ] 7.42 10.31 15.42 Core Weight [kg] 2429.02 991.5 452.13 Leakage Inductance [µH] 20.91 14.43 8.94
Fig. 4.22 shows the distribution of the flux density in transformer core.
Fig. 4.22 Flux density distribution in transformer core
4.4.3 The Output Filter Inductor There are two kinds of losses in the magnetic components like the inductors and the transformers. One of them is core losses and another on is the winding losses. In section 4.2.1, the core losses types and their origin was discussed. In this section, the principle of core loss and winding loss calculations will be explained and the total losses for the inductors designed in the previous section will be calculated. Ptotal = Pcu + Pcore
(4.25)
where Pcu is the copper losses and Pcore is the core losses. Copper losses can be calculated using the following equation 62
4.5. Comparison and total results
2 Pcu = RIrms
(4.26)
where Irms is the rms current that passes through the inductor and R is the resistivity of the winding wire that can be calculated like following
R=
ρn(MLT ) AW
(4.27)
where ρ = 1.68e − 8 Ω.m, n is the number of turns, MLT is the mean length turn and AW is the wire cross section. Some manufacturers like Metglas has provided their own formula for core loss calculations. From [16] the core losses can be calculated as Pcore = 6.5f 1.51 B 1.74 W
(4.28)
where f is the frequency in kHz, B is the flux density and W is the weight of the core. Based on the above explanation, values of the core losses and the winding losses of the output filter inductor would be like the following Table 4.6: The output filter inductor core losses for 500Hz, 1kHz and 2kHz operation frequencies
Operating frequency Core losses[kW ] Winding losses[kW ] Total losses[kW ]
500Hz 8.89 2.19 11.08
1KHz 11.58 1.43 13.01
2KHz 12.58 1.09 13.67
4.5 Comparison and total results 4.5.1 Comparison between semiconductor losses In this section, the semiconductor losses of two mentioned converters are compared. As it was shown before, the losses are calculated in three different switching frequencies. Fig. 4.24 and fig. 4.25 show the total losses of the semiconductor devices in the converter in hard-switched and soft-switched mode, respectively. In the hard-switched mode, by increasing the switching frequency the semiconductor losses are dominated by switching losses. But in the soft-switched mode the switching losses of the IGBT are almost zero in three different frequencies. Consequently, the total loss variation between hard-switched mode and soft-switched mode is increased by increasing the switching frequency as is shown in fig. 4.26. 63
Chapter 4. Design of the DC-DC Fullbridge Converter
14
12
Total loss[kW]
10
8
6
4
2
0
500
1000
2000
Frequency[Hz]
Fig. 4.23 Total losses of the output filter inductor in 500Hz, 1kHz and 2kHz operating frequencies
Fig. 4.24 The semiconductor losses in hard-switched mode for three different frequencies
4.5.2 Comparison Between Converter Magnetic Components In this section, losses and weight of the converter magnetic components(transformer and the output filter inductor) will be compared in the three operation frequencies. It is expected that the size of the components reduce by the increase in the frequency but at the same time, the losses of them should be increased. The following figures show this fact 4.5.3 Total Efficiency of the Converter In this part, the total efficiency of the converter in three different frequencies for both mentioned topologies are calculated. From the previous sections, the losses of the IGBTs, freewheeling diodes and output diodes have been calculated and the losses were shown in Section 4.2. Also the losses of the transformer were shown in table4.5. So, the total 64
4.5. Comparison and total results
Fig. 4.25 The semiconductor losses in soft-switched mode for three different frequencies
Fig. 4.26 Caparison between the semiconductor losses in hard-switched and soft-switched mode
efficiency of the converter for the hard switched topology and the zero-voltage switching topology would be as it is shown in Table 6.1 and Table 6.2 respectively.
65
Chapter 4. Design of the DC-DC Fullbridge Converter
7000
6000
Weight[kg]
5000
4000
3000
2000
1000
0
500
1000
2000
Frequency[Hz]
Fig. 4.27 Total weight of the converter magnetic components in 500Hz, 1kHz and 2kHz operating frequencies
Table 4.7: Total losses and efficiency of the converter, hard-switching mode
switching frequency IGBTs losses[W ] Freewheeling diodes[W ] Output diodes[W ] Transformer losses[W ] Inductor losses[W ] Total losses[W ] Efficiency[%]
500Hz 28.48e3 16.52e3 7.37e3 14.8e3 11.08e3 75.25e3 96.8
1KHz 33.83e3 21.52e3 12.6e3 20.6e3 13.01e3 101.56e3 95.7
2KHz 44.56e3 31.53e3 23.05e3 30.8e3 13.67e3 143.61e3 94.01
45 40 35
Losses[kW]
30 25 20 15 10 5 0
500
1000
2000
Frequency[Hz]
Fig. 4.28 Total loss of the converter magnetic components in 500Hz, 1kHz and 2kHz operating frequencies
66
4.5. Comparison and total results
Table 4.8: Total losses and efficiency of the converter, soft-switching mode
switching frequency IGBTs losses[W ] Freewheeling diodes[W ] Output diodes[W ] Transformer losses[W ] Inductor losses[W ] Total losses[W ] Efficiency[%]
500Hz 21.64e3 6.42e3 8.86e3 14.8e3 11.08e3 62.8e3 97.3
1KHz 22.7e3 11.42e3 14.12e3 20.6e3 13.01e3 81.85e3 96.58
2KHz 21.77e3 21.44e3 24.54e3 30.8e3 13.67e3 98.55e3 95.32
67
Chapter 4. Design of the DC-DC Fullbridge Converter
68
Chapter 5
Simulation Setup In this chapter, two topologies of the DC-DC converter are simulated, the fullbridge converter in hard switch mode and the fullbridge converter with phase shifted control. Also the results of simulation are presented in this chapter. The simulations are done in MATLAB.
5.1 Fullbridge Converter In the simulation of the fullbridge converter, it is assumed that all the devices operate ideally and no losses are considered. The internal resistance of the IGBTs and the diodes are set very low. For the transformer, the magnetizing resistance and magnetizing inductance are set very large, and the resistance and inductance of the transformer winding is considered to be negligible. The switching method of IGBTs is phase shift control that was explained in Chapter 2. Fig. 5.1 shows the simulation setup for the fullbridge converter: In these topologies, the inductance and capacitor of the output filter are calculated based on the allowed ripples of the output current and the output voltage. For this purpose, the formulas for calculation of the inductor and capacitor are written in an M-file and the results are used in simulation file. In the simulation the ripple values are limited to Iripple = 0.1Iload
(5.1)
Vripple = 0.01V out For load calculation, the power and the output voltage of the converter should be considered, then the output resistance R is calculated as
R=
V o2 . Po
(5.2) 69
Chapter 5. Simulation Setup
To investigate the operation of the fullbridge converter, the present characteristics are applied in the simulation • Vi = 4000 (Input voltage) • Vo = 6000 (Output voltage) • Po = 2.4e6 (Output power) • Ioripple = 0.1 (Maximum allowed current ripple) • Voripple = 0.01 (Maximum allowed voltage ripple) • Fsw = 1000 (Switching frequency) • n = 3 (Transformer ratio) According to the input and output voltage and the ratio of the transformer, the phase shift angle would be 0.5. However, because of blanking time and voltage drop over the leakage inductance it should be slightly larger. The defined pulse generated that are used for turning on and turning off the IGBTs are shown in Fig.5.2. The wave form of the input current, the input voltage, the output current and the output voltage of the converter are shown in Fig.5.3 The voltage wave formes of the primary and secondary side of the transformer are square wave form and are changed with transformer ration, these voltages are shown in Fig.5.4. The current in the primary side and secondary side of the transformer is shown in Fig.5.4. It is seen that the waveforms are not absolutely square-wave, which is due to the leakage inductance of the transformer. By using the pulse generators, the IGBTs are turned on and turned off. In some intervals the current goes through two IGBTs and in some other intervals current goes through one IGBT and one diode. In this topology, two diodes that are in parallel with the IGBTs 1 and 2 are never used, but the other diodes that are in parallel with IGBT 3,4 conduct when one switch is turned off. The currents and the voltages of the IGBTs in two periods, are shown in Fig.5.5. The output current and the output voltage are DC with some ripples. Fig.5.6 shows the waveforms of the output current and the output voltage. Ripples of the current and the voltage should be limited to 0.1 and 0.01 respectively. By calculation the needed inductor and capacitor the ripples are in the allowed margins as it is shown in Fig.5.6. The second configuration is the phase shift control converter. As it is shown in Fig. 5.7, the turn-off snubber circuit is placed in parallel with the IGBTs, Ls is the leakage inductance of the transformer plus additional inductance which has been calculated in REF to achieve soft switching. 70
5.1. Fullbridge Converter
Waveforms of the voltage and current in both side of the transformer, in the phase shift topology, are shown in Fig.5.8. In this topology, by using snubber capacitors the switching losses are eliminated. The current waveforms of the IGBTs and the voltage waveform of the the capacitors are shown in Fig.5.9. In this topology, when the IGBTs are turned on, the voltage of their parallel capacitance reaches zero and then there are no turn-on switching losses, and when they are turned off their voltage increase based on charging of the parallel capacitors. As a result, the switching losses in this case are neglected.
71
Chapter 5. Simulation Setup
72 Fig. 5.1 Fullbridge converter conFiguration in MATLAB
5.1. Fullbridge Converter
(a) Generated pulses for IGBT 1 and IGBT 2
(b) Generated pulses for IGBT 3 and IGBT 4
Fig. 5.2 Generated pulses for the IGBTs
73
Chapter 5. Simulation Setup
Fig. 5.3 Input and output waveforms of the converter
74
5.1. Fullbridge Converter
Fig. 5.4 Voltage and current of the transformer
75
Chapter 5. Simulation Setup
Fig. 5.5 IGBTs current and voltage waveforms
76
5.1. Fullbridge Converter
Fig. 5.6 The output current and voltage and their ripples
77
Chapter 5. Simulation Setup
Fig. 5.7 Phase shift control DC-DC converter
78
5.1. Fullbridge Converter
Fig. 5.8 The voltages and the currents of transformer-soft switching
79
Chapter 5. Simulation Setup
Fig. 5.9 The IGBTs current and the capacitors waveforms-Soft switching
80
Chapter 6
Conclusions and Future Work In this chapter, results from the present work is summarized. Also, some suggestions for the future work is given.
6.1 Results from Present Work In this thesis, different topologies for the DC-DC converter have been investigated and two of them is selected to design, simulate and evaluate. The selected topologies are the hardswitched fullbridge converter and the fullbridge converter with phase-shift control. These two topologies has been evaluated regarding their efficiencies at the different switching frequencies. The mentioned hard switched and a zero-voltage switching full bridge converter are compared in terms of their losses. Loss evaluation is done for all the switches in the converter as well as for the magnetic components of the converter (transformer and the output filter inductor). Another key point in this thesis is to manage and utilize converter parasitics to achieve soft switching for different load conditions. So, the issue of the snubber design was another important issue during our work. Based on the design and analysis of both hard and soft switching schemes of the high power density DC-DC full bridge converter, it has been concluded that since for the lower frequencies the efficiency is almost the same for the two topologies, hard switched is preferable due to the lower cost. However, for the higher frequencies where the total losses are dominated by the switching losses, the soft switched topology is superior. The core loss of the transformer which was exposed to high frequency square wave excitation has been calculated by using FEM simulation and it turns out that the transformer contribution of the total converter loss is about 30% for all three studied frequencies for the phase shift converter. 81
Chapter 6. Conclusions and Future Work
In the following the circuit diagram of the compared topologies are presented. Also, the type of the selected switches in the input bridge and the output bridge are shown. In addition, the total loss of the converter and the weight of the magnetic components of the converter are mentioned.
Fig. 6.1 First topology, hard-switched
Fig. 6.2 Second topology, soft s-switched
Table 6.1: Total losses and efficiency of the converter, hard-switching mode
switching frequency IGBTs losses[W ] Freewheeling diodes[W ] Output diodes[W ] Transformer losses[W ] Inductor losses[W ] Total losses[W ] Efficiency[%]
500Hz 28.48e3 16.52e3 7.37e3 14.8e3 11.08e3 75.25e3 96.8
1KHz 33.83e3 21.52e3 12.6e3 20.6e3 13.01e3 101.56e3 95.7
2KHz 44.56e3 31.53e3 23.05e3 30.8e3 13.67e3 143.61e3 94.01
According to the voltage and current of the switches, different arrangement of the IGBTs can be defined . For this application, the IGBT module 5SNA0650J450300 is selected. In this module when the current is 650A (half of this current value is allowed as maximum rms current) the collector emitter voltage can be 2800V . For the output bridge the diode 5SLD0600J650100 is selected from the ABB HiPak series. This diode module can 82
6.2. Future Work
Table 6.2: Total losses and efficiency of the converter, soft-switching mode
switching frequency IGBTs losses[W ] Freewheeling diodes[W ] Output diodes[W ] Transformer losses[W ] Inductor losses[W ] Total losses[W ] Efficiency[%]
500Hz 21.64e3 6.42e3 8.86e3 14.8e3 11.08e3 62.8e3 97.3
1KHz 22.7e3 11.42e3 14.12e3 20.6e3 13.01e3 81.85e3 96.58
2KHz 21.77e3 21.44e3 24.54e3 30.8e3 13.67e3 98.55e3 95.32
7000
6000
Weight[kg]
5000
4000
3000
2000
1000
0
500
1000
2000
Frequency[Hz]
Fig. 6.3 Total weight of the converter magnetic components in 500Hz, 1kHz and 2kHz operating frequencies
handle 3600V reverse voltage and 600A forward current, but only half of this current is a suitable choice.
6.2 Future Work As it was mentioned in the Chapter 2, there are different topologies for the DC-DC converters. In this thesis, two of them are selected and compared. It is a good idea to make a comparison of other topologies like the single active bridge converter, dual active bridge converter and etc. There are two general methods to achieve zero-voltage and soft switching. One of them is by using resonant switch converters, which is the selected topology in this thesis. Another one is to achieve soft switching by using load resonant converter. A worthy further investigation is to compare these two resonant converters in terms of their losses, needed components, costs and complexity. 83
Chapter 6. Conclusions and Future Work
Since these converters need to be operated in different load conditions, a suitable topology to achieve soft switching in a wide range of the load conditions is a semi-soft fullbridge converter which is mentioned in chapter 4. A comparison between semi-soft and soft topology can be another interesting topic for research. Since for these kind of investigations the switching transient is very important for the purpose of loss calculations and circuit operation, the software for doing the simulations should have precise and real model of switches (IGBTs, diodes and etc). Our suggestion is to use ANSOFT Simplorer for these kind of simulations.
84
Chapter 7
Appendix 7.1 Paper
85
Chapter 7. Appendix
86
7.1. Paper
87
Chapter 7. Appendix
88
7.1. Paper
89
Chapter 7. Appendix
90
7.1. Paper
91
Chapter 7. Appendix
92
References [1] B. Normark and E. K. Nielsen, “Advanced power electronics for cable connection of offshore wind,” Proc. Copenhagen Offshore Wind, 2005. [2] L. Max, Energy Evaluation for DC/DC Converters in DC-Based Wind Farms, Thesis for the degree of licentiate of engineering. PhD thesis, Department of Energy and Environment Chalmers university of technology, 2007. [3] L. Max, Design and Control of a DC Collection Grid for a Wind Farm, Thesis for the degree of doctor of philosophy. PhD thesis, Department of Energy and Environment Chalmers university of technology, 2009. [4] N. Mohan, T. Undeland, and W. Robbins, Power electronics converters, applications, and design. Wiley, 2 edition, 1995. [5] D. M. Robert W. Erickson, Fundamentals of Power Electronics. Springer Science, 1999. [6] L. Max, “An investigation of diffeerent dc-dc-converters for wind farm applications,” Technical Report, 2005. [7] R. F. J.A.Sabate, V.Vlatkovic and B.H.Cho, “Design considerations for high-voltage high-power full-bridge zero-voltage-switched pwm converter,” IEEE Paper, 1990. [8] A. B. Mehmet Timur Aydemir, “A critical evaluation of high power hard and soft switched isolated dc-dc converters,” IEEE Paper, 2002. [9] R. S. Bjorn Backlund, “Applying igbts,” tech. rep., ABB Switzerland Ltd, 2009. [10] A. Wintrich, “Theory of loss and temprature calculatio,” SEMIKRON, inovation+service, 2008. [11] P. C. Sen, Power Electronics. Tata McGraw Hill Publishing Company Limited, New Delhi, 1987. [12] W. Shen, Design of High-density Transformers for High-frequency High-power Converters. PhD thesis, Blacksburg, Virginia, 2006. 93
References
[13] C. W. T. McLymon, Transformer and Inductor Design Handbook. CRC Press Taylor and Francis Group, 2011. [14] www.metglas.com. [15] T. H. M.A.Bahmani, E.Agheb, “Core loss behaviour in high frequency high power transformers-part i: effect of core topology,” Journal of Renewable and Sustainable Energy, AIP, 2012. [16] http://metglas.com/downloads/powerlite.pdf.
94