misation of one processing component in a fixed design. In this study, we extend .... low a finer CSS, but restrict the crusher's ability to handle coarse feeds (as ...
Edith Cowan University
Research Online ECU Publications
2005
Designing Comminution Circuits with a MultiObjective Evolutionary Algorithm Simon Huband Edith Cowan University
Luigi Barone University of Western Australia
Philip Hingston Edith Cowan University
Lyndon While University of Western Australia
David Tuppurainen Rio Tinto Technical Services, Perth See next page for additional authors
This conference paper was originally published as: Huband, S. , Barone, L., Hingston, P. F., While, L., Tuppurainen, D., & Bearman, T. (2005). Designing Comminution Circuits with a Multi-Objective Evolutionary Algorithm. Proceedings of IEEE Congress on Evolutionary Computation. (pp. 1815-1822). Edinburgh, Scotland. IEEE. Original article available here This Conference Proceeding is posted at Research Online. http://ro.ecu.edu.au/ecuworks/3002
Authors
Simon Huband, Luigi Barone, Philip Hingston, Lyndon While, David Tuppurainen, and Richard Bearman
This conference proceeding is available at Research Online: http://ro.ecu.edu.au/ecuworks/3002
1815
Designing Comminution Circuits with a Multi-Objective Evolutionary Algorithm Simon Huband1, Luigi Barone2, Phil Hingston1, Lyndon While2, David Tuppurainen3, and Richard Bearman3 School of Computer and Information Science, Edith Cowan University, Mount Lawley, 6050, Australia School of Computer Science & Software Engineering, The University of Western Australia, Crawley, 6009, Australia 3 Rio Tinto Technical Services, Perth, 6000, Australia 1
2
Abstract- Mining is an important industry in Australia, contributing billions of dollars to the economy. The performance of a processing plant has a large impact on the profitability of a mining operation, yet plant design decisions are typically guided more by intuition and experience than by analysis. In this paper, we motivate the use of an evolutionary algorithm to aid in the design of such plants. We formalise plant design in terms suitable for application in a multi-objective evolutionary algorithm and create a simulation to assess the performance of candidate solutions. Results show the effectiveness of this approach with our algorithm producing designs superior to those used in practice today, promising significant financial benefits.
1 Introduction In 2001, iron-ore mining was worth AUD $5.2 billion to the state of Western Australia alone [1]. Iron-ore is extracted from the ground and processed (crushed and ground to more usable sizes) in mining processing plants. Crushing and grinding of rocks and other particles is important in other industries too, including fine grinding of coal for power station boilers, coarse crushing of mined ore and quarry rock for use in production-based industries, and for production of paint, ceramics, cement, and other materials. As billions of tons of material is crushed and ground annually, optimisation of crushing operations offers the potential for enormous economic and environmental benefits. For example, Napier-Munn [14] quote a report of the U.S. National Materials Advisory Board which estimated that realistic improvements in size reduction activities could result in energy savings of more than 20 billion kWh per annum. Other benefits to improving the performance of crushing and grinding in mineral processing operations include reduced operating costs, increased throughput and thus value production, and improved downstream performance. Ore processing plants are inherently complex to model, so engineers often rely on simulation tools to evaluate and compare alternative hand-crafted designs. This is a timeconsuming process and the lack of analytical models means that there is little theoretical guidance to narrow the search for better solutions. What is desired instead is some method of automatically searching for good solutions without limiting the design scope at any stage in the synthesis. This is the domain of optimisation. One such optimisation technique is evolutionary algorithms.
0-7803-9363-5/05/$20.00 ©2005 IEEE.
Evolutionary algorithms are increasingly being used in engineering design tasks [10, 5, 15, 4]. Their ability to perform unguided search through vast and complex search spaces makes them ideal for these types of problems that are too complex to solve analytically. In this paper, we describe a study which uses an evolutionary algorithm to optimise the performance of an iron-ore processing plant. In earlier work in this area [1 1, 3, 16], we examined the optimisation of one processing component in a fixed design. In this study, we extend our investigation to examine the problem of concurrently optimising the composition, number of machines to use, and numerical control settings for multiple components in a processing plant. This work offers an intermediary step in developing a technique for optimising the design of an entire plant. The rest of this paper is structured as follows. Section 2 presents a brief background on ore processing plants and a description of the problem we address in this study. Section 3 gives an overview of multi-objective optimisation, introducing the terminology used in this paper. Section 4 describes the essential features of our multi-objective approach to solving the problem of interest. Section 5 presents results of a number of experiments we have conducted that demonstrate the effectiveness of the multi-objective approach, in particular showing that our multi-objective evolutionary algorithm produces solutions superior to those used in practice today. Finally, Section 6 concludes the paper and offers ideas for future work in this area.
2 Comminution The term comminution is used to describe a collection of physical processes that can be applied to a stream of ore to reduce the sizes of the particles in the stream. Many different types of processes are used, including breaking particles into smaller particles by crushers and grinding mills and separating particles into streams of different sizes by screens and classification devices. The purpose of comminution is to transform raw ore into a more usable or
more saleable product or to prepare it for further processing. A comminution circuit consists of a collection of processing units connected together (typically by conveyor belts). Comminution circuits may contain loops, typically re-cycling large particles through crushers until they reach the desired size. One or more streams of ore form the feed stream, entering the circuit typically from some preprocessing stage. One or more streams of transformed ma-
1816
terial exit the circuit as the product stream of the comminution process. More detailed information about comminution is available from Napier-Munn [14]. Figure 1 depicts the comminution circuit examined in this study. The feed stream is the result of a primary crushFeed from Primary Crusher
Isopl
Product Stockpile
Figure 1: The comminution circuit examined in this study
ing stage, entering the circuit at a fixed rate on a conveyor from the top left of the figure. The feed is passed over a scalping screen that allows particles less than the aperture of the screen (the undersize particles) to pass through. Oversize particles greater than the aperture of the screen (and due to the imperfect nature of a screen, some smaller particles) are directed to a secondary crusher. The crushed ore from the secondary crusher is then rejoined with the undersize ore stream before being passed to the product screen. The product screen filters particles less than a given size into a product stockpile, re-directing all oversize particles to a tertiary crusher. The tertiary crusher further crushes the ore, sending the output back to the product screen. The product stockpile is the output from the circuit. The type of crushers used in this circuit are cone crushers. A cone crusher has two parts: an inner rotating crushing surface revolving in an eccentric motion around the central axis of the crusher, and an outer fixed crushing surface. Material is introduced into the crusher from above and is crushed as it flows downwards through the machine due to compression of the inner rotating crushing surface against the outer crushing surface. The gap between the inner rotating crushing surface and the outer fixed crushing surface at the closest point in the cycle is called the closed-side setting (CSS) of the crusher. This setting can be reduced to obtain a narrower chamber and finer crushing, or increased to obtain
a wider chamber and coarser crushing. Cone crushers come in many variants, categorised by three attributes: size, cavity, and head. The size attribute specifies the size of the cone crusher by controlling the size of the housing to employ: possible values include HP100, HP200, HP300, HP400, HP500, and HP800. Bigger crushers tend to be better suited to coarser feeds and have greater capacities (the amount of ore that can pass through the crusher at any given time), but are more expensive. The cavity attribute allows a crusher to be fine-tuned as to the coarseness of its product. Different settings impose different restrictions on the minimum CSS and maximum feed size that the given crusher can handle. Finer values allow a finer CSS, but restrict the crusher's ability to handle coarse feeds (as indicated by a smaller maximum feed size). The cavity attribute can be set to extra-fine, fine, medium, coarse, and extra-coarse. The head attribute also influences the minimum CSS and maximum feed size that a crusher can handle, but compared to cavity, the effect is far more pronounced. Two settings are possible: standard and short, where the latter corresponds to a much finer product than the former. Note that only 43 of the 60 possible combinations of these attributes are valid. For example, an HP100 is incompatible with a head setting of standard - no corresponding "real-world" crusher exists for this combination of settings. When material passes over a screen, the screen separates the ore into two streams: one containing particles less than the aperture of the screen, and another containing particles greater than the aperture (due to imperfections, some smaller particles end up in this stream). The area of the screen dictates the amount of ore the screen can process: larger screens can process more ore, but they cost more to install and to operate. The comminution circuit depicted in Figure 1 contains four separate comminution components (the secondary crusher, the tertiary crusher, the scalping screen, and the product screen). While it is easy to pictorially represent and conceptually understand each component as one physical machine, in practice, due to the large amount of material processed by the circuit, each component is typically replaced by several physical machines all configured the same way and operating in parallel to one another. These parallel machines share the load of the component by splitting the incoming ore stream into several streams and re-directing each separate stream to one of the physical machines. For example, if the final product is required to contain particles all less than some relatively small value (as is typically the case), the product screen and tertiary crusher must be configured for fine-level crushing. Since this will reduce the capacity of the tertiary crusher relative to that of the secondary crusher, several parallel crushers will be needed in the tertiary crushing stage to handle the relatively high volume of ore in the re-cycling ore stream. Once the control variables of the comminution circuit have been decided, the steady-state size distribution of the product stockpile can be determined through simulation. To do this, we have designed and implemented a general1816
1817
purpose framework for connecting together different comminution components using a XML enquiry/set communication system. Empirical models are used to simulate the behaviour of an ore stream as it passes through a crusher or screen. The role of the comminution circuit depicted in Figure 1 is to transform the ore stream generated from a primary crushing stage (the primary crushing stage is responsible for crushing all extraordinary large particles that could cause problems downstream), into a product stockpile suitable for further processing by other comminution processes. This further processing stage requires all particles in its input stream to be smaller than a pre-determined size. Indeed, one of the primary roles of this comminution circuit is to ensure that all particles preserve this constraint. However, to further reduce the demands of this later processing stage, the particles produced by the comminution circuit depicted should be as small as possible. This can obviously be achieved by forcing the crushing components to produce small sized particles by setting low CSS values. This however reduces the capacity of the crushers, forcing the need for a greater number of parallel machines to handle the same load of ore particles as with coarser crushing components. However, this comes at a cost - the more parallel machines used in the comminution circuit, the greater the overall financial cost (setup, maintenance, and operating costs) of the circuit. Obviously, overall cost is to be minimised, so a compromise is needed.
3 Multi-Objective Optimisation Multi-objective optimisation is the task of finding an optimal solution to a problem in which candidate solutions are judged according to multiple criteria that conflict with each other to some degree. Thus, a good solution can be improved on one criterion only by accepting worse performance in at least one other criterion. The aim in multiobjective optimisation is to generate a set of solutions that compromise the different criteria to varying degrees - the solution to be used in any given situation can be selected according to the particular needs of that situation. Without loss of generality, consider a multi-objective optimisation problem defined in terms of a search space of allowed values consisting of parameters and a vector of objective functions mapping parameter vectors into fitness space. Given two vectors a and b, a is said to dominate b iff a is at least as good as b in all objectives and better in at least one. A vector a is non-dominated with respect to a set X iff there is no vector in X that dominates a. A set X is a non-dominated set iff all vectors from X are mutually nondominating. The set of corresponding objective vectors is called the non-dominatedfront. A vector a is Pareto optimal iff a is non-dominated with respect to the set of all possible vectors. Such a vector is characterised by the fact that improvement in any one objective necessarily means a worsening in at least one other objective. The Pareto optimal set is the set of all possible Pareto optimal vectors. The goal of multi-objective optimisation is hence to find this Pareto optimal set, although for 1817
continuous problems a representative subset suffices. Since evolutionary algorithms are population based, the partial order imposed on the search space necessitates the need for an appropriate ranking scheme. Two schemes are commonly employed. Both schemes employ the concept of domination to assign a Pareto rank to individuals - a lower rank implies a superior candidate. In Goldberg's [9] ranking procedure, non-dominated vectors are assigned a rank of 0 while any dominated vector a in the population X is assigned a rank equal to one plus that of the highest-ranked vector from X that dominates a. In contrast, Fonseca and Fleming propose a scheme [7] in which a dominated vector a in the population X is assigned a rank equal to the number of vectors in X that dominate a. It is this Pareto rank, rather than some (weighted) combination of the objectives, that is used as the basis for selection in a multi-objective evolutionary algorithm.
4 Our Multi-Objective Approach The problem outlined in Section 2 is well suited to optimisation by an evolutionary algorithm. The problem cannot be described analytically, but a simulation is available that can be used to evaluate the performance of a candidate solution. The search space is vast - too large for an exhaustive search - and there is little to guide a comminution engineer in determining good solutions for a particular scenario. Indeed, new designs for circuits are typically adapted from existing "similar" designs using intuition, yet can still take many weeks to fine-tune and finalise. An evolutionary algorithm takes significantly less time to explore a greater range of potential solutions. Additionally, the non-biased nature of an evolutionary algorithms allows for exploration of new solutions that comminution engineers may not consider due to the inherent time and risk associated with doing so. The task of assessing the performance of the comminution circuit in question considers two different objectives: the minimisation of the size of particles in the resultant product, while minimising the overall cost of the circuit. This is hence a multi-objective problem - the quality of the comminution circuit is assessed on two potentially conflicting measures. Being a multi-objective problem, the aim then is to generate the Pareto front of solutions that compromise the two criteria to varying degrees. This requirement fits well with the basic model of an evolutionary algorithm, where a population of solutions is evolved under the influence of a fitness function. We combine these two features together to use a so called multi-objective evolutionary algorithm to optimise the composition, number of machines to use, and numerical control settings for the components making up the comminution circuit. 4.1 Representation The first step in designing an evolutionary algorithm is determining a representation for candidate solutions suitable for manipulation by genetic operations. Recalling the discussion of Section 2, each of the two crushing components represented in the comminution circuit are controlled by
1818
three variables: 1. a crusher identifier that determines which of the 43 "real" crushers is used, 2. a real-valued closed-side setting that controls the size of the resultant crushed ore stream, and 3. an integer count of how many parallel crushers are used in that position in the circuit (the unit count). Each of the two screens is controlled by three variables: 1. a real-valued aperture setting that controls the size of particles that are allowed to pass through the screen, 2. a real-valued area setting that controls the size of the screen, and 3. an integer count of how many parallel screens are used in that position in the circuit (the unit count). Consequently, the behaviour of the comminution circuit is controlled by a total of 12 values, three for each of the four comminution components in the circuit. It is these 12 values that we will optimise via an evolutionary algorithm.
4.2 Objectives The performance of the comminution circuit is assessed on two criteria: 1. the size of the product, and 2. the overall cost of the circuit. As described in Section 2, we want to minimise the size of the particles produced in the product ore stream. Specifically, we define P80 to be a measure of the size of the 80th percentile in the product (i.e. the size k mm such that 80% of the product is smaller than k mm). Cast in these terms, the first objective in evaluating the performance of a comminution circuit is the minimisation of P80. The overall cost of the comminution circuit depends on the cost of each component used in the circuit. The cost of a crushing machine depends on the variant of crusher used. The cost of a screen depends on its mass, which is directly proportional to its area. Recalling that each component in the comminution circuit can be replaced with a number of physical machines operating in parallel, the cost of each component obviously depends on the number of physical machines used. Component cost is however non-linear with respect to the number of physical machines due to the more-complex layout and the extra conveyors needed. For a component c with a unit count of n., the cost of the component is modelled by: component cost, = n, x machine cost, x (0.9 + 0.1nc) Thus if n, = 11, the cost of the component doubles. The total cost of the circuit is then the sum of all the components making up the circuit. Cast in these terms, the second objective in evaluating the performance of a comminution circuit is the minimisation of total cost. 4.3 Infeasibility Not all combinations of the 12 parameters controlling the behaviour of the comminution circuit will produce valid solutions. Indeed, experimentation shows that most random
combinations yield invalid (or infeasible) solutions. For example, if the CSS of a crusher is restrictively small, the crusher may completely fill up with ore particles and not be able to handle the amount of ore being fed into the machine. In this situation, the crusher is said to have reached its choked capacity - additional ore particles overflow the crusher, spilling out of the machine. Additionally, ore particles re-directed to the crusher may simply be too large to enter the crusher (i.e., bigger than the maximum feed size of the crusher variant), blocking the entrance of the crusher, effectively "jamming" the machine. Recall that the comminution circuit in question is designed to ensure that all particles in the product stockpile are less than a pre-determined size. If the aperture of the product screen is too large, particles larger than this predetermined size may be allowed through the product stockpile and cause problems downstream in the further processing stage. This constraint violation also needs to be avoided. Detecting these infeasible solutions is relatively simple. However, not all infeasible solutions are equally as bad as one another. For example, a circuit producing only a small amount of ore above the pre-defined maximum is better than a circuit that produces a large amount of overflowing ore. To allow the evolutionary algorithm to progress, we need some way of promoting the "less bad" solutions over the others. To accomplish this, we collect together these error situations into a single measure - a measure of how infeasible the comminution circuit is - and require the evolutionary algorithm to attempt to minimise this measure. We do this with a third objective in the evaluation function of a candidate solution. That is, the performance of the comminution circuit is additionally assessed on a third criteria: the error measure of the circuit. The error measure of the circuit is a weighted sum of the three possible error scenarios described above, and is calculated as follows: error = oversize productI
+10
(E Ioverflow,I + c E
c
E c E-
C,
Ioversize feedcl)
where C is the set of components in the comminution circuit (secondary crusher, tertiary crusher, scalping screen, and product screen) and C' is the set of crusher components in the circuit (secondary crusher and tertiary crusher). Cast in these terms, the third objective in evaluating the performance of a comminution circuit is the minimisation of the error value of the circuit. Indeed, we are only ever interested in comminution circuits where the error value is zero - a non-zero value indicates violation of a constraint imposed by the problem specification. 4.4 Algorithm details The multi-objective evolutionary algorithm we use in this work is a hybrid of our ESP algorithm [12] and NSGAII [6]. Table 1 summarises the settings used. One property of the selection operation requires special mention. Being a multi-objective evolutionary algorithm, selection is primarily based upon Pareto rank. Inevitably 1818
1819
Aspect Encoding A
--
Strategy/Setting d-i
le,
I.-
-T-12 parameters: a mixture of crusher identifiers, real-valued machine settings, and integer unit counts. Population size (/i) 100 Child population size (A) 100 Total generations 1000 Child population creation Since p = A, the child population is created by cloning the parent population and then applying the genetic operators. Recombination Uniforn crossover variant with probability p = 0.8. Unique pairs of individuals randomly swap their decision variables. Mutation Each parameter is mutated with probability p = 0.5. Parameter mutation - crusher identifiers: switch to one of the "neighbouring" crusher variants (a crusher variant which is different in only one attribute). real-valued machine settings: NSGA-ll's polynomial mutation variant [6] with distribution index d = 50, constrained to the valid operating range of the machine. - integer unit counts: NSGA-II's polynomial mutation variant [6] with distribution index d = 10, constrained to the range 1.20. Crusher identifiers are mutated first. Machine settings are constrained to the valid operating range of the mutated machine variant. Ranking scheme Goldberg's non-dominated ranking procedure [9]. Selection After removing identical solutions, candidates are sorted by Pareto rank. Candidates tied in Pareto rank are sorted by lower error. Remaining ties are broken by higher age. The best 50% of the population is retained. -
Table 1: The settings used in the multi-objective evolutionary algorithm used in this study
though, at some stage in the algorithm, the evolutionary algorithm will be forced to select between candidate solutions with the same rank (i.e., choose a subset of all candidate solutions with the same rank). In this case, we use the third (error) objective to resolve the choice candidate solutions with a lower error value are selected over solutions with a higher error value. Any subsequent ties are separated by age, with preference given to those solutions that have survived the longest. 5
Experimental Results
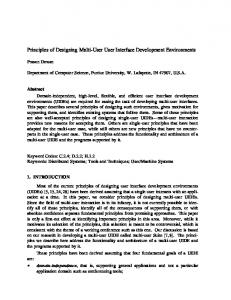
In this section, we present results of a series of experiments with our multi-objective evolutionary algorithm in optimising the composition, number, and numerical control settings of the comminution components of the circuit depicted in Figure 1. We use two measures to assess the quality of the solutions produced: 1. Attainment surface the boundary in objective space formed by the obtained front, which separates the region dominated by the obtained solutions from the region that is not dominated [8]. Multiple attainment surfaces can be superimposed and interpreted probabilistically. For example, the 50% attainment surface identifies the region of objective space that is dominated by half of the given attainment surfaces, whereas the 100% attainment surface identifies the region dominated by every given attainment surface. 2. Hypervolume also known as the S metric [18, 17], this is the ratio of the hypervolume dominated by the obtained front to the hypervolume dominated by the (unrealistic) "ideal" solution (a solution with a zero error value, zero total cost, and a zero P80 value). 1819
Since attainment surfaces operate in objective space, they are more robust than numerical metrics (which attempt to reduce complex multi-dimensional data down to single numerical values), but can only be used for visual comparison of performance. The hypervolume metric is a numerical measure of the non-dominated front produced by an evolutionary algorithm that rewards both closeness to the Pareto optimal front and the extent of the obtained non-dominated front. Importantly, the hypervolume metric is more robust than other numerical metrics [13, 2, 19]. To study the effectiveness of our approach, we ran our multi-objective evolutionary algorithm 35 times, seeding each trial with a population of randomly constructed comminution circuits. Figure 2 plots the 50% attainment surface achieved by these runs at various stages, along with the set of overall non-dominated solutions found from all 35 runs. Only solutions with a zero-valued third (error) objective are plotted any solution with a non-zero third objective value is ignored from consideration. Also plotted in Figure 2 are two sample designs (labelled engineer solution A and engineer solution B) proposed by consulting engineers. All values have been normalised by engineer solution A. In all 35 runs, none of the randomly generated candidate solutions in the starting population were valid. Indeed, the evolutionary algorithm typically took about 20 generations before it was able to evolve a solution with a zero-valued third (error) objective, further demonstrating the difficulty of the problem. Once this was achieved, rapid progress is realised, with the evolutionary algorithm quickly evolving solutions surpassing (dominating) the quality of the two sample designs. As expected, the rate of progress tails off, with only smaller and smaller improvements made in the later generations. This is confirmed in Figure 3, which re-
1820
Generation 200(50% attainment surIace) Generation 800 (50% attainment surface) Generation 1000 (50% anainment surface)
Overall best -.Engineer solution A +
Engineer solution B Best cost solution
Best P80 solution Average cost solution Average P80 solution
0.8
o
0.6 0 co
0.4 F ...,.
0.2
F
0
3
2
1
4
5
Cost
Figure 2: The 50% attainment surfaces from 35 runs of our multi-objective evolutionary algorithm over time ports the progress of the 50% attainment surface through time by plotting the average hypervolume of the 35 populations each generation. EA average Engineer solution A Engineer solution B
0.91
------
0.95 E
0.89
-
0.88
&I o
0.87 /...... ..... 0.86 .8 74
0.85 0.84
-
0
100
200
300
400
500 600 Generation
700
800
900
1000
Figure 3: The average hypervolume of the 35 runs over time Figure 2 also shows that the evolutionary algorithm is able to generate a good range of different designs, each trading-off the P80 and total cost objectives to varying degrees. We also see an increase in the extent of the Pareto front over time. Notice though the difficulty in improving P80 values beyond a certain value - a relatively large worsening in total cost is required to make a small improvement in the P80 objective. Some minor experimentation using P80 as the sole objective confirmed that there are limits to the improvement in this value. Figure 2 also highlights four different solutions found by the evolutionary algorithm across the 35 runs. Table 2 lists the corresponding setups for these solutions along with the setups for engineer solution A and engineer solution B. Engineer solution A represents a conservative setup that reflects the current practices typically employed in processing plants. As is the practice, the settings used in this design follow the general "by-the-book" recommendations
and have not been tailored to the problem of interest. Engineer solution B is similar to engineer solution A, but tuned to produce a finer product. The amount of ore in the recirculating stream (the ore flowing into the tertiary crusher) is lower than engineer solution A, but the tertiary crusher component is working "harder" as it is required to produce a smaller sized product. In essence, engineer solution B is an optimised version of engineer solution A based upon engineer's intuition and experience. Engineer solution B represents the type of solution a human engineer may well design in taking the "by-the-book" recommendations used in engineer solution A and adjusting the settings to optimise the performance of the design to the problem at hand. Simulation confirms this - engineer solution B strictly dominates engineer solution A. The best P80 solution from Figure 2 and detailed in Table 2 represents the design with the lowest P80 value found across all 35 runs of the evolutionary algorithm. Inspection of the settings employed by this design reveals the product screen component uses a small aperture setting and the tertiary crusher component is set to use an extremely small CSS. As a consequence, this design contains a large amount of ore in the recirculating stream requiring a large unit count (the number of physical machines) for both the product screen and tertiary crusher components. As a result, the cost of this design is very high. Circuits with similar designs are often used in stone quarrying where very fine crushing is required. The fact the evolutionary algorithm has discovered this design is encouraging. The solution labelled best cost represents the design with the lowest total cost value found across all 35 runs of the evolutionary algorithm. Cost relative to the two sample designs has been reduced in this design by reducing the unit count of both the product screen and tertiary crusher components. Additionally, the design uses an increased aperture for the scalping screen component, thus requiring a smaller area for the scalping screen component (less area is needed to "sieve" the ore stream) and a smaller, yet more coarse, secondary crusher component (less, but relatively bigger sized, ore will be re-directed to the secondary crusher), further reducing the overall cost of the design. Note that the large aperture setting for the scalping screen component means only one secondary crushing machine is required. A similar design to this solution has been used in practice, but problems arose when the composition of the incoming feed stream differed from expectation, something we have not yet modelled in this work. The two remaining labelled solutions in Figure 2 represent the closest designs to the average fitness score in each of the two objectives for the set of overall non-dominated solutions found from all 35 runs. Note that due to the shape of the Pareto font, this means the solution labelled average cost has a relatively good P80 value and the solution labelled average P80 has a relatively good total cost value. The design corresponding to the average cost solution appears to be a variation of the best P80 solution. The design uses similar settings for the two crusher components, but a significantly larger aperture for the scalping screen 1820
1821
Component
Scalping
screen
Secondary crusher Product screen
Tertiary crusher
Engineer solution A Variable Value 1 Count
Area Aperture
19.4 55.1
Count CSS Count Area Aperture Type Count
HP800 medium standard 1 30.0 4 27.7 14.0 HP800 medium short 4 15.0
Type
CSS
Component Scalping screen
Secondary
crusher
Variable Count Area Aperture
Type
Count
screen
Tertiary crusher
Count Area Aperture
Type
9 18.9
Count
HP400 fine short 20
CSS
6.0
Count CSS
26.5
Product
Count Area Aperture Type Count
2 20.0 15.0 HP400 fine short 7
CSS
6.0
Secondary
screen
Tertiary
crusher
Product screen
screen
Secondary crusher Product screen
Tertiary crusher
Average P80
crusher
screen
Variable Count
Secondary crusher
3.5
Value 1 20.5 45.4 HP500 medium standard 2
Component Scalping
Component Scalping
screen
27.3
CSS
Product
Best P80 Value 2 8.9 35.7 HP500 coarse standard 4
Tertiary crusher
Engineer solution B Variable Value Count 1 Area 23.7 Aperture 40.0 Type HP800 medium standard Count 1 CSS 40.0 Count 4 Area 25.5 Aperture 12.0 HP800 medium short Type Count 4
Component Scalping
Variable Count Area Aperture
Type
Component Scalping screen
Secondary crusher Product screen
Tertiary crusher
CSS
Area Aperture Type Count CSS Count Area Aperture Type Count
CSS
10.0
Best cost Value 1 18.7
83.6 HP500 extra-coarse standard 1 32.7 3 24.0 15.0 HP800 medium short 3 10.0
Average cost Value 3 Count Area 10.4 Aperture 47.7 HP500 coarse standard Type 2 Count 26.7 CSS 6 Count Area 25.1 Aperture 4.8 HP400 fine short Type Count 14 6.0 CSS
Variable
Table 2: Selected setups from the 35 runs of our evolutionary algorithm reported in Figure 2 component and a slightly larger aperture for the product screen component. The increased aperture of the scalping screen component reduces the amount of ore re-directed to the secondary crusher component, thus reducing the unit count of the secondary crusher component and hence cost. Similarly, the increased aperture of the product screen component reduces the recirculating load, thus reducing the number of units needed in the tertiary crusher and product screen components, further reducing the total cost, but incurring a higher P80 value. The setup represented by the average P80 solution appears to be a variation of the average cost solution, with the only real significant variation occurring in the recirculating load of the circuit. The increased aperture setting for the product screen component allows larger sized ore particles 1821
to pass through into the product stockpile than the average cost solution, hence worsening the circuit's P80 value but reducing the recirculating load and hence the need for as many parallel machines. Consequently, the unit count for the product screen and tertiary crusher components is reduced, thus reducing the overall cost of the design.
Notice that in both of these "average designs", the evolutionary algorithm has found a compromise solution between the two objectives, trading-off one objective for improve-
ment in the other. Pleasingly, the evolutionary algorithm consistently finds secondary crusher components with a CSS setting of around 30, which is the typical setting used in multi-stage crushing. Experience shows the CSS of the secondary crusher component can not be too small (as this would require a high
1822
unit count to handle the reduced capacity) nor can it be too large (as this would require a high unit count for the tertiary crusher component or additional crushing stages to reduce the size of the particles making up the product ore stream). The evolutionary algorithm has learned this principle.
6 Conclusions and Further Work This paper has presented work on the application of a multiobjective evolutionary algorithm to a difficult practical engineering design problem - determining the composition of comminution components in a mineral processing plant. The algorithm is responsible for determining the type, the number of machines to use, and the numerical control settings for these components. Experimental results show that our multi-objective evolutionary algorithm approach is able to produce plant designs superior in performance to those in use today. Expert analysis confirms the evolutionary algorithm discovers alternative solutions engineers would not normally consider. Indeed, consulting engineers are greatly interested in the potential of this work. In many ways, this problem is an ideal application for a multi-objective evolutionary algorithm - the pay-off is high, the problem is too complex to solve analytically, the search space is too large to explore unaided, and we have a well-defined evaluation function and a straight-forward representation scheme suitable for manipulation by genetic operators. Many challenges remain in incorporating more realism in the problem definition, including for example, introducing varieties in the feed ore stream, considerations of interactions with other processing stages, the use of better economic cost models, and factoring in operational practicality considerations like the risk of failure of the circuit. This study acts as an intermediary step in developing a technique for the optimisation of the entire design of a processing plant. Ultimately, we desire a system capable of co-evolving the numerical control settings for the processing equipment as well as the design (layout) of the circuit itself. This brings in elements of network design, another application area where evolutionary algorithms have been successfully applied (for example, see GroB [10]). The concurrent design of the layout of the circuit and the numerical control settings for the machines within it will be challenging, but the potential rewards are enormous.
Acknowledgments This work was supported by Australian Research Council Linkage Grant LP0347915 and by Rio Tinto Ltd.
Bibliography Depart[1] Western Australian iron ore industry 2002. ment of Mineral and Petroleum Resources, Western AusAvailable from: tralia Government, September 2002.
http://www.mpr.wa.gov.au/
[2] K. H. Ang, G. Chong, and Y Li. Preliminary statement on the current progress of multi-objective evolutionary algorithm performance measurement. In CEC '02, pages 831-836. [3] L. Barone, L. While, and P. Hingston. Designing crushers with a multi-objective evolutionary algorithm. In GECCO '02, pages 995-1002. [4] D. Biiche, P. Stoll, R. Dornberger, and P. Koumoutsakos. Multiobjective evolutionary algorithm for the optimization of noisy combustion processes. IEEE Trans. on Systems, Man, and Cybernetics - Part C: Applications and Reviews, 32(4):460-473, 2002. [5] K. Chen, I. Parmee, and C. Gane. Dual mutation strategies for mixed-integer optimisation in power station design In ICEC '97, pages 385-390. [6] K. Deb, A. Pratap, S. Agarwal, and T. Meyarivan. A fast and elitist multiobjective genetic algorithm: NSGA-II. IEEE Trans. on Evolutionary Computation, 6:182-197, 2002. [7] C. M. Fonseca and P. J. Fleming. Genetic algorithms for multiobjective optimization: formulation, discussion and generalization. In 5th International Conference on Genetic Algorithms, pages 416-423, 1993. [8] C. M. Fonseca and P. J. Fleming. On the performance assessment and comparison of stochastic multiobjective optimizers. In PPSN IV, pages 584-593, 1996. [9] D. E. Goldberg. Genetic Algorithms in Search, Optimization & Machine Learning. Addison-Wesley, 1989. [10] B. GroB, U. Hammel, P. Maldaner, A. Meyer, P. Roosen, and M. Schutz. Optimization of heat exchanger networks by means of evolution strategies. In PPSN VI, pages 10021011, 1996. P. [11] Hingston, L. Barone, and L. While. Evolving crushers. In CEC'02, pages 1109-1114. [12] S. Huband, P. Hingston, L. While, and L. Barone. An evolution strategy with probabilistic mutation for multi-objective optimisation. In CEC '03, pages 2284-2291. [13] J. Knowles and D. Come. On metrics for comparing nondominated sets. In CEC '02, pages 711-716. [14] T. Napier-Munn, S. Morrell, R. D. Morrison, and T. Kojovic. Mineral Comminution Circuits. Julius Kruttschnitt Mineral Research Centre, 1996. [15] I. C. Parmee. Evolutionary and adaptive computing in engineering design. Springer Verlag, 2001. [16] L. While, L. Barone, P. Hingston, S. Huband, D. Tuppurainen, and R. Bearman. A multi-objective evolutionary algorithm approach for crusher optimisation and flowsheet design. Minerals Engineering, 17:1063-1074, 2004. [17] L. While, P. Hingston, L. Barone, and S. Huband. A faster algorithm for calculating hypervolume. IEEE Transactions on Evolutionary Computation, 2005. [18] E. Zitzler. Evolutionary algorithms for multiobjective optimization: methods and applications. PhD thesis, ETH, Zurich, 1999. [19] E. Zitzler, L. Thiele, M. Laumanns, C. M. Fonseca, and V. G. da Fonseca. Performance assessment of multiobjective optimizers: An analysis and review. IEEE Transactions on Evolutionary Computation, 7(2):117-132, April 2003.
1822