Cold gas propulsion system technology is relatively less expensive than other propulsion systems. In this paper, for five usual gas as propellant and eight ...
International Journal of Computer Applications (0975 – 8887) Volume 118 – No.22, May 2015
Designing Space Cold Gas Propulsion System using Three Methods: Genetic Algorithms, Simulated Annealing and Particle Swarm Mohammad Fatehi MSc student Space research institute Tehran
Mehran Nosratollahi, Amirhossein Adami Assistant professor Space research institute Tehran
S.M.Hadi Taherzadeh MSc student Space research institute Tehran
ABSTRACT Cold gas propulsion system technology is relatively less expensive than other propulsion systems. In this paper, for five usual gas as propellant and eight genera as structural used in this systems, first Isp (specific impulse) was checked and then, using three optimization methods, i.e. genetic algorithms, simulated annealing and particle swarm, the optimal total mass of system, principles of structure design, optimal chamber pressure and radius propellant tank were calculated as a multidisciplinary for each gas and structure. Using the results, it is possible to determine the gas, the suitable structure and configuration of the design; for this example, the results of the three algorithms were compared. Assuming that the amount of Thrust, working time and the size of thruster cylindrical chamber is given, it is evident that the gas which have the most Isp is not necessarily a good criterion to be used in the design stage of the cold gas system, and other criteria such as the total mass of the propulsion system, chamber pressure, the radius of the tank and the size of the structures must also be considered.
Keywords Propulsion System, Multidisciplinary Optimized Design, Cold Gas, Genetic Algorithms, Particle Swarm, Simulated Annealing.
1. INTRODUCTION Cold gas propulsion systems are typically used for satellite attitude control, which requires:
A high degree of reliability
Low system complexity, no combustion involved
Low
Extremely safe operation
No contamination of the satellite's external surfaces from exhaust gases [1]
Relatively low total impulse (
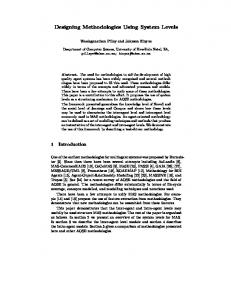
Fig.1: System Architecture for a Cold-Gas Thruster [1]
Although this feature is not necessary, it has two advantages: 1.
2.
The hardware outside the regulator operates at lower pressure and therefore has lower strength requirements. The thruster operates at a constant pressure until the tank pressure drops below the regulator pressure; this feature ensures more consistent levels of thrust.
However, since the purpose is to minimize the system total mass, system weight gain is one of the disadvantages associated with regulator [1]. Before thruster there is a two-state on-off valve that turns the flow on and off and then the flow enters the thruster which generally consists of a cap, a cylindrical chamber and a convergent-divergent nozzle. Also along the way there can be pressure and temperature sensors, on-off valve and fuel filters which prevent the contamination going into thruster and feeding duct [3]. The system total mass includes the following sections: The mass of the propellant tank, propellant mass, thruster mass and other accessories mass. The thruster mass also includes a cap, cylindrical chamber and the convergent-divergent nozzle. MTotal = MTank + MProp + MThrust + Mσ
(1)
[2]
The gas is stored in a high-pressure tank. Typically, the gas feeds from the tank through a regulator, which reduces the gas pressure.
The objective is to minimize the total mass with three methods, i.e. genetic algorithms, simulated annealing and particle swarm. Before addressing the problem, a brief description of the methods would be useful.
25
International Journal of Computer Applications (0975 – 8887) Volume 118 – No.22, May 2015 SIMULATED ANNEALING: Simulation of thermal annealing
2. OPTIMIZATION An optimization or mathematical programming problem can be stated as follows. Find
which minimizes f (X)
Subject to the constraints gj (X)≤ 0, j = 1, 2, . . . ,m lj (X) = 0, j = 1, 2, . . . , p
(2)
The design vector is X which is an n-dimensional vector, the objective function is f(X), and gj (X) and lj (X) are known as inequality and equality constraints, respectively. The letter n is the number of variables, and p is the constraint’s number which not be related in any way. As it shown in Eq. (2) the problem is called a constrained optimization problem. Some optimization problems do not involve any constraints and can be stated as Find Such problems problems.
which minimizes f (X) are
called
unconstrained
optimization
Natural genetics and natural selection, both are the base of genetic algorithms. Simulation of thermal annealing of critically-heated solids is the base of simulated annealing method. The global minimum with a high probability could be found with both genetic algorithms and simulated annealing which are naturally applicable for the solution of discrete optimization problems [5]. The particle swarm optimization is based on the behavior of a colony of living things, such as a swarm of insects, a flock of birds or a school of fish. In all of this algorithms, the tolerance is less than or equal to 1e-10. GENETIC ALGORITHMS: Many practical optimum design problems are characterized by mixed continuous– discrete variables, and discontinuous and non-convex design spaces. Standard nonlinear programming techniques are inefficient to use for this type of problem and in most cases, computationally will be expensive to find a relative optimum that is closest to the starting point. Genetic algorithms (GAs) are well-suited for solving such problems, and in most cases they can find the global optimum solution with a high probability. Reproduction, crossover, and mutation—are used in the genetic search procedure are the basic elements of natural genetics. As the genetic algorithms are based on the survival-of-thefittest principle of nature, they try to maximize a function called the fitness function. Thus GAs are naturally suitable for solving unconstrained maximization problems. If the problem is constrained, the constraints can be added to the problem using penalty functions. In this problem, the initial population is 200 and the selection function is stochastic uniform; thought, the algorithm can be rewritten for other selection functions like roulette or tournament, 2 prodigies in any population, mutation function, Gaussian function, 0.8 crossover fraction and scattered function. This function creates a random binary vector and selects the genes where the vector is a 1 from the first parent, and the genes where the vector is a 0 from the other parent and then combines the genes to form the child [5],[6], [7].
of critically-heated solids is the base of simulated annealing method. Annealing is heating the material to the melting point and then reducing the temperature gradually to turn it into solid to achieve the most stable and low energy states. the relationship between optimization and thermodynamic is defined in a way that the state of the system as the input parameter, energy of each condition as the objective function, temperature as a control variable and finding the minimum energy level is considered as finding the minimum point of function. In summary, this algorithm starts with design vector Xi (In the first step i =1) and high temperature (T). Then a new design point is randomly generated in the vicinity of the current design point and the difference between the two functions is calculated. ΔE = ΔF = Fi+1 – Fi = F (Xi+1) – F (Xi)
(3)
If Fi+1 is less than Fi (∆F negative), second design point (Xi+1) will be accepted; otherwise, when ∆F was positive, this new point will be accepted if that probability is (4) This means that if the random number generated ( was larger than (Pr), point Xi+1will be accepted and otherwise, this point will not be accepted and another new point must be randomly generated. One of the features of this method is that the quality of the final solution is not affected by the initial guesses, except that the computational effort may increase with worse starting designs. Besides, this method can be used to solve mixedinteger, discrete, or continuous problems [6], [7]. In this problem, initial temperature is 100 and temperature function is Initial Temperature * . PARTICLE SWARM: This algorithm is one of the important
ones that takes place in the realm of collective intelligence and is based on the behavior of a colony or swarm of insects, such as ants, termites, bees, and wasps, a flock of birds or a school of fish. In this algorithm, each bird, fish, or the particle spread in the search space of the objective function. Although the particle swarm optimization is similar to genetic algorithms, actually it has a simpler structure. In this method, many particles simultaneously will search in the solution space; in this respect, it is similar to the function of chromosomes in genetic algorithms. However, in particle swarm methods, simultaneous and interaction communication between collections particles are also used, while genetic algorithm lacks this relationship [5]. In short, the direction of each particle is influenced by three factors: The current location of particle maybe suitable. The location where has been the best place for that particle so far. The location that has been the best among all particles so far [8].
26
International Journal of Computer Applications (0975 – 8887) Volume 118 – No.22, May 2015 In this algorithm, 200 particles are considered and new velocity is defined as follow: V=W*V+Y1*U1*(P-X) +Y2*U2*(G-X)
Table 2. Characteristics of some of these materials used in the structure of gas propulsion tanks [9] Material
Allowable stress (Mpa)
Density(Kg/m3)
Titanium
22.
41..
Titanium Alloy
77.
41..
Magnesium Alloy
21.
92..
Beryllium alloy
41.
91..
Steel
11.
2...
Carbon fiber composites
2...
92..
Glass fiber composite
97..
92..
Aluminum alloy
42.
22..
(5)
W: Inertia variable Y1: The maximum value that each particle can have. Y2: The maximum value that the particle has had in total. X-P: The difference between the particle current location (X) with the best location where this particle has ever seen (P). X-G: The difference between the particle current location (X) with the best location where one of the particles have had (G). U1 and U2 is a uniform random probability between zero and one. It should be noted that the magnitude of the absolute W, Y1 and Y2 can cause instability of particle swarm [6].
3. DESIGN INTRODUCTION In table 1 some of the propellants features are shown that usually are used in cold gas propulsion systems.
Molecular weight
Density(Kg/m3)
Ratio of specific heat
Propellant
Isp(Theory)
Isp(Measured)
Table 1. Some of propellants features that usually are used in cold gas propulsion systems [9],[10]
Hydrogen
272
212
9.4.1
...2
2
Helium
921
971
9.227
...4
4
Nitrogen
77
2.
9.4
..22
22
Argon
12
17
9.227
..44
71.1
Methane
9.1
994
9.211
..91
92
4. DESIGN PROCESS Due to different pressure, the temperature and density of gases change; thus, considering the isentropic relations, the pressure and density at different pressures can be calculated. =
=
(7)
As specified in the above equation, if we have the temperature and density for each of these gases at a specific temperature, then it is possible to calculate the temperature and density in various pressures. Pressure and density can be calculated using the tables of thermodynamic in a special way that come as follows: All at a 1atm pressure and a temperature of 25 ° C Table 3. At specific pressure, density [9]
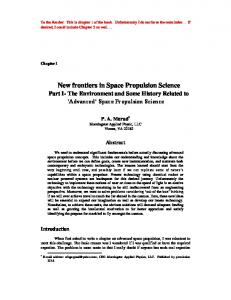
By assuming nominal condition in figure 2, specific impulse (Isp) of this gas with the use of the following equation are shown:
=
c
Propellant 3
Density(Kg/m )
Methane
Argon
Nitrogen
Helium
Hydrogen
..242
9.297
9.97
..9291
...297
e c
(6)
By comparing these specific impulses, it is determined that hydrogen with a lower molecular mass have maximum Isp and it can be said that hydrogen gas is suitable to be used in the design, but then we should see whether Isp is a good criteria for design or not? Now we move on to the propulsion system design and calculation of minimum mass for each of these gases according to different material structures. Physical characteristics of some of these materials is provided in table 2, so we calculate the minimum total mass of propulsion system based on the gas for each of these materials.
The objective function in this problem is the total mass of propulsion system. The total mass of propulsion system includes mass of storage propellant tank, total mass of propellant and Thruster which includes cylindrical chamber, cap and nozzle. In each of these three optimization algorithm, the design variables are considered as a pressure chamber (Pc) and the radius of the propellant tank (Rtank). Pressure is limited in the range of [0.5 100] (bar) and the radius of the tank is in the range of [0.5 100] (meter). The problem requirement: 1N thrust at 120 sec by assuming size of cylindrical chamber is determined with a length of 2 cm and radius of 0.5 cm.
27
International Journal of Computer Applications (0975 – 8887) Volume 118 – No.22, May 2015 In each loop, first calculate outlet Mach, mass flow, radius of exit and throat of nozzle, total mass of propellant and inside pressure of tank, respectively. Finally, by obtaining all the requirements, the total mass of the propulsion system is calculated. Since the chamber pressure and the radius of the tank in the given range have wide responses for each gas and each structure material, so the purpose is to find the minimum total mass for each condition. Using each algorithms, the calculated total mass is shown in tables 4, 7 and 10, radius of the tank for optimum mass in tables 5, 8 and 11, and the optimum pressure in tables 6, 9 and 12; tables 4,5,6 with genetic algorithms, tables 7,8,9 with simulated annealing and tables 10,11,12 with PSO for different structures and different gases.
Aluminum alloy
Glass fiber composite
Carbon fiber composites
Steel
Beryllium alloy
Magnesium Alloy
Titanium Alloy
Titanium
Table 4. Total Mass by Genetic Algorithms
Hydrogen
2.864
2.326
2.464
1.708
3.307
0.401
0.501
2.418
Helium
2.813
2.300
2.432
1.712
3.235
0.460
0.557
2.388
Nitrogen
1.067
0.912
0.952
0.727
1.192
0.265
0.310
0.939
Argon
1.365
1.186
1.233
0.967
1.506
0.378
0.439
1.217
Methane
1.053
0.884
0.927
0.686
1.191
0.226
0.268
0.913
Aluminum alloy
Glass fiber composite
Magnesiu m Alloy
Carbon fiber composites
Titanium Alloy
Hydrogen
0.484
0.483
0.483
0.480
0.485
0.401
0.450
0.483
Helium
0.507
0.504
0.505
0.499
0.508
0.431
0.461
0.505
Nitrogen
0.210
0.109
0.195
0.160
0.225
0.052
0.063
0.194
Argon
0.281
0.254
0.261
0.218
0.302
0.088
0.104
0.250
Methane
0.201
0.184
0.189
0.159
0.212
0.059
0.0627
0.188
Steel
Titanium
Beryllium alloy
Table 5. Optimum Radius by Genetic Algorithms
28
International Journal of Computer Applications (0975 – 8887) Volume 118 – No.22, May 2015
Titanium
Titanium Alloy
Magnesium Alloy
Beryllium alloy
Steel
Carbon fiber composites
Glass fiber composite
Aluminum alloy
Table 6. Optimum Pressure by Genetic Algorithms
Hydrogen
0.50000
0.50000
0.50000
0.50000
0.50000
0.72974
0.52534
0.50000
Helium
0.50000
0.50000
0.50000
0.50000
0.50000
0.58944
0.50000
0.50000
Nitrogen
1.29970
1.74725
1.60507
2.87565
1.07627
99.99999
54.82982
1.64916
Argon
0.68190
0.93857
0.85906
1.53302
0.54228
34.57413
19.08241
0.88409
Methane
1.57183
1.98899
1.85703
3.01075
1.36075
99.99999
49.02811
1.89833
Beryllium alloy
Steel
2.343
2.464
1.887
3.324
0.403
0.510
2.796
Helium
2.814
2.697
2.451
1.742
6.291
0.461
0.558
2.410
Nitrogen
1.068
0.944
0.969
0.727
1.194
0.265
0.310
1.000
Argon
1.367
1.305
1.281
1.012
1.506
0.378
0.443
1.223
Methane
1.127
0.884
1.063
0.680
1.205
0.226
0.268
0.913
Aluminum alloy
Magnesium Alloy
2.871
Glass fiber composite
Titanium Alloy
Hydrogen
Carbon fiber composites
Titanium
Table 7. Total Mass by Simulated Annealing
Magnesium Alloy
Beryllium alloy
Steel
Carbon fiber composites
0.505
0.520
0.484
0.288
0.478
0.432
0.300
0.2431
Helium
0.500
0.347
0.539
0.451
0.253
0.422
0.465
0.474
Nitrogen
0.219
0.215
0.161
0.167
0.209
0.053
0.066
0.102
Argon
0.295
0.214
0.207
0.151
0.305
0.089
0.093
0.273
Methane
0.100
0.188
0.067
0.179
0.164
0.051
0.069
0.196
Aluminum alloy
Titanium Alloy
Hydrogen
Glass fiber composite
Titanium
Table 8. Optimum Radius by Simulated Annealing
29
International Journal of Computer Applications (0975 – 8887) Volume 118 – No.22, May 2015
Titanium
Titanium Alloy
Magnesium Alloy
Beryllium alloy
Steel
Carbon fiber composites
Glass fiber composite
Aluminum alloy
Table 9. Optimum Pressure by Simulated Annealing
Hydrogen
0.50097
0.50000
0.50096
2.59072
0.55396
0.50256
2.05771
2.66260
Helium
0.50001
1.88743
0.50000
0.51269
0.50000
0.585968
0.51590
0.55415
Nitrogen
1.09330
0.69911
3.06916
2.56808
1.43429
94.47900
46.34498
12.72209
Argon
0.54446
0.66824
2.71384
5.57238
0.52718
32.90025
36.45878
0.62281
Methane
15.80248
1.90651
60.07385
1.94745
3.28539
93.86361
35.36871
1.63022
Titanium Alloy
Magnesium Alloy
Beryllium alloy
Steel
Carbon fiber composites
Glass fiber composite
Hydrogen
2.864
2.326
2.464
1.708
3.307
0.401
0.501
2.418
Helium
2.813
2.300
2.432
1.712
3.235
0.460
0.557
2.388
Nitrogen
1.067
0.912
0.952
0.727
1.192
0.265
0.310
0.939
Argon
1.365
1.186
1.233
0.967
1.506
0.378
0.439
1.217
Methane
1.053
0.884
0.927
0.687
1.191
0.226
0.268
0.913
Aluminum alloy
Titanium
Table 10. Total Mass by Particle Swarm
Steel
Carbon fiber composites
Glass fiber composite
0.483
0.484
0.489
0.485
0.401
0.450
0.483
Helium
0.507
0.504
0.505
0.499
0.508
0.431
0.461
0.501
Nitrogen
0.210
0.11.
0.192
0.160
0.221
0.052
0.063
0.194
Argon
0.289
0.254
0.261
0.212
0.302
0.088
0.104
0.251
Methane
0.209
0.184
0.189
0.159
0.212
0.01.
0.067
0.182
Aluminum alloy
Beryllium alloy
0.484
Titanium Alloy
Hydrogen
Titanium
Magnesium Alloy
Table 11. Optimum Radius by Particle Swarm
30
International Journal of Computer Applications (0975 – 8887) Volume 118 – No.22, May 2015
Titanium
Titanium Alloy
Magnesium Alloy
Beryllium Alloy
Steel
Carbon fiber composites
Glass fiber composite
Aluminum alloy
Table 12. Optimum Pressure by Particle Swarm
Hydrogen
0.50000
0.50000
0.50000
0.50000
0.50000
0.72971
0.52536
0.50000
Helium
0.50000
0.50000
0.50000
0.50000
0.50000
0.58940
0.50000
0.50000
Nitrogen
1.299690
1.74741
1.60506
2.87571
1.07629
100
54.81901
1.64948
Argon
0.68198
0.93862
0.85904
1.53297
0.54223
34.60340
19.09671
0.88403
Methane
1.57227
1.98897
1.85739
3.01064
1.36103
100
48.93977
1.89853
Based on the obtained result, the best gas and structure material for optimum total mass can be fined and the size of the system can be determined.
5. CONCLUSION As seen in figure 2, hydrogen has the highest specific impulse compared to other gases, but as can be seen in the table of minimum mass, this gas has the greatest mass compared to other gases. Thus, specific impulse isn't the only criterion for the design of the cold gas system. In available gases, nitrogen can be selected as the appropriate gas that has suitable mass and tank radius and in materials, Composites are good options to choose, because they have appropriate mass and appropriate tank radius: however, it should be noted that the pressure required of this materials for minimum of mass is higher among other gases. By increasing the chamber pressure which is one of the design variable, the dead propellant mass inside the tank will increase and given that the mass flow rate will decrease, the mass of the propellant consumption will also reduce and thus it is hard to predict the mass of the propellant and the size of the throat and outlet nozzles and pressure tank; therefore, the total mass of the system which depends on increasing the pressure chamber and thus reducing the mass flow rate, usually somewhere in the middle of interval design, is minimum.
Fig.2: Specific Impulse for commonly gas
Now, depending on selected gas, we can use the results from the table and select the suitable material for optimal designing according to minimum mass. Comparing the three algorithms used for optimization, usually Particle swarm algorithm for unconstrained problems or design variables that have Mostly upper and lower bounds is more effective than genetic algorithm and simulated annealing; after that, the genetic algorithm which can be used for all types of constraint, responds more effectively than the annealing method and at the end there is annealing method, which is usually used for unconstrained problems; however, if we reduce the speed of cooling function sufficiently, this method can also respond well for optimization, usually by converging with reducing logarithmic temperature program is that is very slow.
Fig.3: An example of mass changes in chamber pressure for Nitrogen and Titanium structure
It is worth noting that the results of these three methods, depending on the different options which are added to the algorithm, can lead to different answers.
31
International Journal of Computer Applications (0975 – 8887) Volume 118 – No.22, May 2015
6. REFERENCES [1] Humble, Ronald W., Gary N. Henry, and Wiley J. Larson, eds. Space Propulsion Analysis and Design. Vol. 1. New York: McGraw-Hill, 1995. [2] Hashem, A. A. Design and testing of a cold gas system. 4th International Spacecraft Propulsion Conference. Vol. 555.2004 [3] Brown, C. D. (2002). Elements of Spacecraft Design, American Institute of Aeronautics and Astronautics. Inc., Reston.
Fig.4: An example of mass changes in chamber pressure for Hydrogen and Carbon fiber composites structure
[4] Adami, Amir H., Rahmani, Shahram. Design and analysis Space clod gas propulsion system with a variety of propulsion and structures. 12th Conference of Iranian Aerospace Society. Tehran, Amirkabir University, 2013. [5] Rao, Singiresu S., and S. S. Rao. Engineering optimization: theory and practice. John Wiley & Sons, 2009. [6] Fatehi, Mohammad. , New optimization methods in engineering design. MSc Seminar. Space Research center. Tehran, 2015. [7] Forozan, M.reza. , Niromand, M.Reza. , New optimization methods. , Publications Center, Isfahan industrial units SID.2010 [8] Bashiri, Mahdi. , Karimi, Hossain. , Application of heuristic and meta-heuristic algorithms in designing industrial systems. , Tehran, Shahed University, Publications Center, 2014. [9] Sonntag, Richard Edwin, et al. Fundamentals of thermodynamics. New York: Wiley, 2991.
Fig.5: An example of mass changes in chamber pressure for Argon and Beryllium Alloy structure
[10] Cardin, J., & Acosta, J. (2000). Design and test of an economical cold gas propulsion system.
Fig.6: An example of mass changes in chamber pressure for Methane and Beryllium Alloy structure
IJCATM : www.ijcaonline.org
32