30th Annual International IEEE EMBS Conference Vancouver, British Columbia, Canada, August 20-24, 2008
Detecting Idiopathic Toe-Walking gait pattern from normal gait pattern using heel accelerometry data and Support Vector Machines Gita Pendharkar 1 , Daniel T.H. Lai 2 , Rezaul K. Begg 2 Senior Member, IEEE see
Abstract— Toe walking is commonly seen in children with neurological symptoms such as cerebral palsy. However idiopathic toe walking (ITW) in children is considered to be habitual. ITW children are categorized as toe walkers without any neurological problems, however they walk with their foot plantar-flexed. These children often suffer poor sport performance leading to low exercise levels and the associated consequences. If the condition is not treated, the ITW children eventually develop abnormal gait pattern as adults and could suffer from postural problems. However, ITW gait is difficult to observe since children can modify their gait when made aware of it. Gait analysis using heel accelerometry data in ITW children could provide an objective and quantitative description of their toe walking and may thus be beneficial for observing ITW. In this paper, we propose a technique based on Support Vector Machines (SVM) to recognize ITW gait patterns using heel accelerometry data. Test results indicated that the SVM is able to identify ITW gait patterns with a maximum accuracy of 87.5% when a feature selection algorithm was applied.
I. INTRODUCTION
T
oe walking is common in children with neurological symptoms such as cerebral palsy. However, Idiopathic toe walking in children is considered to be habitual. Idiopathic toe walkers (ITW) are children categorized as toe walkers without any neurological problems however still walk with their foot plantar-flexed [1].The classification of these ITW children can be problematic and usually depends on the severity of toe walking [2]. They can be categorized as mild, moderate and severe toe walkers [2]. Various treatments exist for ITW as per the severity of toe-walking. However, if the condition is not treated, the ITW children as a consequence of toe walking often develop shortened calf muscles. Toe walking has been linked to gait deformities and abnormal gait patterns. It can cause severe postural problems [3]. These children often suffer social problems and poor sports performance, leading to low exercise levels. Most of the ITW children as adults could
Manuscript received April 16, 2008. This work was supported in part by the Department of Physiotherapy, Monash Medical Centre, Melbourne, Australia. G. Pendharkar is currently pursuing her PhD at the Department of Electrical and Computer Systems Engineering, Monash University, Melbourne 3168, Australia (e-mail:
[email protected]). Daniel T.H. Lai and Rezaul K. Begg are with the the Biomechanics Unit, Centre for Ageing, Rehabilitation, Exercise and Sport, Victoria University, VIC 8001, Australia.
978-1-4244-1815-2/08/$25.00 ©2008 IEEE.
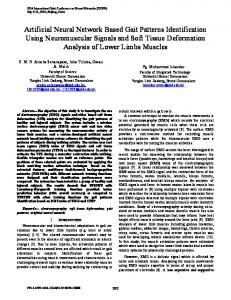
Figure 1: ITW child at MMC
eventually develop an abnormal gait pattern [3]. Toe-walking being habitual in ITW children, they have a tendency to modify their gait, as soon as they are conscious of being observed and assessed by the physician. Hence gait assessment becomes difficult for these children. One of the common means of measuring toe walking in ITW children at clinics is measuring the ankle flexibility. Although it gives a measure of tightened calf muscles, the relation between ankle flexibility and tight calf muscles is not fully understood. Parental observation is another way to monitor toe walking in ITW children, however being subjective, is not always accurate. A method, which we apply to distinguish toe-walking gait from normal gait in ITW children, is to deploy gait monitoring boots with a dual axis accelerometer which looks like normal boots, thus do not alert the ITW children of being assessed [5]. Figure 1 shows an ITW child with the gait monitoring boots at the Physiotherapy clinic at Monash Medical Centre (MMC), Melbourne. Gait analysis entails measurement, analysis, and assessment of the bio-mechanical features associated with walking [4]. Gait analysis can be carried out using body worn sensors such as accelerometers and have proven to give accurate and reliable results [5, 6, 7, 8, and 9]. Statistical analysis of the heel acceleration data could provide an objective way to differentiate toe walking gait from normal gait pattern and might be beneficial for the physician assessing the ITW children to provide a proper intervention. There has not been any previous attempt to differentiate ITW and normal gait patterns using computational intelligence (CI) approach. CI techniques such as Support vector machines (SVM) has proved useful in gait pattern
4920
recognition problems such as young-old gait [12]. In this paper, we apply an SVM for the automated classification of ITW and normal gait characteristics using heel acceleration data.
distance between the class boundaries to the hyperplane is the hyperplane margin. Data that is not linearly separable is first mapped via a nonlinear function φ : x ⊂ ℜn → ℜm
n, m ∈ [1, ∞ ) to a higher dimensioned feature space. The optimal hyperplane is the universal approximator:
II. AIM
l
The aim in this paper is to distinguish ITW gait pattern from normal gait pattern in children using heel accelerometry data and SVM classifier.
III. GAIT DATA
(2)
i =1
which is obtained by maximizing the margin of the hyperplane? The position of the hyperplane is determined by the weights, wi and bias, b which are obtained by solving the following SVM quadratic programming problem:
A. Measurement System & Experimental Setup This study was statistical analysis of the accelerometry data collected from the ITW and normal children at the Physiotherapy Department, Monash Medical Centre (MMC), Melbourne. Five ITW children and five normal children participated in the research study. The children included boys and girls in the age group of 5 to 12 years (mean age 7.7yrs). As shown in Figure 1, the children wore the gait monitoring boots embedded with a dual axis accelerometer in the heel of the boot and walked on the treadmill for 2 minutes during the experiments [10]. The accelerometer was positioned in the heel to have maximum sensitivity, i.e. the x axis along the direction of the feet and the y axis perpendicular to it. The ITW children were not aware of the sensors embedded in the heel of the boots as the boots looked liked normal boots, but were aware that their gait was being assessed as the boots were wired to a handheld oscilloscope when they walked on the treadmill. B. Statistical descriptors We calculated 7 statistical quantities by modeling the acceleration data as being drawn from a discrete distribution. These statistical descriptors were mean (S1), standard deviation (S2), skewness (S3), kurtosis (S4), median, (S5), maximum (S6) and minimum (S7) which would form the input data for SVM classification. IV. SVM THEORY The SVM developed by Vapnik [11] and co-workers has been shown to be a powerful supervised learning method. The standard soft-margin Support Vector Machine is a binary classifier applied to classify data
Θ={(x1 , y1 ), (x 2 , y2 )...(xl , yl )} xi ∈ R n
f ( x ) = ∑ wiφ ( xi ) + b
(1)
yi = {1, −1} where xi are vectors containing the measurements or features of gait data and yi are the corresponding class labels (i.e. +1=ITW gait, -1=normal gait). The SVM classifier is a linear hyperplane which separates two classes where the
l
minimize ℑ ( α ) = − ∑ α i + i=1
1 l ∑ α iα j yi y j K ( xi , x j ) 2 i , j =1
0 ≤ α i ≤ C subject to l ∑ α i yi = 0 i =1 Here
αi
are
Lagrangian
K ( x, y ) = φ ( x ) , φ ( y )
(3)
multipliers
and
is a kernel function. The process
of solving the optimization problem is known as training the SVM and using the SVM to classify new data is known as testing. The parameter C controls the tradeoff between minimization of training error and maximization of generalization capability. The separating hyperplane is usually written in terms of the Lagrangian Multipliers as
l f ( x ) = sign ∑ α i yi K ( x, xi ) + b = 1 i
(4)
V. METHODS We first computed the linear separability of the two classes based on single features. This was done using the area of the receiver operating characteristic (ROC) [12] graph which is obtained by varying the classification threshold used to classify the feature vector. The area under the ROC curve depicts the ability of a classifier to correctly classify positive and negative examples (sensitivity and specificity respectively) where larger areas imply better performance. In single feature ROC area computation, the feature values are treated as classifier outputs and a uniform threshold is applied for classification. This analysis, performed prior to classification provides a qualitative picture of individual feature separability. Similarly, ROC areas of SVM models indicate the robustness of the classifier to varying classification thresholds. Larger values indicate that the classifier separated the classes well and was less sensitive to deviations in the classification threshold. The optimal parameter set for the SVM was determined using the leave one out procedure. In this procedure, an
4921
arbitrary example is excluded from the data set and used as a test example while the remaining data is used to train the SVM. This is repeated until all training examples have been individually tested on the SVM. For our work, 20 of the 21 examples were used to train the SVM and the test accuracy for the excluded test examples was averaged over the 21 runs. The resulting accuracy is referred to as the leave one out (LOO) accuracy and is a robust metric for determining the quality of the SVM model assuming that the dataset contains examples that are representative of the distribution they are drawn from. All SVM models were trained over the range 0.1 ≤ C ≤ 1000 over a range of parameters for the linear, polynomial and Gaussian kernels defined as
K ( x, z )linear = xT z K ( x, z ) poly = ( pxT z + q )d K ( x, z ) gaussian = e
−s x− z
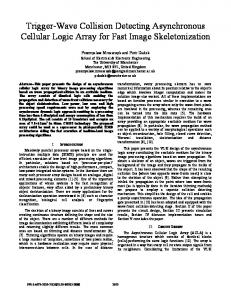
The SVM models in general were better at detecting ITW gait patterns compared to the normal gait, as depicted by the better sensitivity values. The best polynomial kernel not only gave the highest LOO accuracy but also the best ROC value of 0.8. This model approximately classified both positive and negative classes (sensitivity=0.8 and specificity=0.67) equally. C. Hill-Climbing feature selection We then investigated improved accuracies using feature selection to remove features with poor separability. Using the best SVM model found from the previous section did not provide improved accuracies (max 75%). We then ran the feature selection algorithm over the other SVM models within the kernel parameters used in the previous section. The Gaussian kernel (s=0.005) with C=100 produced an improved LOO accuracy of 87.5% and required on two features, namely S4 and S5 (Figure 2).
2
where x, y are training vectors. The SVM architectures were trained and tested on the D2CSVM software found at http://www.ee.unimelb.edu.au/people/dlai. In this work, feature selection was done by a hill climbing method [12] where features were systematically added to the training data such that they increased the overall accuracy. The best feature set contained the minimum number of features which provided the maximum leave one out accuracy. VI. EXPERIMENTAL RESULTS
VII. DISCUSSION AND CONCLUSION In previous work [10], detection of ITW gait from accelerometry data was achieved by comparing the threshold (constant) value of the acceleration signal to distinguish toe walking stance from normal stance in a gait cycle. This handcrafted solution proved laborious when several children required quick diagnosis. In this work, we demonstrated that statistical analysis of the heel accelerometry data together with the SVM classifier provided an automatic recognition method for distinguishing ITW gait from normal gait patterns. Class 1 vs Class -1 90
A. Linear Separability of Individual Statistical Features Table I depicts the calculated ROC values of the individual statistical features. The most separable feature was S4 (kurtosis) and S6 (maximum acceleration) which both had ROC=0.8. Features S5 and S7 had the poorest separability (ROC=0.6) while the remaining features had also relatively low linear separability (ROC=0.667). B. SVM Classification performance The SVM performance as depicted in Table II showed that linear models were poor at separating the two classes. The linear SVM at best managed 50% LOO accuracy while the Gaussian models fared better producing 62.5% LOO accuracies. The best LOO accuracies in the range of kernel parameters tested was found to be a highly nonlinear 4th order polynomial kernel with kernel coefficients p=3 and q=3 giving an improved accuracy of 75%.
85
Accuracy(%)
80
S2
S3
S4
S5
S6
70 65 60 55 50
4
5
6
1 Feature Order
2
7
3
Figure 2: Feature selection using a Gaussian SVM model yielded the highest LOO accuracy using 2 features.
TABLE I LINEAR SEPARABILITY OF THE STATISTICAL FEATURES AS INDICATED BY THE ROC VALUES.
S1
75
S7
ROC Area 0.667 0.667 0.667 0.800 0.600 0.800 0.600 TABLE II
4922
PERFORMANCE OF SVM MODELS SHOWING BEST ACCURACIES, SENSITIVITIES, SPECIFICITIES AND MODEL ROC VALUES.
Kernel Linear Gaussian , s=0.005 Gaussian , s=0.05 Gaussian , s=0.5 Polynomial, d=2, p=2, q=1 Polynomial d=3, p=7, q=1 Polynomial d=4, p=3, q=3
C LOO accuracy (%) Sensitivity Specificity 0.1 50.00 0.80 0.00 1 62.50 1.00 0.00 0.1 62.50 1.00 0.00 1 62.50 1.00 0.00 10 37.50 0.60 0.00 1 62.50 1.00 0.00 100 75.00 0.80 0.67
Individual ROC values show that kurtosis or peakedness of the distribution can be used to separate the two classes relatively well. This was encouraging because it meant that signal processing techniques could be applied to extract further information. Initial results in this work indicates that statistical descriptors were in general poor indicators of separability, but when applied to nonlinear SVM models as inputs resulted in acceptable separability. Initial a higher order polynomial kernel was necessary to provide a maximum of 75% LOO accuracy with all features. This detection accuracy was improved to 87.5% using only two of these statistical features (maximum acceleration and the kurtosis of acceleration distribution) extracted by a feature selection algorithm. These results indicate that an SVM classifier when trained using appropriate heel acceleration features is able to recognize ITW gait patterns in the children. The difference between ITW and normal gait is related nonlinearly in terms of acceleration, and a higher order moment reveals more differences. This method provides an accurate and a reliable gait diagnostic tool and could not only be used for differentiating ITW gait from normal gait but for detecting abnormal gait patterns in subjects with severe vestibular disorders [13] and subjects with neurological problems such as Cerebral Palsy, Acquired Brain Injury [14]. It should be noted that accelerometers are susceptible to drift during prolonged operations. The algorithm in [10] could be affected by these errors, but less so when using statistical descriptors and the more robust learning procedure offered by SVM. Future work will focus on more advanced signal processing techniques to extract more discriminative information from the accelerometry data and assess methods to deal with sensor drift effects, e.g., Kalman filters.
REFERENCES [1]
[2]
[3]
[4]
[5]
[6]
[7]
[8]
[9]
[10]
[11] [12]
[13]
ACKNOWLEDGMENT The authors would like to thank Christine Blackburn, Senior Physiotherapist and the other staff members from the Physiotherapy department at Monash Medical Centre, Melbourne for their co-operation and support during the experiments conducted at MMC on the ITW children.
ROC 0.20 0.27 0.47 0.13 0.13 0.73 0.80
[14]
4923
S. Armand, E. Watelain, “Linking Clinical measurements and kinematics gait patterns of toe walking using fuzzy decision trees”, Gait and Posture, 25 (3):p.475-484, March 2007. C. Alvarez, etal, “Classification of Idiopathic toe-walking based on gait analysis: Development and application of ITW severity classification”, Gait and Posture, 26(3): p.428-435, September 2007. T. Wren, “Gastrocnemiussoleus lengths in cerebral palsy equinus gaitdifferences between children with and without static contracture and effects of gastrocnemius recession” Journal of Biomechanics, 37(9): p.1321-7, 2004. Book- M. Palaniswami and R. Begg (2006, 03, 30). Computational Intelligence for Movement Sciences: Neural Networks and Other Emerging Techniques, ISBN 1591408377, Available: http://www.idea-group.com G. Pendharkar, D. Morgan, and P. Percival. “Distinguishing ToeWalking Gait using accelerometer in Idiopathic Toe-Walking (ITW) children” 3rd International Conference on Biomechanics of the lower limb in health disease and rehabilitation. 2005. Manchester. A.T.M. Willemsen, etal, “Real-Time Gait Assessment Utilizing a New Way of Accelerometry” Journal of Biomechanics, 23(8): p. 859-863, 1990. A.J. Padgaonkar, K.W. Krieger, and A.I.King, “Measurement of angular acceleration of a rigid body using linear accelerometers” Journal of Applied Mechanics, 1975. 42: p. 552-556 R. Moe-Nilssen, "A new method for evaluating motor control in gait under real life environment conditions. Part 2: Gait analysis" Clinical Biomechanics, 13: p. 328-335, 1998. R. Moe-Nilssen, and J.L. Helbostad, "Estimation of gait cycle characteristics by trunk accelerometry" Journal of Biomechanics, 37: p. 121-126, 2004. G.Pendharkar, D. Morgan, and P. Percival. “Information processing of the gait signals to determine the number of toe-walking steps from normal steps in Idiopathic Toe-Walking Children" IEEE Proceedings on Intelligent Sensor Sensor Network and Information Processing. 5-8 December 2005, Melbourne. V. N. Vapnik, The nature of statistical learning theory, 2nd ed. New York: Springer, 2000. R. K. Begg, M. Palaniswami, and B. Owen, "Support vector machines for automated gait recognition," IEEE Transactions on Biomedical Engineering, vol. 52 pp. 828-838, 2005. G. Pendharkar, S. Marin, R.E.Mayagoitia-Hill and P. Percival. “Triaxial AccelerometerPilot Study Designed to study the Gait of Vestibular Patients” 31st Annual Conference on Engineering and Physical Sciences in Medicine, Fremantle, Australia, 14-18th October 2007. G. Pendharkar, D. Morgan, and P. Percival. “Use of dual axis accelerometer to monitor the extent of toe-walking in cerebral palsy and acquired brain injury” 29st Annual Conference on Engineering and Physical Sciences in Medicine, Adelaide, Australia, 23-27th October 2005.