and loin eye area on chromosome 2, near IGF2, and QTL with maternal expression for drip loss and reflectance on chromosome 9. Knowledge of parental ...
Iowa State University
Breeding/Physiology
Detection and Characterization of Quantitative Trait Loci for Growth and Meat Quality Traits in a Berkshire-Yorkshire Cross Hauke Thomsen, post-doctoral research associate; Jack C. M. Dekkers, professor; Max F. Rothschild, distinguished professor; Department of Animal Science ASL-R1801 Summary and Implications The aim of this project was to identify and characterize Quantitative Trait Loci for growth, composition, and meat quality in a three-generation cross between animals from Berkshire and Yorkshire breeds of swine. Specifically, the objective was to identify QTL with parental specific expression or imprinting, i.e. QTL that only have an effect if inherited from the sire (paternal expression) or dam (maternal expression). Many QTL were identified, of which several showed evidence of parental specific expression. Imprinted QTL were identified on chromosomes 1, 2, 5, 9, and 10, including QTL with paternal expression for backfat and loin eye area on chromosome 2, near IGF2, and QTL with maternal expression for drip loss and reflectance on chromosome 9. Knowledge of parental specific expression of QTL is important and enables the strategic use of such QTL in selection programs. For example, a paternally expressed QTL for backfat would enable development of sow lines that carry and express the fatness QTL, for increased reserves, but that would not pass this on to their terminal progeny. Thus, backfat in the terminal progeny would not be increased because the QTL is not expressed when inherited from the dam. Introduction Genome scans have enabled the detection of regions on chromosomes that contain genes that affect economic traits, so-called quantitative trait loci (QTL). An example is the genome scan that was conducted at ISU in an F2 cross between the Berkshire and Yorkshire breeds (7,8). This study identified 104 QTL for 39 traits related to growth performance and meat quality. But this analysis only considered QTL with a Mendelian mode of expression. This implies that an effect of the Berkshire allele on the trait was assumed to be the same whether it was inherited from the F1 sire or from the F1 dam (see Figure 1). There is, however, evidence that the expression of some genes depends on their parental origin. For example, with paternal expression, a Berkshire gene for increased meat quality would only be expressed in the F2 progeny if it was inherited from the sire. This phenomenon is referred to as genomic imprinting and has been identified in several mammalian species. The purpose of this study was to
further analyze the Berkshire-Yorkshire cross data to identify imprinted QTL. Material and Methods Family structure The three-generation Berkshire-Yorkshire family as described by Malek et al. (7,8) was used (see Fig. 1). The family consisted of 527 F2 progeny from 8 F1 boars and 26 F1 gilts. Genotyping All animals were initially genotyped for 125 markers across the genome. An additional 35 markers were genotyped for the current analysis to extend the previous scan (7,8) in special regions of interest, where QTL had been identified. Traits measured In total 28 traits for meat quality and 11 traits for growth and body composition were measured in the F2 animals. The following subset of 13 traits was used within this report: average backfat thickness, average daily gain and loin eye area to characterize growth and composition, average glycolytic potential, average drip loss, water holding capacity, loin pH at 24 and 48 h, light reflectance in the loin at 24 and 48 h as objective measures of meat quality, and color, firmness, and marbling, as subjective measures of quality. QTL analysis New marker linkage maps were derived for all autosomes and the X chromosome. Line cross least squares regression interval mapping (4) was used for QTL mapping. Sex and year-season were included as fixed effects. Litter size was used as a covariable for some traits. To differentiate between expression of paternal and maternal alleles, the model was reparameterized following De Koning et al. (1) and several additional models were fitted. A decision tree was used to identify evidence of imprinting. Significance thresholds at the chromosome-wise level were derived for each test based on 10,000 data permutations. Results and Discussion QTL detected at the 5% chromosome-wise level are listed in Tables 1 and 2. A total of 16 QTL were discovered for growth and composition traits, of which four were significant at a 1% chromosome-wise level and another seven were significant at the 5% chromosome-wise level for Mendelian expression. QTL for growth and composition traits were located on the chromosomes 1, 4, 5, 7, 8, 9, 13, and 18. For meat quality traits, 36 QTL were detected, of which 11 were significant at a 1% chromosome-wise level
Iowa State University and 25 were significant at a 5% chromosome-wise level. QTL for meat quality were detected on chromosomes 1, 2, 4, 5, 7, 8, 11, 12, 13, 15, 17, and 18. Results of a basic scan with the Mendelian model were similar to results from the previous study (7,8). However, the increase of markers in regions of interest discovered several new QTL at a 5% chromosome-wise level. Fitting the extended models and testing based on the decision tree detected parental specific expression of QTL on chromosomes 1, 2, 5, 9, and 10. Some of these were not detected under the Mendelian model, which is shown in Figure 2. The paternally expressed QTL for BF and LEA at the proximal end of chromosome 2 (Table 2, Figure 2) confirm results of others (1,2,3,5,6,9). These QTL could be associated with IGF2. Maternal expression was detected for drip loss and loin reflectance at 48 on SSC9 (Table 1). Maternal expression was also detected in a similar region by De Koning et al. (2) for shear force and pH. In conclusion, imprinting models can detect QTL that may remain undetected with Mendelian models. Many QTL for growth, composition, and meat quality traits were detected in a Berkshire-Yorkshire cross, of which several were found to show parental specific expression. Several of these were confirmed by literature, in particular the QTL with paternal expression near IGF2. Acknowledgements Financial support from National Pork Board, Iowa Pork Producers Association, Iowa Purebred Swine Council, Babcock Swine, Danbred USA, DEKALB Swine Breeders, PIC, Seghers Genetics USA, Shamrock Breeders, and USDA/CSREES IFAFS grant # 00-52100-9610. References 1 . De Koning, D.-J., Rattink, A.P., Harlizius, B., van Arendonk, J.A.M., Braskamp, E.W. and Groenen, M.A.M. (2000) PNAS 97: 7947-7950. 2.
De Koning, D.-J., Harlizius, B., Rattink, A.P., Groenen, M.A.M., Braskamp, E.W. and van Arendonk, J.A.M. (2001) J. Anim. Sci. 79: 2812-2819.
3.
De Koning, D.-J. (2001). Doctoral thesis. Wageningen University, The Netherlands.
4 . Haley, C.S., Knott, S.A., and Elsen J.M. (1994) Genetics 136: 1195-1207 5 . Jeon, J.-T., Carlborg, Ö., Törnstein, A., Giuffra, E., Amarger V., Chardon, P., Andersson-Eklund, L., Andersson, K., Hansson, I., Lundström, K. and Andersson, L. (1999) Nat. Genet. 21: 157-158.
Breeding/Physiology 6.
Knott, S.A., Marklund, L, Haley, C.S., Andersson, K., Davies, W., Ellegren, H., Fredholm, M., Hansson, I., Hoyheim, B., Lundström, K., Moller, M. and Andersson, L. (1998) Genetics 149: 1069-1080.
7.
Malek, M., Dekkers, J.C.M., Lee, H.K., Baas, T.J. and Rothschild, M.F. (2001a) Mamm. Gen. 12: 630-636.
8 . Malek, M., Dekkers, J.C.M., Lee, H.K., Baas, T.J., Prusa, K., Huff-Lonergan, E. and Rothschild, M.F. (2001b) Mamm. Gen. 12: 637-645. 9.
Nezer, C., Moreau, L., Brouwers, B., Coppieters, W., Detilleux, J., Hanset, R., Karim, L., Kvasz, A., Leroy, P. and Georges, M. (1999) Nat. Genet. 21: 155-156.
Iowa State University
Breeding/Physiology
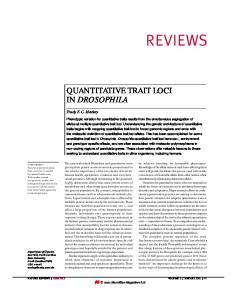
Figure 1. Design of the Berkshire * Yorkshire pedigree. Berkshire and Yorkshire alleles are indicated by B and Y. With Mendelian expression, BY and YB F2 progeny do not differ in phenotype. With paternal expression, only the allele inherited from the sire is expressed; BB and BY F2 progeny have the same phenotype and differ from YB and YY F2 progeny. Similarly, for maternal expression, BB and YB F2 progeny differ in phenotype from BY and YY progeny.
F0
2 Berkshire-Sires BB
F1
8 Sires
F2
527
x
BY
BB
9 Yorkshire -Dams YY
BY
x
BY
26 Dams
YB
YY
Table 1. QTL detected for growth and composition and their mode of inheritance. Chr. Trait 1 Average 1 Loin Eye Area 1 Loin Eye Area 1 Loin Eye Area 2 Average 2 Loin Eye Area 4 Average Daily 4 Loin Eye Area 5 Average 7 Average 8 Average Daily 9 Average Daily 9 Loin Eye Area 10 Loin Eye Area 13 Average 18 Average * Significant at