Detection and Estimation of Pulsar Signals for Navigation Chr. Kabakchiev1, V. Behar2, P. Buist3, R. Heusdens4, I. Garvanov5, D. Kabakchieva6 N. Gaubitch7, M. Bentum8 1
Sofia University, Sofia, BULGARIA
[email protected]
2
Institute of Information and Communication Technologies, Sofia, BULGARIA
[email protected] 3
National Aerospace Laboratory, Amsterdam, THE NETHERLAND
[email protected] 4
Technical University, Delft, THE NETHERLAND
[email protected] 5
University of Library Studies and Information Technologies Sofia, BULGARIA
[email protected] 6
University of World and National Economy, Sofia, BULGARIA
[email protected] 7
Technical University, Delft, THE NETHERLAND
[email protected]
8
Twente University, Enschede, THE NETHERLAND
[email protected]
Abstract: The paper focuses on scientific issues related to new application of pulsar signals for airplane-based navigation. A possible algorithm for processing of pulsar signals that consists of epoch-folding, matched filtering and detection is proposed and evaluated in this paper. The algorithm proposed is verified using the real experimental data obtained from the radio observatory Dwingeloo, the Netherland. The serious trouble in this study is that the total number of the input data within a repetition period is much more of the number of samples in a pulsar template taken from the EPN database. Therefore have been developed and evaluated two new algorithms for epoch-folding, which not only improve Signal-to-Noise Ratio of pulsar signals but as well reduce the number of samples of the output signals to the required number.
1. Introduction Pulsars are types of neutron stars, which periodically emit broadband electromagnetic pulses [1]. The period of emission and the average pulse shape are relatively stable and characterize each pulsar. In the [1,2,3,4] discuss the possibility of an autonomous navigation system for spacecraft that is based on pulsar timing data because the pulsar signals are stable in time and provide temporal signatures, which can be used as navigation beacons for navigation on Earth. This new technology can be an alternative to standard navigation based on radio tracking by GPS ground stations, without the disadvantages of uncertainty increasing with distance from Earth and the dependence on the ground control. The key constraints towards designing the pulsar-based navigation system are the very poor input SNR of pulsar signals,
corrupted by impulsive interference, broadband interference and sometimes periodic terrestrial radiation, and the time-consuming processing of pulsar signals [2,5,6]. The standard algorithm for processing of pulsar signals implemented in most of radio observatories usually includes epoch-folding (signal integration during a lot of pulse repetition periods) and intensity imaging [2]. In a pulsar-based navigation system, however, pulsar signals should be automatically acquired and detected regardless of very low SNR. The standard way to improve SNR of pulsar signals is to integrate received signals during the very large number of pulse repetition periods. This operation called as an epoch-folding processing requires much time (one-two hours) [6]. Another approach to improve SNR is to use a matched filter after the epoch-folding [7]. In this paper, a possible algorithm for processing of pulsar signals that consists of epochfolding, matched filtering and adaptive detection is proposed, evaluated and verified using the real experimental data collected by the radio observatory Dwingeloo, the Netherland. The serious trouble in this study is that the total number of the input data is much more of the number of samples in the pulsar template taken from the EPN database. Therefore have been developed and evaluated two new algorithms for epoch-folding, which not only improve Signal-to-Noise Ratio of pulsar signals but as well reduce the number of samples of the output signals to the required number. The experimental data contains the noisy signal received from B0329+54 pulsar.
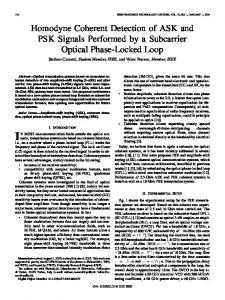
2. Signal Processing The block-scheme of the proposed algorithm for processing of pulsar signals is shown in Fig.1. The algorithm includes the following stages: epoch-folding of the data during a set of periods; SNR estimation after epoch-folding; calculation of the impulse response of the matched filter; matched filtering in the frequency domain; SNR estimation at the matched filter output and, finally, automatic adaptive detection of a pulsar pulse. Number of periods High-pass Filtering
Specific Folding
10-to-16 Conversion
MAFJW Folding
Raw data
Pulsar SNR Estimation
Matched Filtering
Number of periods
SNR Estimation Detection (CFAR) (Heuristic) Yes /No
Figure 1: Block-scheme of signal processing
Specific epoch-folding The total number of samples of the input data within a repetition period is determined as N=P·fS, where P-is the repetition period of a pulsar pulse and fS is the sampling rate of the input data. Taking into account that the experimental data from Dwingeloo has P=0.714s and fS=70 MHz, the total number of samples of the input data within a single repetition period is N= 499800000. In order to use the pulsar template from the EPN database, which has 1024 samples, we applied the specific epoch-folding algorithm to the input data. This epoch-folding algorithm performs two functions simultaneously: integrates a signal power during a set of repetition periods of the input data and reduces the number of samples of the output signal
from N=499800000 to M=1024. This specific epoch-folding algorithm can be written mathematically as follows: Pm = ∑ N
P
∑ ∑ K
i2
1
i1
C 2j ,k , m , where C j ,k ,m = FFT { Ak ,m , N FFT = 64}, m = 1,...,64
(1)
In (1) NP is the number of integrated periods. According to (1), the period of the input signal, which consists of N sample, is divided into 1024 time intervals. Each of these time intervals is again divided into K non-overlapping 64-element windows. At each time interval the signal power is estimated as a sum of the signal power of K non-overlapping windows. In each of these 64-element windows the FFT is performed and the signal power estimate is obtained as a sum of the signal power from i1-th to i2-th frequency channels corresponding to the frequency band of the input signal. A set of the input signal amplitudes Ak,m in k-th 64element window is formed by the input data samples from the time interval: Ak ,m = AL +1 ... AL + 64 (2) The parameters K in (1) and L in (2) are formed as: K = E[ N / 1024], L = 1024(m − 1)(k − 1), k = 1,..., K (3) MAFJW epoch-folding The MAFJW epoch-folding integrates the outputs of the Moving Average Filter with a jumping window (MAFJW) during Np repetition periods. The filter is a modified version of the Moving Averaging Filter (MAF), which firstly divides the signal repetition period into K non-overlapping intervals (windows) of size M and then calculates the average of samples in each interval. Therefore, in each repetition period, the MAFJW acts not only as a low-pass filter but as well as a decimator. When the signal processing is carried out in the time domain, the use of the MAFJW can be very useful in the sense of reducing the processing time. Template of B03219+54 pulsar The template of B0329+54 pulsar is taken from the EPN database. The pulsar template is sampled at the sampling frequency of 1.4493 KHz and contains 1024 samples. Matched filter The performance of the matched filter in the frequency domain can be expressed mathematically as: y f [k ] = IFFT {H ( f ) ⋅ Y ( f )} , where H ( f ) = FFT { p[k ], k = 1...K } (4) In (4), Y(f) is the signal spectrum at the matched filter input, H(f) is the frequency impulse response of the matched filter, and p is the pulsar template. SNR estimation The value of SNR is calculated as the following ratio: SNR = [ Ps , max − mean( Pn )] / σ ( Pn ) (5) In (5) Ps,max is the maximal signal power at the interval where the pulsar signal is present, Pn is the noise power at the interval where only the noise is present, and σ is the standard deviation of the noise power. CFAR detection The CFAR detection approach is based on the criterion of Neyman – Pearson. According to this criterion, the following algorithm can be used for testing a simple hypothesis H1 (pulsar signal is present) against a simple alternative H0 (pulsar signal is absent): L ′ H 1 : if max{Py [k ]} ≥ T fa ∑ Py [l ] Ho
l =1
otherwise
(6)
In the decision rule (6), Py,[k] is the signal power samples at the CFAR detector input, L is the size of a reference window used for estimating of the noise power and P’y[l] are the signal power samples within the refernce window. In order to detemine the reference window all input power samples Py[k] are sorted in the ascended order and the first L sorted samples form the reference window. The detection constant Tfa is determined in accordance with the probability of false alarm maintained by the detection algorithm. We assume that the hypothesis H1 is verified in only one single sample, which contains the maximal value of the signal power. In that case the probability of false alarm is defined as: PFA = 1 − [1 − Pfa ] K (7) In (7), K is the total number of samples, and Pfa is the probability of false alarm in each sample. In case of mean zero Gaussian noise at the output of the matche filter, the probability of false alarm to be maintained in a single sample is: Pfa = 1 /(1 + T fa ) K (8) The probability Pfa is determined as a root of the equation (7) for a given probability of false alarm PFA. The solution of (8) gives the detection constant: −1 / L T fa = Pfa −1 (9) Heuristic detection Similar to the criterion used in the software-defined GPS receiver for C/A code acquisition, the following algorithm can be used for testing a simple hypothesis H1 (pulsar signal is present) against a simple alternative H0 (pulsar signal is absent) [8]:
H 1 : if Pmax,2 {Py [k ]} < 0.5Pmax,1{Py [k ]} H 0 : if Pmax, 2 {Py [k ]} ≥ 0.5Pmax,1{Py [k ]}
(10)
In (10), Pmax,1 is the global maximum of the power Py[k], Pmax,2 is the second maximum of the power Py[k]. Shorty said the criterion of pulsar signal detection is: the first power peak value should be at least two times more the second power peak.
3. Numerical Results The observing frequency of the experimental data collected by the observatory Dwingeloo is 1330 MHz, which ends up on the IF frequency of 21.4 MHz in the recorded IF-data. The receiver inverts the spectrum, so the frequency of 20.4 MHz in the recorded data corresponds to a frequency of 1331 MHz in the receiver. The bandwidth recorded is 30 MHz, and the central frequency is 21.4 MHz central. The pilot signal at 1 MHz is present outside of the pass-band, and removed by the high-pass filter (Fig.2). The experimental data is sampled at frequency of 70 MHz.
a) Figure 2 .Signal spectrum after high-pass filtering
b)
The signal spectrum at the output of the high-pass filter that removes a pilot signal at 1MHz is shown in Fig. 2a. The power distribution on frequency channels is shown in Fig. 2b. In that case the parameters i1 and i2 in (1) are defined as i1=5 and i2 =32. For comparison, the values of SNR estimated after the two types of epoch folding (specific epoch-folding and MAFJWfolding) for different numbers of integrated periods of the input data are plotted in 5. It can be seen that the MAFJW-folding provides the SNR level by 1.5dB-2dB higher that the specific epoch folding. It should be taken into account in the process of real-time implementationof epoch-folding. From Fig.5 follows that in result of folding the useful signal becomes more distinguishable against the background noise. However, the SNR at the detector input is insufficient for reliable detection of pulsar signals. The usage of the matched filter after epoch-folding allows additionally to improve SNR before detection. For example, the output signal of the matched filter is shown in Fig.3 – in case of the specific epoch folding and in Fig. 4 – in case of the MAFJW epoch-folding. In both cases the number of integrated periods is 10. The SNR values calculated at the matched filter output when the number of integration periods varies in the interval from 1 to 400 are plotted in Fig. 6 for two types of epochfolding. From Fig.6 follows, that the usage of the MAFJW epoch-folding before the matched filter additionally improves SNR at the matched filter output by 1dB÷1.5 dB compared to the specific epoch-folding. The output signals of the matched filter are further performed by the two detectors, CFAR and Heuristic. The corresponding thresholds of the two detectors are shown in Fig3, and Fig.4.
Figure 3: MF output (specific folding, 10 periods)
Figure 5: SNR after epoch-folding
Figure 4: MF output (MAFJW-folding, 10 periods)
Figure 6. SNR after matched filtering
The probability of false alarm to be maintained by a CFAR detector is 1.e-2. This value is used to determine the CFAR threshold. The effectiveness of the two detectors can be compared by using of the threshold levels set by the detectors. In case when the number of integrated periods is large, the two detectors set approximately equaled thresholds. However, when the number of integrated periods is small, the CFAR detector set lower thresholds than the heuristic detector. To detect a pulsar signal with a probability of 0.7, while maintaining a false alarm probability of 0.01, it is necessary to provide SNR of at least 12dB at the matched filter output. Analysis of results in Fig.6 shows that for that aim it is sufficient to integrate 10 periods before matched filtering.
4. Conclusions A possible variant of signal processing for detection of very weak pulsar signals is proposed and evaluated in this paper. The algorithm proposed includes: epoch-folding, matched filtering and adaptive detection. Two new algorithms for epoch-folding, which not only improve Signal-to-Noise Ratio of pulsar signals but as well reduce the number of samples of the output signals to the required number are developed and evaluated. The effectiveness of the signal processing algorithm is evaluated in terms of SNR estimated after the two operations, epoch-folding and matched filtering. The algorithm proposed is verified on the experimental records of signals from B0329+54 pulsar provided by the Dwingeloo radio observatory, the Netherland.
Acknowledgment This work is partly financially supported by the project FNI T 02/2014 and the European FP7, project № 335063 (PulsarPlane).
References: [1] [2]
[3] [4] [5] [6]
[7]
[8]
Times New Roman, 11 pt) D. Lorimer, and M. Kramer, Handbook of pulsar astronomy, Cambridge university press, N.Y.,2005 Mike Georg Bernhardt, Werner Beckery, Tobias Prinz, Ferdinand Maximilian Breithuth and Ulrich Walter, Autonomous Spacecraft Navigation Based on Pulsar Timing Information, Bernhardt, et. al. 2011, arxiv-version.pdf J. Sala et al., “Feasibility study for a spacecraft navigation system relying on pulsar timing information,” Tech. Rep. 03/4202, ARIADNA Study, June 2004. V. Chaudhri, “Fundamentals, Specifications, Architecture and Hardware towards Navigation System Based on Radio Pulsars”, M.Sc. Thesis, TU Delft, 2011 R. Eatough, E. Keane, A. Lyne,” An Interference Removal Technique for Radio Pulsar Searches”, MNRAS, 395, 2009, pp.410-415 P. Buist, S. Engelen, A. Noroozi, P. Sundaramoorthy, S. Verhagen, and C. Verhoeven,”Overview of Pulsar Navigation: Past, Present and Future Trends”,Journal of the Institute of Navigation”,vol.58, No 2, 2011, pp.153-164 R. Heusdens, S. Engelen, P. Buist, A. Noroozi,P. Sundaramoorthy, C. Verhoeven, M. Bentum, E. Gill, “Match Filtering Approach for Signal Acquisition in Radio-Pulsar Navigation”, Proc. of the 63rd International Astronautical Congress, Naples, Italy, 2012 K. Borre, D. Akos, N. Bertelsen, P. Rinder, S. Jensen, “A Software-Defined GPS and Galileo Receiver: Single-Frequency Approach”, Birkhäuser, Boston, MA, 2006