Katholieke Universiteit Leuven Departement Elektrotechniek
ESAT-SISTA/TR 2003-99
Detection of fast neuronal signals in the motor cortex from functional near infrared spectroscopy measurements using independent component analysis. 1 Geert Morren2 , Martin Wolf3 , Philippe Lemmerling2 , Ursula Wolf3 , Jee H. Choi3 , Enrico Gratton3 , Lieven De Lathauwer2 and Sabine Van Huffel2 Medical and Biological Engineering and Computing Vol. 42, No. 1, p 92-99, January 2004
1
This report is available by anonymous ftp from ftp.esat.kuleuven.ac.be in the directory pub/sista/morren/reports/03-99.pdf
2
K.U.Leuven, Dept. of Electrical Engineering (ESAT), Research group SCDSISTA, Kasteelpark Arenberg 10, 3001 Leuven, Belgium, Tel. 32/16/32 18 57, Fax 32/16/32 19 70, WWW: http://www.esat.kuleuven.ac.be/sista, E-mail:
[email protected]
3
University of Illinois at Urbana-Champaign, Laboratory for Fluorescence Dynamics, 1110 W. Green St., Urbana, IL 61801-3080, U.S.A. This work was supported in part by the research council K.U.Leuven: GOAMefisto 666, IDO/99/003 and IDO/02/009 (Predictive computer models for medical classification problems using patient data and expert knowledge), by the Flemish government: FWO projects G0200.00, G0078.01, G0407.02, G0269.02, G0270.02 and G0240.99, by the Belgian federal government: DWTC (IUAP V-22) and by the EU: NICONET, INTERPRET, PDT-COIL, MRS/MRI signal processing (TMR). This research was also supported by NIH grant CA57032.
Abstract Fast changes in the range of milliseconds in the optical properties of cerebral tissue, which are associated with brain activity, can be detected using non-invasive near-infrared spectroscopy (NIRS). These changes are assumed to be caused by changes in the light scattering properties of the neuronal tissue. The aim of this study was to develop highly sensitive data analysis algorithms to detect this fast signal, which is small compared to other physiological signals. A frequency-domain tissue oximeter, whose laser diodes were intensity modulated at 110 MHz was used. The amplitude, mean intensity and phase of the modulated optical signal were measured at a sample rate of 96 Hz. The probe consisting of 4 crossed source detector pairs was placed above the motor cortex, contralateral to the hand performing a tapping exercise consisting of alternating rest- and tapping periods of 20 s each. An adaptive filter was used to remove the arterial pulsatility from the optical signals. Independent component analysis allowed to further separate a signal component containing the fast signal. In 9 out of 14 subjects a significant fast neuronal signal, related to the finger tapping, was found in the intensity signals. In the phase signals, we only found indications of the fast signal in 2 subjects.
Detection of fast neuronal signals in the motor cortex from functional near infrared spectroscopy measurements using independent component analysis G. Morren1
M. Wolf2 E. Gratton2
P. Lemmerling1 L. De Lathauwer1
U. Wolf2 J.H. Choi2 S. Van Huffel1
1 2
Department of Electrical Engineering (ESAT), SCD-SISTA Division, K.U.Leuven, Belgium Laboratory for Fluorescence Dynamics, University of Illinois at Urbana-Champaign, USA
Abstract—Fast changes, in the range of milliseconds, in the optical properties of cerebral tissue are associated with brain activity and can be detected using noninvasive near-infrared spectroscopy (NIRS). These changes are assumed to be caused by changes in the light scattering properties of the neuronal tissue. The aim of this study was to develop highly sensitive data analysis algorithms to detect this fast signal, which is small compared with other physiological signals. A frequency-domain tissue oximeter, whose laser diodes were intensity modulated at 110 MHz, was used. The amplitude, mean intensity and phase of the modulated optical signal were measured at a sample rate of 96 Hz. The probe, consisting of four crossed source detector pairs was placed above the motor cortex, contralateral to the hand performing a tapping exercise consisting of alternating rest and tapping periods of 20 s each. An adaptive filter was used to remove the arterial pulsatility from the optical signals. Independent component analysis allowed further separation of a signal component containing the fast signal. In nine out of 14 subjects, a significant fast neuronal signal related to the finger tapping was found in the intensity signals. In the phase signals, indications of the fast signal were found in only two subjects. Keywords—Near-infrared spectroscopy, Functional monitoring, Independent component analysis, Time–frequency analysis, Adaptive filtering Med. Biol. Eng. Comput., 2004, 42, 92–99
1 Introduction IN RECENT years, near-infrared spectroscopy (NIRS) has been proposed as a method to study brain activity non-invasively (OBRIG and VILLRINGER, 2003). Two major types of optical signal following functional brain activation can be observed. The slow, haemodynamic signal, which occurs within seconds of the onset of the stimulation, is based on increased blood perfusion in an area of activated neurons due to neurovascular coupling. A period of stimulation induces an increase in oxygen consumption in the active neurons, closely followed by an increase in blood flow. This, in turn, changes the haemoglobin concentrations and oxygenation, which can be measured using NIRS, positron emission tomography (PET) and functional magnetic
Correspondence should be addressed to Dr Geert Morren; email:
[email protected] Paper received 26 June 2003 and in final form 20 October 2003
MBEC online number: 20043850 # IFMBE: 2004
92
resonance imaging (fMRI)(VILLRINGER and CHANCE, 1997; OBRIG and VILLRINGER, 2003). The latter techniques, and especially FMRI, provide good spatial resolution (TOGA and MAZZIOTA, 1996). The temporal resolution of this signal, however, is limited, owing to the properties of the haemodynamic changes, which are only indirectly related to neuronal activity. The fast signal, on the other hand, which occurs within milliseconds of the onset of stimulation, relies on optical, magnetic and electrical changes directly related to neuronal activity. The optical changes associated with neuronal activity, presumably in the light scattering properties of the neurons, can be measured using NIRS (TASAKI, 1999; GRATTON and FABIANI, 2003). The fast electrical and magnetic changes can be measured using electroencephalography (EEG) and magneto-encephalography (MEG), respectively. NIRS is the only method able to measure both the fast neuronal signal and the slow haemodynamic signal simultaneously, although the haemodynamic-related absorption changes are much larger and easier to observe than the fast neuronal changes in the optical signals. Therefore NIRS is a unique Medical & Biological Engineering & Computing 2004, Vol. 42
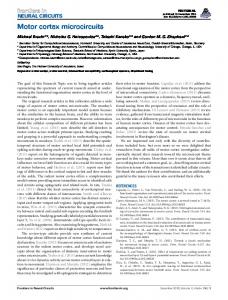
approach to the study of neurovascular coupling (VILLRINGER and CHANCE, 1997), combining sub-centimetre spatial localisation with millisecond temporal resolution (GRATTON and FABIANI, 2001). An important advantage of NIRS is that it is non-invasive and can be used at the bedside. Owing to the limited penetration of light into living tissue, however, only superficial layers of the brain can be reached with NIRS (GRATTON and FABIANI, 2001). The present paper deals with the detection of the fast neuronal signal in the motor cortex. As a finger-tapping exercise was used as stimulation, the fast signal is correlated with the tapping frequency. It is, however, very small compared with other physiological signals, such as arterial pulsatility (due to systole and diastole). Therefore highly sensitive data analysis algorithms have been developed. In a previous study, it has already been shown that the fast signal can be detected in the motor cortex using frequency-domain NIRS (WOLF et al., 2002). The detection method was based on the cross-correlation function of the optical data with the tapping signal (finger movement) over a measurement period of 5 min. The main contribution of the present paper is the use of more advanced signal processing techniques allowing the separation of a signal component containing the fast signal. Using adaptive filtering and independent component analysis (ICA), signal components are extracted in which the individual stimulation periods of 20 s can be identified. 2 Materials and methods 2.1 Subjects Three female and 11 male healthy adult volunteers (between 19 and 55 years) were included in this study. All except one were right handed. Written informed consent was obtained from all subjects prior to the measurements. 2.2 Measurements An instrumental low-noise system was developed for the NIRS measurements (WOLF et al., 2002; MORREN et al., 2002). A two-wavelength frequency-domain tissue oximeter*, whose laser diodes were intensity modulated at 110 MHz, was used. The light of four laser diodes, at either 758 nm (sources 1 and 3) or 830 nm (sources 2 and 4), was combined to provide a higher light intensity at each source location. The power output of each laser diode was 5 mW (laser class 3a). All sources and detectors were arranged on a circle with a diameter of 3.2 cm, as shown in Fig. 1. So that the light of the four source locations could be distinguished, the laser diodes were multiplexed. At each of the four detectors (A,B,C,D), the amplitude (AC), mean intensity (DC) and phase (PH) of the modulated optical signal were measured. The sample rate for a complete cycle, which measures all 48 parameters (AC, DC and PH for 16 source– detector pairs), was 96.1539 Hz. Representative fragments of DC and PH signals are shown in Figs 2a and b. It can already be seen that the PH signals are much more noisy than the DC signals. In addition to these optical signals, the arterial pulsations, the respiration and a signal synchronous with the finger tapping were measured. The arterial pulsations were acquired by means of a pulse oximeter{ attached to the left hand, whilst the tapping was performed with the right hand and vice versa. The respiratory signal was obtained from a breathing belt fixed around the chest. Using a strain gauge{, a signal proportional to the tension in the belt was derived. An electronic device *Oxy-Imager, ISS Champaign, IL, USA { {
N200, Nellcor Incorporated New Life Technologies
Medical & Biological Engineering & Computing 2004, Vol. 42
Fig. 1 Configuration of NIRS sensor with 4 sources (6) and 4 detectors ( s) arranged on circle with diameter 3.2 cm. Sensor was placed above motor cortex (C3 position)
registered the tapping movement. The amplitude of this signal was independent of the amplitude of the finger movement. Representative fragments of each of these signals are shown in Figs 2c–e. 2.3 Protocol The sensor, consisting of the four crossed source detector pairs, was placed above the motor cortex (C3 position according to the international 10=20 system (JASPER, 1957)), contralateral to the hand performing the finger-tapping exercise. The tapping frequency was set, with a metronome, at approximately 2.5 times the heart rate of the subject to avoid the influence of harmonics of the arterial pulsations on the fast neuronal signal. The measurement protocol consisted of a 1 min pre-exercise period (baseline), a 5 min stimulation run with alternating rest and tapping (with the whole hand) periods of 20 s each (corresponding to a frequency of 0.025 Hz), and a 1 min after-exercise period (baseline). For two subjects, the stimulation runs had different durations. Overall, there were 14 subjects: 12 with stimulation runs of eight tapping periods, one with 16 tapping periods and one with six tapping periods. The subjects were supine in a quiet, dark room and wore safety goggles during the whole measurement. The protocol was approved by the Institutional Review Board of the University of Illinois at Urbana-Champaign (IRB 94125). 2.4 Signal processing The fast neuronal signal is so small compared with other physiological signals that it cannot be directly observed in the NIRS signals. In fact, the largest alterations in the optical signals are caused by the arterial pulsatility due to systole and diastole. This pulsatility was first reduced in each NIRS signal using an adaptive filter. However, even after filtering, the fast signal can hardly be detected in individual NIRS signals. Apparently, a multichannel technique is needed to exploit the information in different NIRS signals (light bundles) simultaneously. Therefore independent component analysis (ICA) was applied to the set of all filtered NIRS signals (per subject) to extract a signal component where the fast signal could be detected more clearly. 2.4.1 Adaptive filtering The physiological noise due to the arterial pulsations was removed from the NIRS signals using an adaptive filter. Two different filters were compared. 93
Fig. 2 Representative fragments of different signals of subject 3: (a) mean intensity (DC) signal CDC3 (detector C, source 3); (b) phase (PH) signal CPH3 (detector C, source 3); (c) arterial pulsations recorded with pulse oximeter; (d) respiration signal recorded with strain gauge; (e) tapping signal, which is low when fingers are touching each other
First, a standard interference canceller was used, as shown in Fig. 3, where the adaptation is based on the normalised leastmean-square (NLMS) algorithm (HAYKIN, 1996). The primary signal, which serves as the desired response for the adaptive filter, is, in our case, the NIRS signal containing the signal of interest (tapping) and noise (arterial pulsations). The pulse oximeter signal, which contains the arterial pulsations but not the tapping signal, is used as input to the adaptive filter (noise reference) to reduce the noise in the NIRS signal. An adaptive filter with 300 taps was used, and the adaptation constant of the NLMS algorithm was set to 0.1. In some measurements, however, the pulse oximeter signal was saturated, resulting in a distorted waveform, resembling a square wave, of the arterial pulsations. In those cases, a filter was used that only uses the NIRS signals and not the pulse oximeter signal. This filter is described in detail elsewhere (GRATTON and CORBALLIS, 1995). In short, it extracts a mean shape of the pulse by screening each trace separately for pulses, whose period is adjusted before the averaging. This mean shape corresponds to the best estimate of each pulse and is used to remove each pulse from the data. This again requires adjusting the period of the mean shape to that of each pulse and scaling the shape by linear regression. In the remainder of this paper, this filter is abbreviated to HF. 2.4.2 Independent component analysis (ICA) ICA is a technique that allows blind recovery (ICA is also called ‘blind source separation’) of statistically independent
Fig. 3 94
Interference canceller: primary signal ¼ DC signal (NIRS); noise reference ¼ arterial pulsation signal (pulse oximeter)
source signals from linear mixtures of these source signals. The following linear statistical model is assumed (HYVA¨RINEN et al., 2001; COMON, 1994): x ¼ As þ n (1) where x and n are vectors of size m (the number of light bundles) representing the observations and the disturbances (in the form of additive noise), and s is a vector of size n representing the n sources. The goal is to identify the m6n mixing matrix A and=or the source vector s, only from the corresponding observations x. The basic assumption used to solve this problem is that the components of s are mutually statistically independent, as well as independent of the noise components. Assuming that the tapping is statistically independent of the other physiological sources (heart rate, respiration), ICA should be able to separate them. The ICA problem is usually solved by a two-stage algorithm. In the first step, an n6m matrix W is calculated such that the transformed observations z ¼ Wx are ‘white’, i.e. its components are uncorrelated, and their variances equal unity (hence, E[zz* ] ¼ I, where z* stands for the hermitian transpose of z). The whitening matrix W can be determined using only secondorder statistics (i.e. from the covariance matrix Rx ¼ E[x x* ] of the observations). This prewhitening step, which amounts to a principal component analysis (PCA), can also be used to reduce the dimensions of the data. In a second step, a unitary n6n matrix U is calculated such that A ¼ pinv(W )U, where pinv(W ) denotes the Moore– Penrose pseudo-inverse. In ‘general’ ICA algorithms, the matrix U is determined from higher-order statistics, (COMON, 1994; CARDOSO, 1999; DE LATHAUWER, 1997). For temporally correlated signals, however, the time dependence structure can be exploited, and U can also be retrieved from covariance matrices at non-zero lags (hence, using only second-order statistics) (BELOUCHRANI et al., 1997; ZIEHE and MU¨LLER, 1998; MOLGEDEY and SCHUSTER, 1994). As the optical signals are clearly temporally correlated, we used an algorithm that exploits this structure, namely SOBI (BELOUCHRANI et al., 1997). The SOBI algorithm is based on the simultaneous diagonalisation of a set of covariance matrices at different lags. For this study, we used ten covariance matrices at lags of 10, 20, . . . , 100 samples. Experiments with various other lags showed that these values could yield the best results for our data. The performance of SOBI was compared with that of several other algorithms (JADE (CARDOSO, 1999); fastICA (HYVA¨RINEN and OJA, 2000); Infomax (BELL and SEJNOWSKI, 1995); TDSEP (ZIEHE and Mu¨LLER, 1998)), including some ‘general’ ICA algorithms, for this application, but these did not give any better results. 3 Results From the theory of photon migration, it is known that DC and AC signals contain the same information. Therefore, as the signal-to-noise ratio (SNR) of the AC signals is smaller than that of the DC signals (WOLF et al., 2002), only the DC and PH signals were analysed in this study. Fig. 2a shows the CDC3 signal (DC, detector C, source 3) in subject 3 (according to Table 1). This signal is representative of the other DC signals, although the signal strength depends on the distance between source and detector and differs between subjects. The dominant frequency is due to the arterial pulsations. As shown in Fig. 2b, the PH signals are much more noisy. The power spectra of representative DC and PH signals (ADC4 and APH4) were estimated using the Welch method (KAY, 1988), with non-overlapping windows of 15 000 samples (156 s), and are shown in Fig. 4. A signal of the longer measurement of subject 9 was used for Fig. 4 as this allowed us to average several periodograms of such long windows. Medical & Biological Engineering & Computing 2004, Vol. 42
Table 1 Overview of subjects and summary of significance of filtered DC and PH signals Subject numbers
Sex
Age
1 2 3 4 5 6 7 8 9 10 11 12 13 14
M M M M M M F M M M M F F M
22 45 55 28 44 22 30 19 35 19 22 26 37 38
Filter
Detected harmonic
DC: minimum p-value rank-sum test
DC number of channels with p50:05
PH: minimum p-value rank-sum test
PH number of channels with p50:05
NLMS NLMS NLMS NLMS HF NLMS NLMS NLMS NLMS HF HF NLMS NLMS NLMS
3rd 1st 1st 2nd 1st 3rd 3rd 1st 2nd 2nd 2nd 1st 1st 3rd
0.0002 0.0030 0.0003 0.0002 0.0104 X 0.0002 0.0499 0.0002 0.0011 0.0019 0.0022 0.0207 X
4=14 7=15 11=16 9=16 2=14 0=14 4=16 1=14 4=16 1=14 1=15 4=14 1=14 0=14
X 0.0019 0.0379 0.0148 0.0281 0.0047 X 0.0379 X X X X X 0.0281
0=14 2=15 1=16 2=16 1=14 2=14 0=16 1=14 0=16 0=14 0=15 0=14 0=14 1=14
X ¼ not significant ( p40:05)
In the power spectrum of ADC4, the dominant frequencies between 1 Hz and 5 Hz are the heart rate (arterial pulsations), around 1.4 Hz, and its harmonics. As the heart rate is not perfectly constant during the whole measurement, the peaks are smeared out. At the tapping frequency (3.55 Hz), no peak can be distinguished without prior knowledge about the tapping frequency. There are also peaks in the lower frequency range (