Detection of Power-Line Interferences in ECG signal using Frequency-Domain Analysis Constanza Lehmann1 , J¨urgen Reinst¨adtler2 , Antoun Khawaja1 1
2
Biosigna GmbH, Munich, Germany eResearchTechnology GmbH, H¨ochberg, Germany
Abstract ECG signals can be seriously distorted by Power-Line Interference (PLI), the electromagnetic interference of power-line cables. This contamination can lead to imprecise measurements of the ECG wave durations and amplitudes. Therefore, the accuracy of the ECG analysis can be significantly reduced. The aim of this study was to develop and test a PLI detection algorithm, including the automatic recognition of the correct frequency and evaluating their level of inference. This enables an appropriate filtering whenever needed.
algorithm is validated with more than 12000 ECG signals of 10 second length recorded in different countries. Some of them featured PLI and some of them did not. The first section describes the implemented algorithm where as the second section evaluates the capability of the new method and observes results with real data. In the last section we give concluding remarks on this paper.
2.
Method A signal 𝑥 contaminated with PLI can be described as 𝑥 = 𝑥𝐸𝐶𝐺 + 𝑒𝑃 𝐿𝐼
1.
Introduction
Recordings are often contaminated with power-line interferences of different characteristics. These interferences need to be detected prior to most filtering techniques to minimize the risk of signal distortion. Thus the implementation of an algorithm for detecting interferences caused by the country specific power-line (50 or 60 Hz) and corresponding harmonics, the multiples of power-line, is needed. Additionally a strength measure for each detected harmonic is calculated. This strength measure can be a useful value for quality check and the basis for a filter algorithm. In [1] the energy at possible harmonic frequencies is compared with energy at neighboring frequencies to decide whenever a PLI is present or not. Another approach is observed by both Levkov [2] and Bazhyna [3]. They use the linear segments in ECG to estimate the PLI over the power spectrum density. One main disadvantages is that QRS complexes and linear segments need to be detected prior to PLI detection. In this work the fundamental idea of [2] and [3] is simplified. No detection of linear parts is necessary. The frequency components caused by the ECG signal are removed in the PSD later on. To explore the capabilities of this method, first real ECG signals with no PLI are distorted with artificial sinusoidal interferences with different harmonic frequency and amplitudes. Finally, the performance of the detection
where 𝑥𝐸𝐶𝐺 is the true ECG signal and 𝑒𝑃 𝐿𝐼 is the error introduced by PLI interferences. In the following harmonics ℎ𝑛 [Hz] are defined as ℎ𝑛 = 𝑛 ∗ 𝑘 with 𝑛 equal to 50 or 60 [Hz] and 𝑘 = 1, 2, .... the corresponding multiplier. In general only the first three harmonics are of interest, because they overlap with the ECG spectra.
2.1.
Power spectral density
In this work the theoretical foundation is the ECG’s Power Spectral Density (PSD). In the presence of PLI the PSD consists of a part caused by the ECG itself and a part caused by PLI. The latter part produces narrow peaks at corresponding frequency. In practice the shape of the calculated PSD is also influenced by spectral leakage and windowing. Thus, the PSD is calculated using Welch’s method with an appropriate window size balancing between variance reduction and resolution. The length of the observed ECG record or the observed interval must be chosen to enable a variance reduced PSD estimation. This is achieved by averaging the PSD in minimal 10 overlapping intervals. The chosen window length of each interval has to enable an accurate frequency resolution, to facilitate a
decision between 50 and 60 Hz peaks. A frequency resolution near 1 Hz is appropriate. For example for an ECG signal recorded with 500Hz a window size of 512 samples is appropriate. For an overlap of window size half over 2800 samples or in other words more than 5.6 seconds are needed. The PSD part estimating the frequencies of the portion of ECG’s PSD can be approximated as a low frequency part in the PSD function using Wavelet Analysis. Eliminating the ECG part in the PSD enables peak detection in the residual PSD. Here information about harmonics and their strengths are obtained. Notice that the transform to PSD scale is logarithmic, not linear.
2.2.
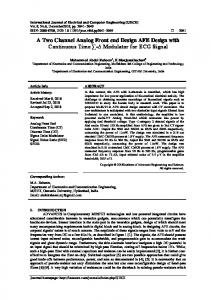
(a)50Hz PLI for ten test signals
Peak detection
To amplify peaks and to suppress small peaks we square and smooth the residual PSD. A peak has a high positive velocity followed by a zero velocity and a high negative velocity afterwards. Smoothing in the squared velocity will combine these two velocity peaks to one big peak. Afterwards an adaptive threshold obtained from a low pass filtered residual PSD is used to detect peaks. Peaks are detected as intervals above this threshold. As a strength measure the corresponding amplitude in the unchanged residual PSD is taken. Because of spectral leakage the calculated PSD is never exact. Small peaks at arbitrary frequencies occur due to side lobes in the frequency response of the window function. Smoothing the PSD does not eliminate all false peaks without disturbing the true peaks. So after peak detection peaks smaller than a predefined threshold are excluded. It can not be guaranteed that a true peak is not suppressed by this procedure. But small peaks indicate small interference, so the interference does not affect the ECG signal. Peaks, which can be assigned to any harmonic, are kept. If 50 and 60 Hz harmonics are detected within one record, their strength measures are compared. A simple sum formula of strength measures for 50 Hz harmonics and 60 Hz harmonics respectively makes the decision.
3.
Results
3.1.
Sensitivity to artificial PLI
In general a PLI can be described as a Cosine or Sine function 𝑒𝑃 𝐿𝐼 = 𝐴 cos(2𝜋ℎ𝑛 ) with 𝐴 the amplitude of the PLI and ℎ𝑛 the frequency of the harmonic interference (50, 60, 100, 120, etc). The analysis of the strength measure is performed on a logarithmic scale of the PSD. So with linear increasing amplitude factor of the PLI the obtained strength measure will be monotonic increasing as well, but with a more logarithmic behavior. Interferences with a strength measure smaller than
(b)180Hz PLI for ten test signals
(c)50Hz PLI for one test signals at different sampling frequencies
Figure 1. Logarithmic behavior of the strength measure
the defined threshold are not considered. So it is important to know, when the amplitude of the PLI causes an interference strength measure bigger than this threshold. The minimal detectable amplitude is depending on the samplingfrequency, the signal length and most of all on the shape of the ECG part in the PSD. Especially the signal to noise ratio influences the capability of the detection algorithm. For a threshold equal to 1.2 10 test ECG signals with no PLI are disturbed with artificial PLI of different amplitudes 𝐴 and frequencies ℎ𝑛 . The sampling frequency of all records is 500 Hz and 5000 samples where used for the analysis.
(a)test signal
(a)test signal
(b)PSD
(b)PSD
Figure 2. Detected 50Hz PLI with a strength measure of 2.56 .
Figure 3. Detected 60 and 180 Hz PLI with strength measures of 2.61 and 4.99 .
As shown in figure 1(a) it can be assumed that a 50 Hz interference with amplitude of 10𝜇V can be detected in most cases. The same statement holds for 60 Hz. For harmonics with 𝑘 > 1 lower interferences can be detected, because the ratio of ECG part in PSD and PLI part in PSD is less. The value in higher frequencies is more depending on the PLI than on the ECG, see figure 1(b). The influence of the sampling frequency is observed with up-and down sampled versions of the data. The logarithmic behavior is the same. Only the strength measure differs by a small amount, especially in the case of 360Hz see figure 1(c).
against possible PLI depending on the country specific power line.
3.2.
Randomly chosen ECG files were inspected manually to affirm the automated detection algorithm. Two examples are shown in figure 2 and figure 3.
Examination with clinical test data
The proposed algorithm was tested with over 12000 ECG signals of a clinical study with 10sec duration and 500 Hz sampling frequency. The maximal detectable harmonic is bordered to 150 Hz or 180 Hz respectively. The ECG data was saved in Annotated ECG (aECG) HL7 format. In this format a trial site identifier, specifying where the ECG was acquired, is available. Every trial site can be assigned to a country uniquely and therefore to a country specific power line. The information, whenever a PLI in a specific record is present or not, was not available. But if the algorithm detects a PLI this value can be checked
Table 1. Detected power line interferences. 50 Hz 60 Hz country country Detected 50 Hz PLI 3235 13 Detected 60 Hz PLI 0 3112 Neutral recordsa 2558 3093 Total 5793 6207 𝑎 no
4.
PLI is detected
Conclusion
For the test data no reference information about the presence of interferences was present. Only a plausibility test against the possibility of the detected PLI was accomplished. In further research the algorithm has to be tested with data, which provides reference information about power-line interferences. In addition the usability of this PLI detection algorithm for effective filtering needs to
be examined. Nevertheless the results for this easy to use and fast method are very promising. In table 1 for only 13 records a 60 Hz PLI was detected wrongly, so the total false positive rate is 0.1%.
References [1] Hu Y, Lin Y. Detection and Suppression of Power-Line Interference in Electrocardiogram Signals . Computers in Cardiology 2007;34:549–552. [2] Levkov C, Mihov G, Ivanov R, Daskalov I, Christov I, Dotsinsky I. Removal of power-line interference from the ECG: a review of the subtraction procedure. BioMedical Engineering OnLine 2005;4:50. [3] Bazhyna A, Christov I, Gotchev A, Daskalov I, Egiazarian K. Powerline Interference Suppression in High-Resolution ECG. Computers in Cardiology 2003;30:561–564.
Address for correspondence: Constanza Lehmann Biosigna GmbH Lindwurmstr. 109 / D-80337 Muenchen / Germany tel./fax: ++49-89-2371-9277/9278
[email protected]