Determining Overhead, Variance & Isolation. Metrics in Virtualization for IaaS Cloud. Bukhary Ikhwan Ismail, Devendran Jagadisan, Mohammad Fairus Khalid.
Determining Overhead, Variance & Isolation Metrics in Virtualization for IaaS Cloud Bukhary Ikhwan Ismail, Devendran Jagadisan, Mohammad Fairus Khalid MIMOS Berhad, Malaysia {Ikhwan.ismail, deven.jagadisan, fairus.khalid}@mimos.my
Abstract Infrastructure as a Service cloud provides an open avenue for consumer to easily own computing and storage infrastructure. User can invent new services and have it deploy in a fraction of a time. As services being consumed, user expect consistent performance of their virtual machines. To host an IaaS, virtualization performance and behaviour need to be understood first. In this paper we present virtualization benchmarking methods, results and analysis in various resource utilization scenarios. The scenarios are Performance Overhead; the cost of virtualization compared to physical, Performance Variance; the VM instance performance when more VM is instantiate and Performance Fairness or Isolation; the study of fairness on each of the guest instances under stress environment. These studies provides us the fundamental understanding of virtualization technology.
1. Introduction “Infrastructure as a service” (IaaS) is a commodity base resource based on pool of physical servers. The underlying infrastructures consist of hardware i.e. servers, storage & network switches of heterogeneous nature. On top of these, software stacks such as hypervisors, operating system and hardware drivers play important role in the assembling of IaaS. Any changes on the technology stack will affect the performance of the Virtual Machines or guest instances. In order to control and manage the service effectively, we need to understand the performance or problem of each technology stack. In this paper, we present benchmarking methods, tools and results based on our first initial infrastructure setup. KVM will be use as our deployment hypervisor. Benchmarking includes in the areas of performance overhead, variance, isolation or fairness and overhead of guest OS. To direct our findings, we create test case based on the needs of IaaS designer and application developers who interest in the performance. By understanding virtualization behaviour, it can guide us on design decision for cloud deployment infrastructure. Section 2 describes brief review of virtualization technology. Section 3 explains our test strategies, metrics, methodologies and rationale behind each metrics. Section 4 discusses on tools and setup. Section 5 and 6 shows results & discussion. Lastly, we present our summary.
2. Virtualization Virtualization is the main ingredient blocks for cloud computing. Virtualization is a process of hiding the underlying physical hardware and makes it transparently usable and shareable by multiple VM. 2.1 KVM One of the most important innovations on Linux is the transformation into a Hypervisor. KVM, Lguest, UML, IBM Zvm, are some of the examples of Linux based hypervisor. They provide isolated virtual hardware platform for execution that in turn provide the illusion of the full access to the guest OS. Updates or optimization on Linux components will benefit both the host and the guest OS.
2
KVM, turn Linux OS into hypervisor by loading KVM modules into the kernel. Every KVM process is treated as normal Linux process. Linux consist of Kernel & User Mode. KVM add third mode called Guest Mode. In Guest Mode, reside guest own Kernel & User mode. KVM consist of 1) device driver for managing the virtual hardware and 2) user space component for emulating PC hardware. Linux kernel handles this very efficiently. Compared to non-kernel based hypervisor, other hypervisor put great effort on their scheduler and memory management system. (Jones, 2009) 2.2 Memory Memory is virtualizes through KVM. It provides virtualization of memory through /dev/kvm device. This involves sharing the physical RAM with dynamically allocating it to VM. VM memory is very similar to the virtual memory used in modern OS. Applications see it as a contiguous address space that is tied to the underlying RAM in the host. The OS keeps the mappings of virtual page numbers to physical page numbers stored in page tables (VMWare Inc 2007) Each guest operating system has its own address space that is mapped when the guest is instantiate. A set of shadow page table are maintained, to support the translation from VM physical address to host physical address. (Jones, 2007) 2.3 I/0 Operation I/O operation for VM operating system is provided by QEMU. QEMU is a platform virtualization solution that allows virtualization of an entire PC environment (including disks, graphic adapters, and network devices). Any I/O requests a VM OS makes are intercepted and routed to the user mode and emulated by the QEMU process.
3. Benchmarking 3.1 Testing Methodologies Experiments are designed to evaluate, Virtualization Overhead, Variance and Isolation of resource elements. from these 3 metrics, we will measure the CPU, memory, storage and application behaviour (database and Java). Results obtain from this studies, will act as initial result for further studies. Next, we justify the chosen metrics. Overhead - is the performance differences of the guest VM versus the actual bare metal host. From this metric, it will give us the insight of all resource elements and support the explanation of variance, isolation and fairness properties. Variance - In virtualization environment, resources are shared among guest OS. By incrementally increase the amount of guest OS within single host, we can discover the performance effects Isolation or fairness is the act of securing and providing the resources to VM in isolated container where other VM may co-exist in the same host. Ideally, all the host resources must be shared equally. It is the desirable metrics in this environment in order to guarantee SLA. For example, if one VM starts
3
misbehaving, i.e. consuming up all its own memory, other VMs are not affected and should continue to run normally. Here we test by simultaneous running resource intensive application to see the effects of non-isolation behaviour for VM guest server. Another area of isolation studies is security. For example, for any reason, an attacker attacks a VM or part of it and the VM is well isolated, it will not jeopardise other VM.(Why Virtualization 2009). For this point, we will not test it. Isolation metric is among discussed topics in virtualization studies. (Che Jianhua 2008)(Gaurav Somani 2009)(IBM June 23-24, 2008) Application Specific Behaviour - VM guest overhead, variance and isolation shows the perspective of micro-level resource utilization and behaviour. Server applications consume all resources and produce macro level results. Here we test SQLLite and Java to benchmark our guest OS. 3.2 Setup Below, are the testbed configuration and VM setting. Processor
4 Cores Intel Xeon CPU E5405 @ 1.99GHz
Mainboard
DellPrecision WorkStation T5400
Chipset
Intel 5400 Chipset Hub
Memory
2 x 4096 MB 667MHz
Disk
750GBHitachi HDS72107
Graphics
nVidia Quadro FX 1700,
OS
CentOS 5.3 64bit
Kernel
Kernel:2.6.18-128.4.1.el5 (x86_64)
File System
EXT3
Table 1: Host System Specification Processor
QEMU Virtual CPU 0.9.1 @ 7.97GHz (Total Cores: 1)
Mainboard
Unknown
Chipset
Unknown
Memory
512MB
Disk
12GB GEMU Hard disk
Graphics
Nil
OS
Fedora release 10 (Cambridge) (Eucalyptus Image)
Kernel
Kernel: 2.6.28-11-generic (x86_64)
File System
ext3
Table 2: Guest VM Specification 3.3 Testbed Setup
4
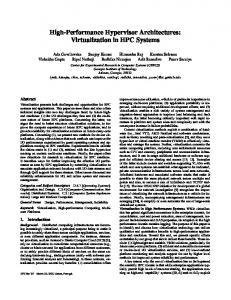
Figure 1: Testbed Setup Test environment use CentOS 5.3 as the based operating system due to stability and reliability of the OS. The following libraries are used KVM 85 KMOD-KVM -2.6.3.0.1 Libvirt-0.6.5 QEMU-KVM 10.6.0 KVM 85 and KMOD-KVM-2.6.3.0.1 installed using yum repositories while libvirt 0.6.5 compiled from the source. The libvirt and qemu-kvm libraries are complied with the default parameters. The virtual machines will be running on the local disk of the physical machine. In our benchmark, the base image for the virtual machines are in “raw” format. 4.
Tools & Methodology
For each of the performance testing, we perform 10 round per metrics and tak the average. Each of test tools have input parameter which siginficantly affect the outcoming results. Careful consideration of each parameter Here we list all the tools used in our benchmark test.
5.
CPU a. 7ZIP-Compression - http://www.7-zip.org/ Memory a. RAMspeed - http://alasir.com/software/ramspeed Storage a. Iozone - www.iozone.org b. Tiobench - http://tiobench.sourceforge.net/ Application a. Java-SciMark 2.0 - http://math.nist.gov/scimark2/ b. Database - SQLite - http://www.sqlite.org/ Network a. Netperf - http://netperf.org
Results
5.1 Overhead Here we present the overhead results. We present first the overhead occured for each server element and lastly we present application specific overhead. For the
5
guest VM, we use the exact configuration number of memory, CPU cores etc of physical host. This will show any performance degradtion of host versus virtual machine.
10000
6139
6077
MIPS
Host Guest
0
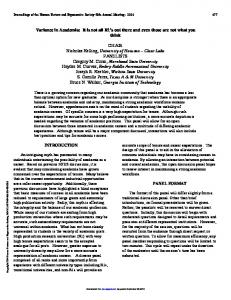
Figure 2: CPU Host vs. Guest CPU on guest machine is near to host-native performance with 1% overhead as shown in Figure 2. MB/s
3000
2579
2282
2367
2323
2366
2328
2000
Host
1000
Guest
0 int Add
int Copy
int Scale
Figure 3: Memory Host vs. Guest We benchmark memory using RAMSpeed with 3 subtests. Memory shows low overhead as shown in Figure 3.
MB/s
2000
1296
1000
179
host
355
96
0
guest 4GB Write
4GB Read
Figure 4: IOZone Disk Host vs. Guest Figure 4 shows read performance suffers more compared to write. Read performance drop 72% while write drop to 46%. KVM I/O handling for disk adds significant performance penalty as compared to memory and CPU, which performs better.
Mbps
1,000 500
941
852
232
405 157
257
between hosts
between guest in single host
between guests across node
TCP_STREAM UDP_STREAM
Figure 5: Network Bulk Data Transfer Performance Network throughput and latency test using netperf have different approach compared to other test. We measure the performance of throughput and latencies, between physical hosts, guests within the same host and between guests across physical host. These test reflects the actual performance differences of virtualization.
6
In bulk data transfer test (TCP_STREAM & UDP_STREAM), 4 common attribute may affect the performance indirectly. 1) Network-bound where speed is affected by the slowest link on the network, 2) CPU-bound The CPU utilization at the time of test where networking stack requires CPU cycle per KB of data transfer. 3) Distance of data needs to travel and 4) Packet Lost (Care and Feeding of Netperf 2.4.X, 2007) Figure 5, shows the result of bulk data transfer performance. TCP overhead on VM guest compared to host machine dropped to 75% while UDP suffers 55% drop. Virtualization adds significant overhead over throughput results. While UDP seems to be better than TCP in virtualizes environment, the result is inconclusive. One plausible explanation could be TCP protocol is more expensive in terms of resource utilization it consumed as compared to UDP. TCP is, reliable, connectionoriented, sequenced, and requires acknowledgement on both sender and the receiver (Ghori Asghar 2007). On Virtual environment, these might amplify the usage where each of the entity, VM & host competes for the resources. In a test done on Amazon EC2 infrastructure, the results of TCP & UDP are fluctuating in selected cases. EC2 categories its guest VM type by small, medium or large instances. In “small” type VM, the network performance of UDP is better than TCP while in “medium” type VM, TCP are better. It concludes that in small type VM, the guest machines are prone to processor sharing and the throughput drop is cause by this event. Nevertheless, network virtualization requires high degree of resource sharing and CPU processing, (Guohui Wang, 2010). Apart from the common attribute discussed earlier, hypervisor adds another layer of processing in order to emulate or virtualizes the network. To virtualizes network, the outgoing network must be multiplexed together before sending out to the network and incoming be de-multiplexed before sending to designated VM guest. Second, VMM must protect the VMs from each other where VM cannot read or write to other network interfaces. (Scott Rixner, 2008) To enable resource sharing and enforce security it is at expense of performance drop and increases the complexity in managing network QoS.
20,000 Between hosts
TPS
10,623 10,000
3,692
between guests in single host 2,866
between guests across node
-
Figure 6: Network Latency Figure 6 shows the latency results. The measurement is in transaction perseconds. The higher the value reflects lower latency or greater speed. Virtualization adds 65% performance overhead. Link between instances on different nodes add further latency, which drop 22% more. Latency is typically incurred in processing of network data. Latency can be temporary which last for a few seconds or persistent which depends on the source of the delays.
7
9.47
150 Host
5
Guest
Time Seconds
9.37
Rendering time
10
111.94 100.43
100
Host
50
Guest
0
0
Figure 7: Java Host vs. Guest
Figure 8: SQLite Host vs. Guest
Figure 7, the performance overhead on guest is small with only 1.07% lower than physical. Figure 8 shows 11.46% SQLite performance drop for guest OS. 5.2 Variance & Isolation Here we present the results of stressing out the physical hosts with compute, memory, read/write I/O of disk and the effects of network throughput. 5.2.1
CPU 1792
MIPS
2000
1720
1373
1 guest
1000
2 guest 4 guest
0
Figure 9: CPU Variance Chart Figure 9, we can see performance degradation by incrementally more VM in a single node. From the chart above, we can see the variance when more guests present. Performance varies between 1792 to 1373 MIPS or 20%. 1396 1370 1394 1334
MIPS
1500
1st guest
1000
2nd guest
500
3rd guest 4th guest
0
Figure 10: CPU Fairness Chart Figure 10, we would like to give insight of the performance on each of the 4 guests. Each of the guests have +/- 4% differences between each other. These results shows that, concurrent stressing the CPU, does not affect guests OS with significantly. We allocate each host CPU core to a single guest, thus no overselling test were conducted. 10000 MIPS
6077 5000
5494 Guest total 4 guest
0
Figure 11: 1 Guest with 4 CPU vs. 4 Guest with 1 CPU each
8
Figure 11, we try to present CPU consumption in a different view. We try to display the total MIPS of 4 guests with 1 core compared to 1 guest running all 4 cores. The reason of such analysis is to show how much compute power is wasted due to divisioning of the CPU cores to each guest. If we divide the 4 cores one each to the guests, the allocation of each guest will get average of 1373 MIPS or 22%. By allocating each CPU to a guest OS, a total of 9.6% lost of compute power as compared to assigning all cores to a single guest. 5.2.2
Memory
Host machine consist of 2 DIMMs of 4GB RAM and each guest have 512MB RAM. At the peak of the stress test, only 2GB RAM is utilize or 25% of actual RAM is utilize. Still the performance variance being affected greatly. 3000 MB/s
2125
2122
2081 2000
1186
1169
618
611
1000
1 Guest
1164 601
2 Guests 4 Guests
0 int Add
int Copy
int Scale
Figure 12: RAMSpeed Memory Variance Chart Figure 12, shows memory stress test. An average of 43% decreases in memory performance while running 2 guests. It suffers more with 70% performance drop while running 4 guest. Performance degradation occurs when more guest VM running on single machine. Performance varies between guest with value of 2081 – 611 Mb/s or 70%. KVM does not manage the memory assigned to the VM. In the physical machine, libvirt API is used to create the VM and a user spaces emulator called qemu-kvm to provision the VM. The libvirt will initiate the VMs with the requested hardware such as number of CPU, memory size, disk etc. Qemu-kvm will prepare the VMs address space and I/O between the guest and the physical host. Each VM will run as separate qemu-kvm process with the memory size stated up front by libivirt. Therefore, the more VM launched in a physical host machine, the higher performance degradation we will notice.
MB/s
650 600 608
621
613
608 607
633 625
600
619 613 592
578
instance 1 instance 2 instance 3
550 int Add
int Copy
int Scale
instance 4
Figure 13: RAMSpeed Memory Fairness Chart Figure 13,shows good performance isolation of memory +/- 5% differences between guest. It shows good isolation or fairness of each VM even the variance differences is high. 5.2.3
Disk
9
For disk, we only perform maximum of 2 guest up concurrently. With 4 guest test, the guest OS will hang or become unresponsive due to the nature of the test. 355
MB/s
400 200
1 Guest
96
47
8
2 Guest
0 4GB Write
4GB Read
Figure 14: IOZone Disk Variance Chart Testing for performance variance on disk further worsen the case by comparing 1 guest with 2 guest as shown in Figure 14: IOZone Disk Variance ChartError! Reference source not found.. For Iozone read test, the performance drop for 2 guests is 97% while write test suffers 52%.
MB/s
100 50
47.18
50.96
1st Guest 9.03
8.49
2nd Guest
0 4GB Write
4GB Read
Figure 15: IOZone Disk Fairness Chart
Microseconds (Hundreds)
In Figure 15 both guest OS suffers almost the same degradtion. Even thou the performance drop caused by the total number of guest OS is significantly high, the perfromance of both guest OS’s is almost divided equally show on IOZone test. 200 100
131 17
23
3
39
23
31
1 Guest
52
2 Guest
0 64MB Write
64MB Read
256MB Write 256MB Read
Figure 16: Tiobench Disk Variance Chart Tiobench perform more rigrous test compared to IOZone. Figure 16 shows the graph of performance variance, while Table 3 shows the percentage drop of such variance. Variance
Test
Fairness
WRITE 64
35%
WRITE 64
+/- 87%
WRITE 256
34%
WRITE 256
+/- 69%
READ 64
1200%
READ 64
+/- 2400%
150%
READ 256
+/- 236%
Test
READ 256
Table 3:Performance Variance
Table 4:Performance Fairness
Microseconds (Hundreds)
10 400 202 200 30
76
16
3
39
1st Guest 60
23
2nd Guest
0 64MB Write
64MB Read
256MB Write
256MB Read
Figure 17: Tiobench Disk Fairness Chart Performance isolation test for tiobench as reflected on Figure 17 and Table 4 Multithread read/write shows bad distribution resource handling. With this results, it shows one guest have higher I/O compared to another. In tiobench, multiple I/O request is done with a total of 64 threads running at one time. This test shows more rigrous test as compared to iozone.From iozone and tiobench test, read variance is much more worst compared to write operation. 5.2.4
Application
Rendering time
60 36.95 38.35
40
45.03 1 Guest 2 Guests
20
4 Guests
0
Figure 18: Java Test Figure 18 shows the results of Sunflow rendering on guests running concurrently. It shows 3.79% degradation when compared with 1 guest compared to 2 guest running. Another 20% drop when 4 guests running. Application benchmarking for Java does not reflect the performance drop as shown in CPU, memory and disk benchmarking. This test is analogous to CPU performance where the trend of performance drop is quite similar.
Time to complete
150 114
121
136 1 Guest
100
2 Guests 50
4 Guests
0
Figure 19: SQLite Test Figure 19 show the result of SQLite test to finish 125,000-query request. It shows performance variance of 21%. For performance isolation on SQLite it shows +/23%. For Java, the isolation value is 20% .
6. Discussion ELEMENTS CPU
OVERHEAD
VARIANCE
1% GOOD 20%
GOOD
FAIRNESS 4%
GOOD
11 MEMORY
5% GOOD 70%
BAD
5%
iozone Write
46%
FAIR
46%
FAIR
17% GOOD
Iozone Read
72%
BAD
98%
BAD
5%
GOOD
TiobenchWrite 1087% V.BAD 35%
FAIR
87%
BAD
TiobenchRead
GOOD
657% V.BAD 1200% V.BAD 2400% V.BAD
JAVA
1% GOOD 21%
GOOD
20% GOOD
SQL
11% GOOD 26%
GOOD
23% GOOD
Good 0-30%, Fair 31-50%, Bad 50-100% Table 3: Overall Results Table 3 shows the summary of overhead, variance and fairness of the server elements. CPU score good for all metrics. Memory on the other hand, shows bad variance. For disk Iozone test, both read/write shows good distribution of fairness between competing guests. For tiobench it gives much more regression test as compared to Iozone. All three performances metrics show bad results. In virtualization, the biggest complaint is sluggish disk I/O. VM disk will never perform like physical disk. In full virtualization, I/O channel specifically disk, will significantly degrades overall performance. To improve disk I/O, it is advisable to get high-performance disk, while waiting for the full virtualization maturing. For example, SCSI drive still outperforms even the highest-end IDE drives. Consideration on widest transfer rate, highest cache drives which IaaS provider could afford. Because of disk I/O overhead, High CPU core number or high memory will not be fully utilize. (Kenneth Hess 2009) The performance shown in our test shows the worst case of each of the server elements couple together. Even memory shows bad variance and disk shows tremendous overhead, bad variance and no proper isolation, it still does not reflect on the SQLite and Java tests. The application test cases is also showing worst-case scenarios where each of the application servers being used fully on one node. For network, we can see that UDP throughput is much better than TCP but we could not justify of such characteristic. There are suggestions to improve the network I/O throughput. For example, a dedicated NIC to VM might be advice able where highly network traffic dependent such as web server, application or terminal server. (Kenneth Hess 2009) VMM introduce additional overhead on guest VM as compared to native due to either device emulation or types of virtualization (i.e. para-virtualization or fullvirtualization). Another factor could be attributed to domain scheduling within VMM, which schedule the shared I/O devices. For example, even a single virtual machine is running on a single host, the sending or receiving network packets involves two domains; the driver and the guest. These domain must be scheduled and poor scheduling can result in increase of network latency. (Scott Rixner, 2008) Further improvement on the virtual machine can be achieved from using Virtio (libvirt: Wiki : Virtio n.d.) devices. The Virtio drivers are optimized for KVM are provides performance for disk and network of theVM.
12
Choosing the right OS I/O scheduler for the host machine and virtual machine might improve the virtual machines performances. (David Bouthcer n.d.) have suggested the NOOP scheduler improves the throughput of the virtual machines From our studies, we have found several performance issues on the server elements. We know more dynamic deployment policy for cloud is needed in order to allocate guest resources more efficiently.
7. Reference 1. 2.
3. 4.
5. 6. 7. 8. 9.
10. 11. 12.
13. 14. 15. 16.
17.
CentOS - Community Enterprise OS. 4 November 2009. http://www.centos.org/ (accessed November 18, 2009). Che Jianhua, He Qinming, Qinghua Goa, Dawei Huang. “Performance Measuring and Comparing of Virtual Machine Monitors.” IEEE/IFIP International Conference on Embedded & Ubiquitous Computing. IEEE Computer Society, 2008. 381. David Bouthcer, Abhishek Chandra. “Does Virtualization Make Disk Scheduling Passé?” Workshop on Hot Topics in Storage and File Systems (HotStorage’09). Montana. Eucalyptus Networking_v1.5.2 - Eucalyptus. http://open.eucalyptus.com/wiki/EucalyptusNetworking_v1.5.2#novlan (accessed August 15, 2009). Gaurav Somani, Sanjay Chaudhary. “Application Performance Isolation in Virtualization.” IEEE International Conference on Cloud Computing, 2009: 41-48. Hollander, Rhett M. RAMSpeed a cache and memory benchmark. November 2002. http://www.alasir.com/software/ramspeed/. IBM. “Quantitative Comparison of Xen and KVM.” 2008 Xen Summit. Boston, June 23-24, 2008. Java SciMark 2.0. 31 3 2004 . http://math.nist.gov/scimark2/ (accessed 9 10, 2009). Jones, M. Tim. “Discover the Linux Kernel Virtual Machine-Learn the KVM architecture and advantages.” IBM Developerworks. 18 April 2007. http://www.ibm.com/developerworks/linux/library/l-linux-kvm/ (accessed October 25, 2009). Kenneth Hess, Amy Newman. Practical Virtualization Solutions. Pearson, 2009. QEMU disk image utility - Linux man page. http://linux.die.net/man/1/qemu-img (accessed November 19, 2009). Qiang Li, Qinfen Hao, Limin Xiao, Zhoujun Li. “VM-based Architecture for Network Monitoring and Analysis.” The 9th International Conference for Young Computer Scientists. IEEE Computer Society, 2008. 1395. tiobench benchmark. 2 october 2002. http://linuxperf.sourceforge.net/tiobench/tiobench.php. VMWare Inc. Understanding Full Virtualization, Paravirtualization, and Hardware Assist. Palo Alto: VMWare Inc, 2007. vmware. Technical Note-Networking Performance in Multiple Virtual Machine. VMware Inc., 2007. West, John E. HPCWIre:-Benchmarking Your Cloud. 16 7 2009. http://www.hpcwire.com/features/Benchmarking-Your-Cloud-50976307.html (accessed 7 16, 2009). Why Virtualization. 08 04 2009. http://virt.kernelnewbies.org/WhyVirtualization (accessed
11 18, 2009). 18. Hewlet Packard. (2007). Care and Feeding of Netperf 2.4.X. (Hewlet Packard) Retrieved from netperf: www.netperf.org 19. Scott Rixner. “Network Virtualization Breaking the Performance Barrier” ACM Queue, January/Febuary 2008 edition. 20. Guohui Wang, T. S. Eugene Ng, "The Impact of Virtualization on Network Performance of Amazon EC2 Data Center", in IEEE INFOCOM'10, San Diego, CA, March 2010 21. Ghori. Asghar. Precio. HP Certified Systems Administrator 2nd Edition), 2007 Endeavor Technologies United States
13