Jul 26, 2016 - The Health Effects Institute is a nonprofit corporation chartered in 1980 as an independent research organization to ..... such as automobile traffic. A short ...... Richard F. Celeste, Chair President, Colorado College. Sherwood ...
R e s e a r c h R e p o rt HEA LTH
HEA LTH
IN STITUTE
IN STITUTE
EF F E CTS
EF F E CTS
101 Federal Street, Suite 500 Boston, MA 02110, USA +1-617-488-2300 www.healtheffects.org
Research R e p o r t Number 149 May 2010
Number 149 May 2010
Development and Application of a Sensitive Method to Determine Concentrations of Acrolein and Other Carbonyls in Ambient Air Thomas M. Cahill, M. Judith Charles, and Vincent Y. Seaman
Development and Application of a Sensitive Method to Determine Concentrations of Acrolein and Other Carbonyls in Ambient Air Thomas M. Cahill, M. Judith Charles, and Vincent Y. Seaman
with a Critique by the HEI Health Review Committee
Research Report 149 Health Effects Institute Boston, Massachusetts
Trusted Science
· Cleaner Air · Better Health
Publishing history: The Web version of this document was posted at www.healtheffects.org in May 2010. Citation for document: Cahill TM, Charles MJ, Seaman VY. 2010. Development and Application of a Sensitive Method to Determine Concentrations of Acrolein and Other Carbonyls in Ambient Air. HEI Research Report 149. Health Effects Institute, Boston, MA.
© 2010 Health Effects Institute, Boston, Mass., U.S.A. Cameographics, Belfast, Me., Compositor. Printed by Recycled Paper Printing, Boston, Mass. Library of Congress Number for the HEI Report Series: WA 754 R432. Cover paper: made with at least 55% recycled content, of which at least 30% is post-consumer waste; free of acid and elemental chlorine. Text paper: made with 100% post-consumer waste recycled content; acid free; no chlorine used in processing. The book is printed with soy-based inks and is of permanent archival quality.
CONTENTS About HEI About This Report
v vii
HEI STATEMENT
1
INVESTIGATORS’ REPORT by Cahill et al.
3
ABSTRACT
3
INTRODUCTION
4
SPECIFIC AIMS
5
METHODS AND STUDY DESIGN
6
Mist Chamber Methodology Carbonyl-Bisulfite Adduct Formation Preparation of the 0.1 M Bisulfite Solution Selection of the Derivatization Agent Instrumental Analysis and Mass Spectral Characterization Derivatization Optimization Extraction Optimization Selection of Internal Standards Selection of Injection Standards Mist Chamber Collection Efficiency Optimization Evaluation of a Wide Range of Carbonyls Evaluation of Possible Interference from Ozone Field Sampling RESULTS Optimization of the Analytical Technique Collection Efficiency and Spike Recovery Possible Interference from Ozone Field Sampling DISCUSSION AND CONCLUSIONS Method Development Peace Bridge Sampling in Buffalo Ambient Sampling in California Directions for Future Research Epilogue
6 7 9 10 10 12 15 17 18 18 19 21 22 25 25 27 29 30 34 34 35 36 37 38
IMPLICATIONS OF FINDINGS
38
ACKNOWLEDGMENTS
39
REFERENCES
39
Research Report 149 APPENDIX A. Standard Operating Procedures for Carbonyl Collection and Analysis
42
APPENDIX B. Clayton Group Services Laboratory Report for the Analysis of Acrolein from HMP-Coated Cartridges
44
ABOUT THE AUTHORS
45
OTHER PUBLICATIONS RESULTING FROM THIS RESEARCH
45
ABBREVIATIONS AND OTHER TERMS
45
CRITIQUE
47
by the Health Review Committee
INTRODUCTION
47
SCIENTIFIC BACKGROUND
47
Chemistry Exposure and Health Effects Current Techniques for Measuring Acrolein
47 48 48
STUDY DESIGN AND SPECIFIC AIMS
49
METHODS AND RESULTS
49
Development and Optimization of Mist Chamber Methodology Evaluation of Mist Chamber Collection Efficiency, Recovery, and Retention Field Testing HEI REVIEW COMMITTEE EVALUATION Method Development Field Studies Conclusions
49 51 52 52 52 53 54
REFERENCES
54
ACKNOWLEDGMENTS
55
Related HEI Publications
57
HEI Board, Committees, and Staff
59
ABOUT HEI The Health Effects Institute is a nonprofit corporation chartered in 1980 as an independent research organization to provide high-quality, impartial, and relevant science on the effects of air pollution on health. To accomplish its mission, the institute •
Identifies the highest-priority areas for health effects research;
•
Competitively funds and oversees research projects;
•
Provides intensive independent review of HEI-supported studies and related research;
•
Integrates HEI’s research results with those of other institutions into broader evaluations; and
•
Communicates the results of HEI research and analyses to public and private decision makers.
HEI receives half of its core funds from the U.S. Environmental Protection Agency and half from the worldwide motor vehicle industry. Frequently, other public and private organizations in the United States and around the world also support major projects or certain research programs. HEI has funded more than 280 research projects in North America, Europe, Asia, and Latin America, the results of which have informed decisions regarding carbon monoxide, air toxics, nitrogen oxides, diesel exhaust, ozone, particulate matter, and other pollutants. These results have appeared in the peer-reviewed literature and in more than 200 comprehensive reports published by HEI. HEI’s independent Board of Directors consists of leaders in science and policy who are committed to fostering the public–private partnership that is central to the organization. The Health Research Committee solicits input from HEI sponsors and other stakeholders and works with scientific staff to develop a Five-Year Strategic Plan, select research projects for funding, and oversee their conduct. The Health Review Committee, which has no role in selecting or overseeing studies, works with staff to evaluate and interpret the results of funded studies and related research. All project results and accompanying comments by the Health Review Committee are widely disseminated through HEI’s Web site (www.healtheffects.org), printed reports, newsletters and other publications, annual conferences, and presentations to legislative bodies and public agencies.
v
ABOUT THIS REPORT Research Report 149, Development and Application of a Sensitive Method to Determine Concentrations of Acrolein and Other Carbonyls in Ambient Air, presents a research project funded by the Health Effects Institute and conducted by Dr. Thomas M. Cahill of the Department of Integrated Natural Sciences, Arizona State University, Phoenix, and his colleagues. This report contains three main sections. The HEI Statement, prepared by staff at HEI, is a brief, nontechnical summary of the study and its findings; it also briefly describes the Health Review Committee’s comments on the study. The Investigators’ Report, prepared by Cahill et al., describes the scientific background, aims, methods, results, and conclusions of the study. The Critique is prepared by members of the Health Review Committee with the assistance of HEI staff; it places the study in a broader scientific context, points out its strengths and limitations, and discusses remaining uncertainties and implications of the study’s findings for public health and future research. This report has gone through HEI’s rigorous review process. When an HEI-funded study is completed, the investigators submit a draft final report presenting the background and results of the study. This draft report is first examined by outside technical reviewers and a biostatistician. The report and the reviewers’ comments are then evaluated by members of the Health Review Committee, an independent panel of distinguished scientists who have no involvement in selecting or overseeing HEI studies. During the review process, the investigators have an opportunity to exchange comments with the Review Committee and, as necessary, to revise their report. The Critique reflects the information provided in the final version of the report.
vii
H E I S TAT E M E N T Synopsis of Research Repor t 149
Development and Application of a Sensitive Method for Determination of Acrolein Concentrations in Ambient Air BACKGROUND Acrolein is a reactive aldehyde that injures the airways in humans and other species, and the U.S. Environmental Protection Agency lists it among the mobile-source air toxics that pose the greatest health risk. Information on the acrolein concentrations to which people are exposed is an important prerequisite for assessing the risk to human health. Despite some technological improvements, it remains difficult to accurately measure acrolein at low levels because, upon collection, it rapidly forms unstable intermediates that are difficult to differentiate and quantify. In 2001 Dr. Judith Charles of the University of California–Davis responded to HEI Request for Preliminary Applications 00-3 with a proposal to develop a new method for measuring low levels of acrolein, crotonaldehyde, and other unstable aldehydes and apply the new method to assess exposure of tollbooth attendants in the San Francisco Bay area. The Research Committee believed that the method proposed by Charles and colleagues might be useful to accurately measure low levels of acrolein and recommended the study for 2 years of funding with a focus on the development of the sampling and analytic method to determine whether the proposed approach would be successful. During the middle of the second year, Dr. Charles became ill, and Dr. Thomas Cahill replaced her as the principal investigator and completed the study. APPROACH The investigators proposed to evaluate a sampling method that relies on the collection of acrolein in an aqueous medium containing sodium
bisulfite, with which it forms a stable chemical reaction product. The overall aim of the study was to develop and optimize a method for the collection and analysis of acrolein and to evaluate the performance of the method by three different measures. One measure was collection efficiency, calculated as the concentration of acrolein in the first of two mist chambers in series relative to that in the second chamber, expressed as a percentage. The second measure was “spike recovery” (also defined as the mass balance), a measure of the overall carbonyl recovery, from collection to analysis. It was determined by adding a known carbonyl mass to a “spiking tube” placed upstream of the mist chamber and delivering it to the chamber by blowing pure nitrogen through the tube to simulate ambient collection conditions. Recovery was calculated as the percentage of the carbonyl mass in both chambers and remaining in the spiking tube relative to the mass added initially. The third measure was retention of deuterated acrolein-d 4 that had been added directly to the bisulfite solution as an internal standard before sampling, expressed as a percentage of the initial amount. The investigators also measured acrolein levels in two field studies and compared the results with those obtained by other sampling methods. RESULTS AND INTERPRETATION Methods Development and Evaluation T he sampler developed by Charles and Cahill, with Dr. Vincent Seaman, consists of a custom-built glass mist chamber in which air enters at a high flow rate and carbonyls are trapped in a solution of sodium bisulfite as carbonyl-bisulfite adducts. This reaction
This Statement, prepared by the Health Effects Institute, summarizes a research project funded by HEI and conducted by Dr. Thomas M. Cahill, Department of Integrated Natural Sciences, Arizona State University, Phoenix, Arizona, and colleagues. Research Report 149 contains both the detailed Investigators’ Report and a Critique of the study prepared by the Institute’s Health Review Committee.
1
Research Report 149 is rapid (on the order of seconds) for all the carbonyls tested, and its rate is dependent on the concentration of bisulfite. The optimal sampling time for acrolein and the other carbonyls is 10 to 30 minutes at a flow rate of approximately 20 L/min at 21�C, and the optimal setup is two mist chambers in series. Longer sampling times, lower flow rates, and different temperatures were not evaluated. After collection, hydrogen peroxide is added to free the carbonyl from the adduct, and a derivatizing agent is added to form a carbonyl derivative suitable for gas chromatography with mass spectrometry. The calculated minimum detection limit for acrolein varied between experiments and ranged from 0.012 µg/m3 (0.005 ppb) to 0.035 µg/m3 (0.015 ppb), values well below the detection limits of other existing methods. The collection efficiency of the mist chamber methodology was determined to be 80% in the laboratory and 71% in the field. Assuming that the collection efficiency is the same in the two chambers, it would be approximately 91% for the whole system in the field. This is only a relative measure of collection because it does not consider the initial amount of acrolein. Using the spike-recovery approach, the investigators found that 97% of the acrolein mass was recovered. For this test acrolein was dissolved in solvent and volatilized into a nitrogen stream. Although this approach was designed to simulate sampling in the field, it may not reflect entirely the actual conditions to which acrolein is exposed when sampled in ambient air. The test using the deuterated internal standard showed that, once the acrolein was trapped, 93% was retained throughout the analytic process. Because the deuterated species was dissolved in the bisulfite solution in the mist chamber, rather than bubbled into the solution in an air stream (as it would be under ambient sampling conditions), the measure of internal standard retention does not evaluate the efficiency with which the carbonyl in the ambient air stream is trapped in the mist chamber solution. Overall, the Review Committee—in its independent evaluation of the study—thought that these analyses were useful and showed a high level of acrolein recovery under laboratory conditions. However, the dynamic processes that lead to absorption of acrolein in the field may vary. Field Studies The first field study, conducted at the Peace Bridge in Buffalo, New York, was an opportunity to compare the mist chamber method
2
with two methods conventionally used to measure acrolein: the dansylhydrazine-based passive sampler and Occupational Safety and Health Administration Method 52. Comparison of the methods is difficult, however, because sampling times varied widely, with the mist chamber sampling for 10 minutes (sequential measurements were averaged over 12 hours) and the other two samplers sampling continuously for 12 to 24 hours. Nevertheless, the results showed that the mist chamber methodology can detect lower concentrations of acrolein than the other two devices. The second field study, conducted using multiple mist chamber systems in three locations in California, showed that the results of the method were reproducible and detected differences in concentrations at sites that had different carbonyl sources nearby. CONCLUSIONS The mist chamber methodology offers greater sensitivity for measuring acrolein than other existing methods. The analytic steps allow good separation of several carbonyls. The investigators evaluated c h a m b e r p e r f o r m a n c e using three different approaches; however, they did not discuss the expected relationships among them. The approach of measuring the total recovery of acrolein from collection to analysis yielded a value of 97%. Some limitations that might prevent the use of the method in population exposure studies are that the mist chamber has to be custom-built and is quite costly and that the method is labor-intensive, requiring a number of steps in the field. Development of more practical and less expensive approaches will be important if it is to be more widely used. The method performs optimally with very short sampling periods (10 minutes). The investigators provide a good rationale for having a sampler with a short sampling time to track shortterm changes in acrolein concentrations. The Review Committee thought that a sampler with a wider range of sampling times would be more useful for measuring variations in ambient levels and personal exposures, without the need to combine data from repeated measurements taken over very shorts periods. Despite its potential limitations, the Investigators’ Report shows that the mist chamber methodology can provide useful information when detailed temporal characterization of acrolein concentrations is needed.
INVESTIGATORS’ REPORT
Development and Application of a Sensitive Method to Determine Concentrations of Acrolein and Other Carbonyls in Ambient Air Thomas M. Cahill, M. Judith Charles (deceased), and Vincent Y. Seaman Department of Integrated Natural Sciences, Arizona State University at the West Campus, Phoenix (T.M.C.); Department of Environmental Toxicology, University of California–Davis (M.J.C.); and Health Investigations Branch, Division of Health Studies, Agency for Toxic Substances and Disease Registry, Centers for Disease Control and Prevention, Atlanta, Georgia (V.Y.S.)
ABSTRACT Acrolein, an unsaturated aldehyde, has been identified as one of the most important toxic air pollutants in recent assessments of ambient air quality. Current methods for determining acrolein concentrations, however, suffer from poor sensitivity, selectivity, and reproducibility. The collection and analysis of unsaturated carbonyls, and acrolein in particular, is complicated by unstable derivatives, coelution of similar compounds, and ozone interference. The primary objective of this research was to develop an analytical method to measure acrolein and other volatile carbonyls present in low part-per-trillion concentrations in ambient air samples obtained over short sampling periods. The method we devised uses a mist chamber in which carbonyls from air samples form water-soluble adducts with bisulfite in the chamber solution, effectively trapping the carbonyls in the solution. The mist chamber methodology proved effective, with collection efficiency for acrolein of at least 70% for each mist chamber at a flow rate of approximately 17 L/min. After the sample collection, the carbonyls are liberated from the bisulfite adducts through the addition of hydrogen peroxide, which converts the bisulfite to sulfate, reversing the bisulfite addition reaction. The free carbonyls are then derivatized by
This Investigators’ Report is one part of Health Effects Institute Research Report 149 which also includes a Critique by the Health Review Committee and an HEI Statement about the research project. Correspondence concerning the Investigators’ Report may be addressed to Dr. Thomas M. Cahill, Department of Integrated Natural Sciences, Arizona State University at the West Campus, P.O. Box 37100, Phoenix, AZ 85069. Although this document was produced with partial funding by the United States Environmental Protection Agency under Assistance Award CR– 83234701 to the Health Effects Institute, it has not been subjected to the Agency’s peer and administrative review and therefore may not necessarily reflect the views of the Agency, and no official endorsement by it should be inferred. The contents of this document also have not been reviewed by private party institutions, including those that support the Health Effects Institute; therefore, it may not reflect the views or policies of these parties, and no endorsement by them should be inferred.
Health Effects Institute Research Report 149 © 2010
o-(2,3,4,5,6-pentafluorobenzyl)hydroxylamine (PFBHA*), which stabilizes the analytes and makes them easier to detect by electron-capture negative ionization mass spectrometry (ECNI-MS). The derivatives are then extracted and analyzed by gas chromatography–mass spectrometry (GC-MS). The mist chamber method was applied in a field test to determine the extent of acrolein in ambient air near the Peace Bridge plaza in Buffalo, New York, an area of heavy traffic near a major border crossing between the United States and Canada. In addition, XAD-2 adsorbent cartridges coated with 2-(hydroxymethyl)piperidine (2-HMP) according to Occupational Safety and Health Administration (OSHA) Method 52 and passive samplers based on the use of dansylhydrazine (DNSH) were deployed at this location at the same time, which provided the opportunity to compare methods. The mist chamber results showed that the Peace Bridge traffic was clearly a source of acrolein, with an average concentration of 0.26 µg/m3 at a site 152.4 m downwind (northeast) of the plaza. The OSHA cartridges proved to be too insensitive to determine ambient acrolein concentrations. The DNSH passive samplers returned concentrations near the limit of detection; hence the values were a little higher and less consistent than those in the mist chamber results. The optimized mist chamber method was then applied to determine atmospheric acrolein concentrations at three sites in northern California: a site chosen to reflect the hemispheric background, a region dominated by biogenic sources, and an urban environment. The resulting average acrolein concentrations were 0.056, 0.089, and 0.290 µg/m3, respectively, and the limit of detection was 0.012 µg/m3. The consistency of the replicate samples obtained in the field was good, with the relative standard deviations (RSDs)
* A list of abbreviations and other terms appears at the end of the Investigators’ Report.
3
Method to Determine Acrolein and Other Carbonyl Concentrations
ranging from 19% at the hemispheric background site to 3% at the urban site. The advantage of the current mist chamber method is that it can determine ambient acrolein concentrations over short time periods with enough sensitivity to be effective even in relatively “clean” environments. This allows for the determination of temporal patterns related to acrolein concentrations, such as diurnal cycles of reaction kinetics. The main disadvantages of the method are that it is laborious and time-consuming and requires specialized equipment that makes it difficult to utilize for routine monitoring of acrolein.
INTRODUCTION Acrolein, a highly reactive �, �-unsaturated aldehyde, is a pulmonary toxicant and a common constituent of both indoor and outdoor air (Agency for Toxic Substances and Disease Registry 1990; Concise International Chemical Assessment Document [CICAD] 2002). Acrolein is produced by the incomplete combustion of organic material as well as the oxidation of atmospheric chemicals such as 1,3butadiene, which is a primary component of motor vehicle exhaust. Indoor sources of acrolein include heated cooking oil, cigarette smoke, incense, candles, and wood-burning fireplaces (Ghilarducci and Tjeerdema 1995; California Office of Environmental Health Hazard Assessment 2000). Although regulatory agencies consider acrolein to be one of the most dangerous components of toxic air mixtures (California Air Resources Board [ARB] 1997; U.S. Environmental Protection Agency [EPA] 2003; Tam and Neumann 2004), studies of carbonyls in the atmosphere often omit acrolein (Coutrim et al. 1993; Zhang et al. 1994; Grosjean and Grosjean 1995; Pires and Carvalho 1998; Brombacher et al. 2002; Pereira et al. 2002; Bakeas et al. 2003; Pereira et al. 2004; Sax et al. 2004; van Leeuwen et al. 2004) or report its concentration as “below the limit of detection” (Grosjean et al. 1996). The current EPA method of determining acrolein concentrations in air (Method TO-11) is based on the welldocumented reaction between carbonyls and dinitrophenylhydrazine (DNPH), which produces hydrazones that are then separated by high-pressure liquid chromatography and detected by UV spectrophotometry (Grosjean 1982; Lipari and Swarin 1982; Tejada 1986). EPA Method TO-11, though effective for many aldehydes and ketones, has not proved reliable for acrolein and other unsaturated carbonyls. Problems inherent in the methodology have been reported, including the long sampling times necessary when using cartridges (typically 4 to 12 hours at flow
4
rates of 0.1 to 1.0 L/min), instability of the DNPH-acrolein hydrazone during collection and storage (Tejada 1986; Kieber and Mopper 1990; Goelen et al. 1997; Schulte-Ladbeck et al. 2001; Huynh and Vu-Duc 2002; Dong and Moldoveanu 2004; Weisel et al. 2005), and poor chromatographic separation of the complex carbonyl mixtures typically found in air (Coutrim et al. 1993; Otson et al. 1993; DabekZlotorzynska and Lai 1999; Huynh and Vu-Duc 2002). Because these problems can bias the results both positively and negatively, acrolein concentrations reported in the literature vary widely and remain controversial. A rigorous multilaboratory study comparing several methods found the DNPH method unsuitable for acrolein (Goelen et al. 1997). Progress has been made in resolving these limitations, such as using mass spectrometry instead of UV detection, but th e instabil it y of the DNPH-acrolein hydrazone, which breaks down on the sampling cartridge during collection times longer than 1 hour (Goelen et al. 1997), has not been overcome. Another analytical approach for acrolein determination, namely EPA Method TO-15, uses canisters to collect ambient air, and the chemicals present are then analyzed by cryofocusing followed by GC-MS. This approach, which is used by the Monitoring and Laboratory Division of the California ARB, has several advantages: it does not require derivatization; it can be used to collect samples over very short periods or daylong periods, as desired; and sample preparation and analysis are simple. The disadvantage of canister sampling is that both positive and negative artifacts can arise from ozone in the air sample. In addition, wall effects (adsorption and reactions of chemicals) may still occur despite the electropolishing designed to reduce these effects. Also, the canisters are expensive and bulky, which limits the number of samples that can be collected at any given sampling event. Finally, the canisters can only hold a limited volume of air, typically a few liters, which may limit the sensitivity of this method. The California ARB Monitoring and Laboratory Division network reports a minimum detection limit (MDL) for this method of 0.3 ppbv (0.69 µg/m3), and almost all of its reported values for acrolein in 2005 and 2006 are between the MDL and twice the MDL, a range in which quantification is often difficult. Other analytical methods are also available. OSHA Method 52 employs an XAD-2 adsorbent cartridge coated with 2HMP (Rohm and Haas Co., Philadelphia, PA), but its sensitivity (3 ppb for an 8-hour sample at 0.1 L/min) is not sufficient for ambient acrolein measurements. DNSH and 4hydrazinobenzoic acid have been used to trap carbonyls in cartridges and passive samplers, but thus far these methods have not provided reproducible values for ambient acrolein concentrations (Zhang et al. 2000; Pereira et al. 2002;
T.M. Cahill et al.
Pereira et al. 2004; Herrington et al. 2005). Methods using other carbonyl-derivatizing agents, including 2,3,4,5,6pentafluorophenylhydrazine (PFPH), o-benzylhydroxylamine, n-benzylethanolamine, cysteamine, and n-methyl4-hydrazino-7-nitrobenzofurazan, have met with limited success owing to the need for expensive equipment or reagents, inadequate sensitivity, or poor selectivity (Otson et al. 1993; Yasuhara and Shibamoto 1994; Jain and Thielen 1995; Schulte-Ladbeck et al. 2001; Ho and Yu 2004). The objective of this research was to develop and validate an analytical procedure capable of detecting acrolein and other gaseous carbonyls at low part-per-trillion concentrations in samples collected over short periods of approximately 10 minutes. The goal of a highly sensitive method was largely dictated by the low EPA reference concentration (RfC) for acrolein, which is below the detection limits of most existing sampling methods; thus, we wanted to develop a method that could determine ambient acrolein concentrations below the RfC. A short sample collection time was given a high priority because the method could be used to determine acrolein concentrations at specific times when measuring temporally variable sources such as automobile traffic. A short sampling time also would allow the method to determine the kinetics of acrolein with greater time resolution (e.g., by determining indoor acrolein concentrations before and after cooking). In some situations, such as determining an 8-hour average concentration for regulatory purposes, a short sampling time is a disadvantage because many samples would need to be collected and the results averaged. Thus, this method is more suited to specialty applications than to routine monitoring. The new method reported herein employs a mist chamber, also called a Cofer scrubber, containing a sodium bisulfite solution that forms stable, water-soluble sulfonates with carbonyl species (Boyce and Hoffmann 1984; Kok et al. 1986; Betterton and Hoffmann 1987; Olson and Hoffmann 1988; Kaneda 1994; Dufour et al. 1999; Lowinsohn and Bertotti 2002). After sample collection the sulfonates are dissociated, and the free carbonyls are derivatized with PFBHA and form thermally stable oxime adducts that can be analyzed by gas chromatography with visualization by ECNI-MS (Yu et al. 1995; Yu et al. 1997; Ho and Yu 2004). The potential for positive and negative artifacts arising from ozone and atmospheric precursors, such as isoprene and 1,3-butadiene, was evaluated in the analytical system. The method was then validated both in the laboratory and in the field using labeled acrolein (acrolein-d4) to create a matrix spike before sample collection. The sensitivity and precision of the new methodology were then determined under field conditions to give the most representative estimates of method performance.
SPECIFIC AIMS The overall objective of the project was to develop and evaluate a new method to determine concentrations of acrolein and other toxic carbonyls in air and then use the method to explore exposure of a population routinely exposed to these toxicants. The population proposed in this study was tollbooth attendants. The first specific aim of the study was to develop and validate analytical methods to determine levels of acrolein and other small carbonyls that are found in low part-pertrillion concentrations within a sampling time of 10 minutes. To fulfill this aim, we set the following objectives: (a) investigate and optimize reaction conditions for the formation of carbonyl-bisulfite adducts to further PFBHA derivatization of the carbonyls; (b) investigate collection efficiency of the mist chamber methodology; (c) evaluate both positive and negative interferences arising from ozone; and (d) test the method by measuring acrolein and other carbonyls in the ambient environment. The second specific aim was to develop a sampling plan, based on preliminary data, to assess the acrolein exposure of a test population. We planned to sample air inside and outside tollbooths to investigate the influence of traffic conditions, ambient air temperature, and time of day on the concentration of carbonyls in ambient air. The third specific aim was to analyze the data to (a) evaluate whether a correlation exists between ambient and indoor air measurements; (b) assess whether higher concentrations of carbonyls, which can be produced by photooxidation reactions, are present during times of the day with higher temperatures and more intense solar radiation; (c) attempt to determine the source of the carbonyls by comparing their concentrations in tollbooths that primarily serve diesel-powered vehicles and in tollbooths that primarily serve gasoline-powered cars; and (d) assess the effects of stop-and-go traffic lanes compared with fasttrack traffic lanes. The project was discontinued after the second year, during the final experiments to validate the method. Although functional, the method was time-consuming and laborious, and it would not be easy for other research groups to replicate. Therefore, the mist chamber method did not have the widespread application of the simpler methods using cartridges and passive samplers. Consequently, exposures to tollbooth attendants were not evaluated; however, acrolein sampling was conducted for 3 days near the Peace Bridge plaza in Buffalo, alongside sampling being conducted as part of an HEI air toxics “hot spot” study.
5
Method to Determine Acrolein and Other Carbonyl Concentrations
METHODS AND STUDY DESIGN The core objective of this project was the development of a new analytical procedure to determine the presence of acrolein in the ambient atmosphere at trace concentrations with a high degree of time resolution. The method development consisted of five stages: namely, carbonyl trapping, carbonyl derivatization, extraction of derivatives, determination of collection efficiency, and evaluation of ozone interference. The method was then used in two field studies. The first study was to assess the concentrations of acrolein and other small carbonyls upwind and downwind from the Peace Bridge plaza in Buffalo. This project provided an opportunity to compare sampling methods because Dr. John D. Spengler (of the Harvard School of Public Health) was also collecting samples for acrolein determination as part of an HEI air toxics hot spot study. The second field test was designed to validate the methodology by collecting samples from three different sites in California: a clean site in the marine boundary layer along the north coast of California, chosen to represent the hemispheric background with no anthropogenic sources of air pollution; a remote forested region that has a long record of low air pollution, which was chosen to test for the influence of biogenic sources on ambient concentrations; and Roseville, an urban site northeast of Sacramento with vehicular and other anthropogenic emissions. Large numbers of replicate samples were collected in short time periods at each site to test method precision and collection efficiency under field conditions. The method development stage of the research focused on the collection, derivatization, and extraction of several representative small, volatile carbonyls (Table 1). Four of
those evaluated were unsaturated carbonyls (acrolein, methacrolein, methyl vinyl ketone, and crotonaldehyde) that have been problematic in previous research projects. Two were the small dicarbonyl species glyoxal and methylglyoxal. These six chemicals are also common products of combustion and atmospheric oxidation. At the later stages of method development, benzaldehyde was added to the tests to represent an aromatic aldehyde that may be the result of the combustion of aromatic compounds in fuels. MIST CHAMBER METHODOLOGY Currently, many different methods are available for the determination of carbonyls in the atmosphere. Most of these methods rely on passing air through a small cartridge and trapping the carbonyls. Unfortunately, the cartridge sampling methods require very low air flow rates (< 1 L/min), which means long sampling times are necessary to collect quantifiable amounts of the carbonyls. This presents a problem if the objective of the sampling is to determine short-term fluctuations in the concentrations of the chemicals. Longer sampling times also make the sampling method vulnerable to changing meteorologic conditions, such as shifts in the wind direction, which may complicate interpretation of the results. Long collection times may also be undesirable in terms of analyte stability. For example, the DNPH derivatives are unstable under moist conditions and may degrade in the cartridge even before sample collection is complete. Therefore, we investigated using mist chambers as a sampling method because they can be operated at high flow rates (up to 20 L/min) and have been successfully used in the past to determine ambient carbonyl concentrations (Spaulding et al. 2002). The mist chamber is attached to a vacuum pump that pulls air through a nebulizer,
Table 1. The Seven Representative Carbonyls Used for Method Development and Validation Common Name
IUPAC Name
CAS Registry Number
Formula
Acrolein Methacrolein Methyl vinyl ketone Crotonaldehyde
2-Propenal 2-Methyl-2-propenal Methyl vinyl ketone (E)-2-butenal
107-02-08 78-85-3 78-98-4 123-73-9
C3H4O C4H6O C4H6O C4H6O
Glyoxal Methylglyoxal
Ethanedial 2-Oxopropanal
107-22-2 78-98-8
C2H2O2 C3H4O2
Benzaldehyde
Benzaldehyde
100-52-7
C7H6O
6
T.M. Cahill et al.
to be modified to trap the more volatile carbonyls such as acrolein. CARBONYL-BISULFITE ADDUCT FORMATION Previous analytical methods that utilized the mist chamber methodology to determine carbonyl concentrations have been unable to quantify acrolein. Therefore, the first task was to identify a means to trap and retain the more volatile carbonyls such as acrolein. Carbonyls have been shown to complex with bisulfite to form stable carbonylbisulfite adducts (Kaneda 1994; Dufour et al. 1999; Lowinsohn and Bertotti 2002). The bisulfite attacks the carbon of the carbonyl group to form a sulfonic acid, which makes the carbonyl-bisulfite adducts highly water soluble and relatively nonvolatile. This reaction is reversible. The carbonyl-bisulfite adducts can be disassociated by removing the bisulfite from the solution, which will shift the equilibrium toward the free carbonyl species. Therefore, we investigated the use of bisulfite to trap volatile carbonyls from the air stream.
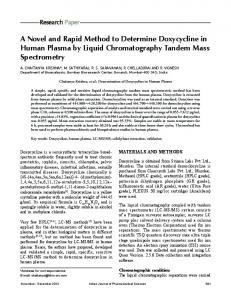
Figure 1. Diagram of the mist chamber. Air is pulled through a nebulizer that creates a fine mist from the bisulfite collection solution. The carbonyls then partition into the droplets and react with the bisulfite to form carbonylbisulfite adducts that are not volatile; thus, the carbonyls are trapped in the solution. The mist condenses on a series of baffles and drains down to the reservoir of bisulfite collection solution, where it is recycled.
Although the formation of carbonyl-bisulfite adducts has been described previously in the literature, we wanted to verify that the adduct formation was fast enough to trap the carbonyls in the mist chamber solution and prevent revolatilization. We measured the formation constants of three carbonyl-bisulfite adducts, acrolein-bisulfite, methylglyoxal-bisulfite, and formaldehyde-bisulfite, using the p-rosaniline method originally developed by Dasgupta and colleagues (1980). The first step was to determine the optimal pH of the solution to ensure the greatest amount of bisulfite would be present. In aqueous (H2O) solutions, bisulfite (HSO3�) can dissociate to form sulfur dioxide (SO2) or sulfite (SO32�) according to the following acidbase equilibria: SO2 + H2O ↔ HSO3� + H+
pKa = 1.9
(1)
which creates a fine mist from the aqueous collection solution in the chamber (Figure 1). The fine mist provides a large surface area for the adsorption of chemicals from the gas phase; therefore, water-soluble chemicals will partition into the water droplets. Baffles and poly(tetrafluoroethylene) (PTFE) membrane (Teflon) filters block the mist from leaving the chamber, so it drains back down into the pool of collection solution to be recycled.
where pKa is the negative logarithm of the acid-dissociation constant. When the pH is 5.0, bisulfite is the predominant species in the solution, which should provide optimal conditions for formation of the carbonyl-bisulfite adduct. Therefore, we determined the formation constants for a bisulfite solution at pH 5.
Previous research indicated that a simple water solution effectively trapped chemicals with Henry law constants lower than 1.01 Pa • m3/mol. However, acrolein has an estimated Henry law constant of 11.1 Pa • m3/mol (Staffelbach and Kok 1993) and is not expected to be effectively trapped by water or a solution of water and PFBHA (Spaulding et al. 2002). Therefore, the mist chamber collection solution had
In these experiments separate solutions containing acrolein, methacrolein, crotonaldehyde, glyoxal, methylglyoxal, and formaldehyde were prepared, and bisulfite was added to each solution in about 10-fold excess. The rate of adduct formation was monitored by the disappearance of the bisulfite as the carbonyls each react with bisulfite in a 1:1 molar ratio. Glyoxal and methylglyoxal present a problem
HSO3� ↔ SO32� + H+
pKa = 7.17
(2)
7
Method to Determine Acrolein and Other Carbonyl Concentrations
because they may form double adducts, in which case the loss of bisulfite may be faster. This may result in an overestimate of the second-order formation rate constant (kf) for these carbonyls, but the maximum overestimate would be 2-fold. The experiment was allowed to proceed for 40 minutes. Equilibrium was attained for all the compounds by 20 minutes. The formation rate constants were calculated using pseudo-first-order kinetics where the bisulfite concentration is greater than the carbonyl concentration in the aqueous solution (square brackets in the following expressions indicate concentration). Therefore, [Carbonylaqueous] + [Bisulfite] → [Carbonyl-bisulfite adduct]
(3)
Rate of loss of bisulfite = d[Bisulfite]/dt = �kf[Bisulfite][Carbonyl]
(4)
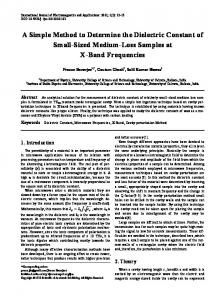
Once again, the loss of the bisulfite corresponds to the formation of the carbonyl-bisulfite adduct. Therefore, the rate of adduct formation can be calculated by plotting the natural logarithm of the bisulfite concentration at a given time (t) divided by the bisulfite concentration at the beginning of the experiment, against time for the experiment (Figure 2). The corresponding slope of the line is kp, which is negative because the equations were formulated as the loss of the bisulfite, so the rate of creation of the adduct will simply have the opposite sign and thus be a positive number. The results (Table 2) showed that carbonyls readily formed adducts, even in solutions with bisulfite concentrations that were relatively dilute (~1.5 mM) compared
If bisulfite is present in vast excess, then this equation collapses to a pseudo-first-order kinetics equation: Rate of loss of bisulfite = d[Bisulfite]/dt = �kp[Carbonyl], where kp is the pseudo-firstorder formation rate constant and (5) kp = kf[Bisulfite] The amount of bisulfite remaining at any given time is determined by integrating the above equation from time zero (0) to any ending time (t). The resulting equation describes the first-order loss process as [Bisulfite]t = [Bisulfite]0 •
e�kt
(6)
Solving for k gives kp = �{ln([Bisulfite]t/[Bisulfite]0)}/t
(7)
Figure 2. Decline in free bisulfite concentration over time as bisulfite binds to carbonyls. Decline is expressed as the natural logarithm of the concentration at a specific time (Ct) relative to the initial concentration (C0). The rate constant for the formation of bisulfite adducts with single carbonyls such as acrolein is the same as the positive value of the slope of the decline curves. Dicarbonyls such as methylglyoxyal may lose bisulfite more rapidly owing to double adduct formation; in these cases the measured rate constant is expected to be a slight overestimate.
Table 2. Formation Constants of Carbonyl-Bisulfite Adducts Formation Constanta
Concentration (M) Carbonyl
Bisulfite
kp (sec�1)
kf (M�1sec�1)
% Yield in 10 Minutes
Acrolein Methacrolein Crotonaldehyde
1.1 � 10�4 2.5 � 10�4 1.2 � 10�4
1.65 � 10�3 1.55 � 10�3 1.55 � 10�3
1.2 � 10�3 1.0 � 10�3 1.0 � 10�3
0.73 ± 0.10 0.65 ± 0.03 0.65 ± 0.15
96 83 90
Glyoxal Methylglyoxal
6.2 � 10�5 5.0 � 10�5
1.55 � 10�3 1.65 � 10�3
3.4 � 10�3 5.6 � 10�3
2.19 ± 0.28 3.39 ± 0.24
83 100
Formaldehyde
5.0 � 10�5
1.65 � 10�3
2.5 � 10�3
1.52 ± 1.36
99
Carbonyl
a
The term kp is the pseudo-first-order rate constant for formation, and kf is the second-order formation rate constant.
8
T.M. Cahill et al.
Table 3. Comparison of the Second-Order Formation Constants for Carbonyl-Bisulfite Adducts in Previous Studies and the Current Study Concentration (M) Carbonyl
kf (M�1sec�1)
Bisulfite
Carbonyl
pH
Reference
Formaldehyde
0.53 1.23 1.52 2.26
8.0 � 10�3 1.02 � 10�3 1.65 � 10�3 1.25 � 10�3
8.0 � 10�4 9.65 � 10�6 5.0 � 10�5 1.0 � 10�2
2.5 5.0 5.0 3.4
Boyce and Hoffmann 1984 Kok et al. 1986 This study Boyce and Hoffmann 1984
Glyoxal
0.72 2.19
1.5 � 10�3 3.4 � 10�3
1.5 � 10�2 6.2 � 10�5
3.3 5.0
Olson and Hoffmann 1988 This study
Methylglyoxal
3.39 5.92
1.65 � 10�3 2.5 � 10�3
5.0 � 10�5 2.5 � 10�4
5.0 5.0
This study Betterton and Hoffmann 1987
with carbonyl concentrations. The rate constants for the reactions between bisulfite and formaldehyde, glyoxal, and methylglyoxal were comparable to previously reported values (Table 3) (Boyce and Hoffmann 1984; Kok et al. 1986; Betterton and Hoffmann 1987; Olson and Hoffmann 1988). The rapid formation of adducts, ranging from 83% to 100% of the available carbonyl lost to adduct formation over a 10-minute period, indicates that bisulfite was indeed an effective trapping agent for carbonyls within the time scale chosen for sample collection. Furthermore, the concentration of bisulfite selected for the sample collection protocol (described below) was 0.1 M, which is over 100-fold higher than the concentration of bisulfite investigated in these binding experiments. Given that the formation of the bisulfite-carbonyl adduct is a second-order reaction, increasing the concentration of the reactant will further increase the rate of adduct formation. Therefore, we expect that the half-life of acrolein in the 0.1 M bisulfite solution to be approximately 9.5 seconds. All the experiments to determine binding rates were conducted at room temperature (21�C). Field temperatures may vary widely during sample collection, which will affect the rate at which carbonyls bind to bisulfite. However, carbonyls have a very short half-life in bisulfite, which makes it unlikely they will escape, even if the binding rate in the field is slower owing to lower temperatures. Theoretically, higher temperatures would speed the binding process, and hence any effect would be to trap the carbonyls more efficiently. In practice, higher ambient temperatures result in greater evaporation and evaporative cooling of the solution, which keeps the solution temperature below the ambient temperature. Also, higher temperatures may affect the gas-solution partitioning, which may result in more chemical remaining in the gas phase.
PREPARATION OF THE 0.1 M BISULFITE SOLUTION There are two basic approaches for preparing a bisulfite solution: either dissolving sodium bisulfite (NaHSO3) directly into pure water or acidifying a sodium sulfite solution. For the research presented in this report, we used the latter approach to form the 0.1 M bisulfite solution. By this approach 12.6 g of sodium sulfite (Na2SO3) is dissolved in 1 L of water and then 5.5 mL of 18 M sulfuric acid is added. The solution is allowed to equilibrate for several days before use. In theory, this creates a solution of 0.1 M sodium bisulfite and 0.1 M sodium bisulfate (NaHSO4). Sodium bisulfite also can be purchased and dissolved directly into water to form a 0.1 M bisulfite solution. This approach is faster and eliminates the 0.1 M sodium bisulfate component. Therefore, we evaluated the ability of the 0.1 M bisulfite solution formed from purchased sodium bisulfite to retain carbonyls and compared it with that of the acidified sodium sulfite solutions that have been used in this research. This experiment consisted of spiking the bisulfite solutions (n = 4 samples for each type of solution, but one acidified sodium sulfate sample was lost during processing) with acrolein-d 4 , benzaldehyde-d 6 , and acetaldehyde-d 4 . The bisulfite solutions were allowed to react with the carbonyls for 10 minutes, as called for in the standard operating procedure (Appendix A), and then the solutions were poured into mist chambers. Purified nitrogen gas was passed through the mist chambers at a rate of 19.8 L/min for 10 minutes to simulate a “normal” sample. The solutions were removed from the mist chambers and derivatized, and the amounts of the labeled carbonyls remaining were quantified. Thus, this experiment was designed to test for the loss of the adducted carbonyls from a single mist chamber by comparison with the calibration standards. The method using acidified sodium sulfite had considerably greater retention of the labeled acrolein (92.9% ± 3.9%
9
Method to Determine Acrolein and Other Carbonyl Concentrations
retained, n = 3) than the approach using purchased sodium bisulfite (72% ± 7.2% retained, n = 4). The benzaldehyded6 was less sensitive to the method of bisulfite solution formation, with both the acidified sodium sulfite approach (87.8% ± 4.9% retained, n = 3) and the purchased sodium bisulfite approach (90.2% ± 9.4% retained, n = 4) working well. In contrast, neither approach retained acetaldehyded4 (< 5% retained, n = 7). The finding that the acidified approach was more effective for acrolein raises a question about whether the presence of additional sodium bisulfate in the solution influences the binding and retention of carbonyls. The purchased sodium bisulfite also had higher background concentrations of carbonyls. SELECTION OF THE DERIVATIZATION AGENT The analysis of acrolein effectively requires derivatization for two reasons. One reason is that acrolein is very reactive, and the derivatization makes the analyte more stable for transport and analysis. The other reason is that acrolein is a small hydrocarbon (molecular weight = 56 g/mol) without any readily detectable functional groups, and the derivatization results in the addition of a functional group that can be detected in minute amounts by mass spectrometry methods. Previous research has used PFBHA to derivatize and determine concentrations of carbonyls in the atmosphere (Figure 3) (Spaulding et al. 2002). Therefore, we evaluated this reagent, as well as PFPH, which also has been used in
determination of ambient carbonyl concentrations (Ho and Yu 2004). Both these compounds generate stable pentafluorophenyl derivatives of the carbonyls. These derivatives are reasonably volatile, which makes them amenable to gas chromatography (GC), and they are easily detected by ECNI-MS. We were unable to analyze the PFPH hydrazones by GC using a liquid injection (Ho and Yu 2004 used thermal desorption), and we found that the PFPH reagent remaining in the sample extract damaged the GC columns. We thus discontinued our investigation of this reagent. DNPH is another common derivatization reagent for carbonyls, but its stability is questionable (Tejada 1986; Goelen et al. 1997), and thermally unstable derivatives are unsuitable for analysis by GC. Thus, we selected PFBHA as the derivatization agent. INSTRUMENTAL ANALYSIS AND MASS SPECTRAL CHARACTERIZATION The pentafluorobenzyl (PFB) derivatives were analyzed by GC-MS using an Agilent 6890N gas chromatograph coupled to a 5793N quadrupole mass spectrometer. A DBXLB capillary column was used for separating the derivatives (5% phenyl-substituted stationary phase, 30-m length, 0.25-mm I.D., 0.25-µm film thickness; J&W Scientific, Folsom, CA). The oven temperature initially was set to 50�C and held there for 2 minutes, then ramped at 5�C/min to 150�C, 20�C/min to 260�C, 30�C/min to 325�C, and held for 5 minutes. This provided good separation of
Figure 3. Derivatization reactions for the formation of a pentafluorobenzyloxime from a carbonyl.
10
T.M. Cahill et al.
Figure 4. Chromatogram from an ambient air sample collected in Roseville. The chromatogram shows baseline resolution between analytes of interest. Many carbonyls give two peaks owing to the stereochemistry of the addition of the PFB group to the carbonyl. Hexanedial identification is uncertain owing to the lack of a standard.
the analytes both in calibration standards and in field samples (Figure 4). The mass spectrometer was operated in the ECNI mode, with a range of m/z 50 to 500, which affords the highest sensitivity with fluorinated compounds. The source temperature was constant at 150�C, and the reagent gas was methane (40%). The PFBHA derivatives of the carbonyls were characterized in this ionization mode to identify the best quantification ion and the mechanism of fragmentation.
We investigated the ECNI mass spectra of acrolein, methacrolein, methyl vinyl ketone, crotonaldehyde, glyoxal, and methylglyoxal (Table 4). Few data exist on ECNIMS analysis of PFBHA derivatives. Previous research that investigated aliphatic and unsaturated aldehydes and ketones observed low-intensity molecular anions and an [M– HF]� anion for all the compounds, but for the unsaturated aldehydes and two of the unsaturated ketones tested, the base peak (the tallest peak in a mass spectrum, which is assigned a relative intensity value of 100) was an [M–HF]� anion (Lelacheur et al. 1993). The base peak in the ECNI mass spectra of the aldehydes and ketones in the current study was an ion at m/z 178 [C 6 F 4 CH2 O] � , or m/z 181 [C6F5CH2]�, or m/z 196 [C6F5CHO]�. Similar to findings in previous work, dissociative resonance capture reactions appeared to dominate, as was evident by the [M–HF]� anion appearing as the base peak in the ECNI mass spectra for the unsaturated aldehydes and ketones (acrolein, methacrolein, methyl vinyl ketone, and crotonaldehyde). Figure 5 shows the spectrum for acrolein. Also similar to the previous study (Lelacheur et al. 1993), the [M–HF]� anion was absent from the ECNI mass spectra of the two dicarbonyls, glyoxal and methylglyoxal. For these compounds, the base peak was an ion that corresponds to the loss of a PFB anion, [M–181]�. Therefore, [M–HF]� was selected as the quantification ion for the unsaturated carbonyls, while [M–181]� was selected as the quantification ion for the dicarbonyls.
Table 4. Major Ions of the PFBHA-Derivatized Carbonyls in Electron-Capture Negative Ionization Mass Spectrometry % Relative Intensities of Common Ions Carbonyl (Molecular Weight of Derivative)
[M � 20]� [M � HF]�
Unsaturated Carbonyls Acrolein (251) 100 Methacrolein 100 (265) Crotonaldehyde 100 (265) Methyl vinyl 100 ketone (265)
Dicarbonyls Glyoxal (448) Methylglyoxal (462)
[M � 50]� [M � HFNO]�
Other m/z [M � 181]�
[C6F5CHO]� [C6F5CH2]� [C6F4CH2O]� (m/z 196) (m/z 181) (m/z 178)
[C6F5]� (m/z 167)
75 44
35 18
19
41 21
5 3
54
33
9
23
1
17
32
24
68
5
2 2
8 17
3
100 100
43 40
m/z (%)
225 (57) 210 (41) 197 (32) 192 (23)
392 (7)
11
Method to Determine Acrolein and Other Carbonyl Concentrations
Figure 6. Influence of peroxide concentration on PFBHA derivatization of acrolein in solutions of hydrogen peroxide and bisulfite (n = 3). The first bar shows the best derivatization (in pure water), and the second bar shows typical derivatization in 0.1 M bisulfite solution without hydrogen peroxide. Error bars are ± 1 SD. Figure 5. Mass spectrum for PFBHA-derivatized acrolein. The spectrum shows the dominance of the [M–HF]� anion fragment that is typical of many PFB-derivatized carbonyls.
DERIVATIZATION OPTIMIZATION The new analytical method relies on the PFBHA derivatization of the carbonyls (equations 8, 9, and 10) to stabilize the analytes and improve their detection by ECNI-MS. The first task is to break apart the carbonyl-bisulfite adducts present in the mist chamber trapping solution, to libe r a t e t h e f r e e c a r b o n y l s . Th e c a r b o n y l s a r e t h e n derivatized to their PFB-oximes. To obtain the greatest product yield for the derivatives, we first optimized the PFBHA derivatization conditions, as follows. •
•
Bisulfite adduct disassociation is represented as Carbonyl-bisulfite adduct ↔ Carbonyl + Bisulfite
(8)
Carbonyl + Bisulfite + H2O2 ↔ Carbonyl + Sulfate + H2O
(9)
Carbonyl derivatization is represented as Carbonyl + PFBHA ↔ PFB-carbonyloxime
(10)
The primary conditions that need to be optimized are concentration of hydrogen peroxide (H2O2) to remove the bisulfite, concentration of PFBHA, derivatization time, sample storage time, and standard stability in different solvents. Hydrogen Peroxide Concentration The first variable to be investigated was the concentration of hydrogen peroxide necessary to remove the bisulfite. The
12
bisulfite forms adducts with the carbonyls, and thus can compete with the PFBHA for the carbonyls. Excess peroxide is undesirable because it may degrade the analytes, but the peroxide concentration must be sufficient to completely remove the bisulfite. We tested four different molar ratios of hydrogen peroxide to bisulfite to determine which was the most effective. In addition, derivatization was conducted in both pure water, which served as a positive control, and a bisulfite solution, which served as a negative control. Three replicates were prepared for each test condition. The derivatization was conducted for 24 hours, and then the derivatized analytes were extracted and analyzed. The results (Figure 6, Table 5) showed that a very slight excess of peroxide (1.06:1 molar ratio of hydrogen peroxide to bisulfite) was sufficient to give the maximum derivatization response in the bisulfite solution. The result with this slight excess of hydrogen peroxide in the bisulfite solution was effectively the same as the result with the pure water control (> 90% yield for acrolein), which showed that the addition of hydrogen peroxide could remove the bisulfite and allow the derivatization to proceed. The bisulfite solution without the addition of hydrogen peroxide gave the lowest response, thus showing that the derivatization cannot be conducted in the presence of bisulfite alone. Higher concentrations of peroxide (> 2:1 molar ratio of hydrogen peroxide to bisulfite) were shown to be detrimental to the analysis. Therefore, a slight excess of hydrogen peroxide was used for all future experiments. The use of an oxidizing agent such as hydrogen peroxide in the analytical method raises questions about artifacts arising from the peroxide and either degrading the
T.M. Cahill et al.
Table 5. Effect of Hydrogen Peroxide Concentration (Normalized Response to Internal Standard, n = 3) on PFBHA Derivatization Yield in 0.1 M Bisulfite Solutions % Yield ± SD by Molar Ratio of Hydrogen Peroxide to Bisulfite Carbonyl Acrolein Methacrolein Methyl vinyl ketone Crotonaldehyde Glyoxal Methylglyoxal a
0:1a
1.06:1
2:1
10:1
50:1
1.9 ± 0.3 9.1 ± 5.5 2.0 ± 1.2 2.4 ± 0.7
93.4 ± 0.4 108.0 ± 3.8 15.2 ± 1.2 91.1 ± 2.5
92.8 ± 11.6 102.0 ± 11.1 14.3 ± 2.5 106.0 ± 9.4
71.6 ± 17.4 95.9 ± 27.2 26.2 ± 9.7 50.4 ± 17.2
25.0 ± 8.2 40.1 ± 14.7 21.7 ± 4.0 14.9 ± 3.2
7.6 ± 3.3 33.0 ± 17.2
27.3 ± 0.4 47.0 ± 3.9
25.5 ± 1.9 43.9 ± 7.7
17.6 ± 9.2 40.9 ± 12.6
2.5 ± 0.6 8.9 ± 1.1
No hydrogen peroxide is added to the solution.
analytes or forming analytes from precursor compounds. In the peroxide concentration experiment, excessive peroxide caused lower responses, and thus negative artifacts are possible. However, over 24 hours the peroxide artifacts were minimal when low ratios of hydrogen peroxide to bisulfite (1:1 or 2:1) were used. Longer periods of exposure to hydrogen peroxide may cause degradation of the analytes, so the use of internal standards such as acrolein-d4 is recommended as a means to account for any analyte loss. To evaluate whether or not the peroxide would create the target analytes from common atmospheric precursors, we added isoprene and 1,3-butadiene directly to our bisulfite–hydrogen peroxide–PFBHA derivatization solution (n = 3) at approximately 1000-fold greater concentration than would be expected in the ambient atmosphere samples. Small amounts of methacrolein and methyl vinyl ketone, which were the expected oxidation products of isoprene, were observed. However, the mass of these oxidation products was only 0.04% of the initial isoprene concentration, which is insignificant, particularly in light of the massive excess of the precursor compounds above expected environmental concentrations. No other carbonyls, including acrolein, were detected. We are thus confident that the addition of peroxide to our derivatization solution does not result in oxidation of the carbonyls or significant formation of carbonyl artifacts from expected concentrations of atmospheric precursors. PFBHA Concentration The second variable optimized was the concentration of PFBHA. In particular, we wanted to improve the derivatization of the dicarbonyls, which was slow because they required double derivatization. However, excessive amounts of PFBHA increase the reagent noise in the chromatograms and may contribute to column wear. Four different concentrations of PFBHA (n = 3 replicates per condition) were
Figure 7. Effect of PFBHA concentration on carbonyl derivatization for a 24-hour reaction time (n = 3). Error bars are ± 1 SD.
investigated to determine which gave the best response. The PFBHA concentrations investigated were 0.4 mM, 1 mM, 2 mM, and 4 mM, and the derivatization time was 24 hours. The 0.4 mM PFBHA concentration gave lower relative responses for the two dicarbonyls, glyoxal and methylglyoxal (Figure 7), but the results with the three higher concentrations were not markedly different from each other. As the PFBHA-carbonyl reaction is a second-order reaction, increasing the concentration of the PFBHA should have increased the reaction rate. Because no increase in reaction rate was observed for most of the compounds, we concluded that the carbonyl release from the bisulfite adducts was the rate-limiting step for the derivatization. Although using a PFBHA concentration greater than 1 mM may increase the rate of derivatization for some carbonyls over 24 hours, it also increases the reagent background in the chromatogram. We therefore elected to use 1 mM PFBHA for future experiments.
13
Method to Determine Acrolein and Other Carbonyl Concentrations
Figure 8. Recovery of derivatized carbonyls from bisulfite–PFBHA– hydrogen peroxide solution as a function of reaction time (n = 3). Error bars are ± 1 SD.
Derivatization Time The next variable optimized was the derivatization time. In an aqueous solution, the PFBHA-carbonyl derivatization reaction requires less than 24 hours for all carbonyls studied (Yu et al. 1995; Ho and Yu 2002; Spaulding et al. 2002). In the bisulfite solution, however, the reaction kinetics are complicated by the release of the bisulfite adduct, so the derivatization may require more time. Therefore, we compared derivatization times of 24, 48, 72, 96, and 168 hours (n = 3 replicates per condition). The responses of the derivatized analytes were analyzed relative to nonderivatized internal standards. The results showed that the dicarbonyls required up to 168 hours for complete derivatization, while some of the unsaturated carbonyls showed declining responses after 48 hours (Figure 8). The long derivatization time for the dicarbonyls was probably caused by the release of the two bisulfite adducts and the subsequent double-derivatization of the compounds. The decline of the unsaturated carbonyls with time may be due to disulfonate formation or the longer exposure to the slight excess of hydrogen peroxide. Overall, 96 hours (4 days) appeared to be the optimal derivatization time over the range of compounds investigated. Heating the samples may increase the derivatization reaction rate and thus shorten the reaction time, but it would most likely speed the degradation reactions of the unsaturated carbonyls. Therefore, heating would be unlikely to improve derivatization of the dicarbonyls without sacrificing the unsaturated carbonyls that are the focus of this research. These results showed that the analyte response was very sensitive to derivatization time and that no single derivatization time was optimal for all the compounds. However, linear calibration curves were obtained for all the compounds
14
Figure 9. Loss of acrolein, crotonaldehyde, methyl vinyl ketone, and methylglyoxal as a function of storage time in a 0.1 M bisulfite solution (n = 3). Loss is expressed as the natural logarithm of the concentration at a specific time (Ct) relative to the initial concentration (C0). Error bars are ± 1 SD.
at any time between 24 and 96 hours. Therefore, consistent calibration can be obtained by preparing the calibration curves at the same time as the samples to ensure equal derivatization times. In the case of field sampling, the calibration standards should be brought into the field and prepared when the samples are collected. Sample Storage Time The stability of the analytes in the bisulfite solution was another factor that required optimization to determine how long the samples could be stored before derivatization. We investigated the stability of the carbonyls in the bisulfite mist chamber solutions over a 30-day period. A 30-day sample was prepared first, followed by a 20-day sample 10 days later, and so forth, so that all the samples could be derivatized, extracted, and analyzed at the same time. The results (Figure 9) indicated that acrolein was stable in the mist chamber collection solutions for at least 7 days, but other compounds, such as methyl vinyl ketone, rapidly degraded. When the changes in concentration were plotted on a logarithmic scale, the decline in unsaturated carbonyls followed pseudo-first-order kinetics. The calculated half-lives of methyl vinyl ketone, methacrolein, crotonaldehyde, and acrolein in a 0.1 M bisulfite solution were 1.1, 12.3, 12.5, and 13.6 days, respectively. The two dicarbonyls, glyoxal and methylglyoxal, appeared to be stable in the bisulfite solution as they did not show any appreciable decline over time. The decline of the unsaturated carbonyls in bisulfite solution appears to be related to the formation of a double bisulfite adduct as shown in Figure 10, a phenomenon that has been observed in other studies (Finch 1961; Dufour et al. 1999). The first reaction, which occurs on the order of seconds, is the addition of a bisulfite ion to the carbonyl
T.M. Cahill et al.
Figure 10. Formation of a double bisulfite adduct from acrolein and bisulfite.
carbon. This reaction is reversible, and it must be reversed for the analytical procedure to be effective. The second reaction, the addition of a second bisulfite group to the double bond of the unsaturated carbonyls, is much slower (on the order of days), but is irreversible. Given the relative instability of the other unsaturated compounds in the bisulfite solution, we decided to derivatize the bisulfitecarbonyl adducts immediately after collection in the mist chamber. This is easily accomplished in the field by adding the mist chamber solution directly to a tube containing the PFBHA–hydrogen peroxide mixture. This storage experiment was conducted at room temperature to approximate a typical, nonrefrigerated temperature in the field. The storage time of the carbonyls in the bisulfite solution could probably be increased if the carbonylbisulfite solutions were refrigerated. However, if the rule of thumb that every 10�C decline in temperature reduces the reaction rate by 50% is correct, then refrigerated solutions could be expected to have half-lives that are four times longer. However, methyl vinyl ketone would still not be stable for more than a few days. The last option is to freeze the solutions, as the 0.1 M bisulfite solutions will freeze solid at �20�C. The analyte stability will have to be evaluated under freezing conditions before this method of sample stabilization is used. However, freezing samples is not always a viable option in the field. Stability of Standards in Different Solvents During the course of the research, we noticed that acrolein standards prepared in methanol and stored in the refrigerator appeared to degrade over time. Therefore, fresh standards were prepared using water, methanol, or acetonitrile as solvents to determine which of them provided the greatest stability for the acrolein standards. Although standards were typically refrigerated, this experiment was conducted at room temperature to speed the rate of chemical loss by reaction. Samples were prepared from the standards immediately after preparation, 7 days later, and 15 days later. A single sample was also prepared from the standards at
Figure 11. Decay of acrolein stored in different solvents at room temperature. Decay is expressed as the natural logarithm of the concentration at a specific time (Ct) relative to the initial concentration (C0).
106 days to confirm the observed trends over a prolonged period of time. The results (Figure 11) clearly showed that acetonitrile was the best solvent for acrolein stability, water was the next best, and methanol was the worst. The samples prepared at 106 days confirmed this trend, with the change in concentration on a logarithmic scale being �3.1, �4.7, and �6.6 for acetonitrile, water, and methanol, respectively. The implication is that acetonitrile is the best solvent for use in the preparation of standards. The results also indicate that standards should be prepared on a regular basis and frozen to slow the rate of degradation of the less stable unsaturated carbonyls, such as acrolein. Furthermore, standards brought into the field for use in calibration curves should be kept cold, although standards prepared in acetonitrile are reasonably stable over 15 days at room temperature. EXTRACTION OPTIMIZATION The next stage of method development was the refinement of the extraction of the derivatized analytes from the aqueous
15
Method to Determine Acrolein and Other Carbonyl Concentrations
PFBHA–sulfate–hydrogen peroxide solution. Previous research using similar PFBHA approaches (Spaulding et al. 2002) extracted the derivatized analytes with methyl-tertbutyl ether (MTBE). However, we wanted to refine the extraction procedure to improve analyte response and reduce instrument wear. Therefore, we tested different extraction solvents, the addition of salts, and adjustments to pH, to determine which approaches could improve upon the existing methodology. Previous research had demonstrated that MTBE was an efficient solvent for extracting PFBHA-oximes from an aqueous solution. However, the moderately polar nature of MTBE led to the extraction of a considerable amount of unreacted PFBHA and other polar species, which increased the background noise in the GC-MS chromatograms. Furthermore, injection of excess PFBHA onto the analytical column appeared to shorten the column’s lifetime. Therefore, we tested both MTBE and hexane, which is less likely to remove undesirable semipolar compounds, for their ability to extract the derivatized carbonyls from the bisulfite solution (n = 3 per solvent). The results showed that essentially hexane was as effective at extracting the derivatized carbonyls as MTBE (Figure 12), but hexane resulted in a much lower background of PFBHA reagent and other contaminants in the chromatograms (Figure 13). Therefore, we selected hexane as the preferred extraction solvent. Next, we investigated the addition of acid to the aqueous solution. Earlier methods had added acid to the aqueous PFBHA solution before extraction (Spaulding et al. 2002) to protonate the excess PFBHA and keep the ionized PFBHA in the aqueous phase and out of the sample extract. To test the effect of acid addition, three samples were prepared without acid and three more were prepared in the exact same fashion, but two drops of 18 M H2SO4 were added to the sample before extraction. The acid-treated samples had a cleaner extract, and in all cases the addition of acid improved extraction efficiency of the carbonyloximes (Figure 14). Therefore, we elected to continue to add acid before extraction of the derivatized analytes. Finally, we investigated the addition of salts to the solution. This is a classic analytical tool to improve the partitioning of semipolar compounds into a nonpolar phase by making the aqueous solution more ionic (and hence more polar). Three samples were prepared in the standard fashion, and three more were prepared in the same way except that sodium sulfate was added to saturate the sample with salt before extraction. The addition of salt in an effort to “saltout” the PFB-derivatives into hexane had negligible impacts on the amount of PFBHA-derivatized analytes extracted from the aqueous phase (Figure 15), probably because the
16
Figure 12. Comparison of PFBHA-carbonyl derivative extraction from bisulfite solutions with MTBE and hexane extraction solvents (n = 3). Error bars are ± 1 SD.
Figure 13. Comparison of contaminant peaks in a total ion current chromatogram for MTBE and hexane extraction solvents.
Figure 14. Effect of the addition of acid before extraction of the PFBHAderivatized carbonyls (n = 3). Error bars are ± 1 SD.
T.M. Cahill et al.
“normal” aqueous solution already consists of 0.1 M bisulfite and sulfate, so it is already highly ionic. Once the derivatives had been extracted and stored in anhydrous hexane, they appeared to be stable for extended periods of time. No losses were observed when derivatized and extracted acrolein (200 pg/µL) was stored at 4�C and analyzed twice monthly for 6 months (average = 200 ± 14 pg/µL, RSD = 7.0%, n = 12). Furthermore, the PFB-oximes for several common chemicals of interest, including acrolein, are sold commercially (Hayashi Pure Chemical Industries Ltd, Osaka, Japan), so the derivatives appear to be stable if they are stored properly. SELECTION OF INTERNAL STANDARDS In the analysis procedure we developed, two different types of standards are added to the samples, namely, the “internal standards” and the “injection standards” (Figure 16). The internal standard solution, containing acrolein-d4 and benzaldehyde-d6, was added to all samplers before sample collection and to all field blanks and calibration standards. Because the acrolein-d4 will also undergo derivatization in the analysis procedure, anything that affects the volatilization, derivatization, and extraction of acrolein should also affect the acrolein-d4 internal standard in the same fashion, thus accounting for these potential loss processes. The analytes were quantified using the isotope dilution approach in which the peak area of the analyte is divided by the peak area of the internal standard to obtain a relative response factor. The relative response factor is calculated for the calibration standards (see Appendix A for number of calibration points), and a linear “calibration curve” is fitted to the calibration standards such that the concentration of the standard is plotted
Figure 15. Effect of the addition of sodium sulfate to the aqueous phase before analyte extraction (n = 3). Error bars are ± 1 SD.
against the relative response factor. This calibration curve is then used to quantify the analytes. The analyte’s relative response factor is used to calculate its concentration in the solution. All analytes in this study were quantified using this isotope dilution approach. The acrolein-d4 was used as the internal standard to quantify the light unsaturated carbonyls (acrolein, methacrolein, methyl vinyl ketone, and crotonaldehyde). Carbonyls that lacked the reactive double bond appeared to have different chemistries with respect to stability in bisulfite, so we selected benzaldehyde-d6 as an internal standard for all compounds other than the volatile, unsaturated carbonyls. This compound is also less volatile than the 3-carbon and 4-carbon carbonyls, so it better represents the less volatile carbonyls. In this research, acrolein-d4 and benzaldehyde-d6 were used to quantify the analytes. In subsequent research, acetaldehyde-d4 was added to the internal standard mixture. The internal standards were used in the early stages of method development to normalize the instrumental response between different test samples (for example, see Figure 6). In these cases, the relative response factor, as calculated above, was used in preference to raw instrumental response because the relative response factor removes variability associated with instrumental drift
Figure 16. Timing of the addition of internal standards and injection standards to the sample.
17
Method to Determine Acrolein and Other Carbonyl Concentrations
(changes in absolute instrumental response over time due to changes in instrument conditions, such as cleanliness of the ion source, wear of the filament, etc.). However, this gives an effectively “unitless” measure of the difference in peak intensity of the analyte between two or more test conditions. SELECTION OF INJECTION STANDARDS The injection standard solution was added to the sample extract right before instrumental analysis. The compounds in this solution provided a backup quantification standard to use in normalizing instrumental response and sample extract volume. They were not used to quantify the analytes because they do not account for possible incomplete derivatization or “blow-off” (volatilization of analytes from the collection solution to the air stream) during sample collection, but were added as a quality control mechanism to ensure instrumental consistency between different analysis sets. Four criteria were used to select these injection standards: (1) they would not be found in ambient air samples; (2) they would give a strong ion for quantification in ECNI-MS; (3) they would have different elution times, so they would be spread throughout the chromatogram; and (4) they could be purchased commercially. Ultimately, we selected octafluoronaphthalene, 1,2,3tribromo-5-fluorobenzene, dibromonaphthalene, and hexabromobenzene as the injection standards, although the latter three chemicals were only added near the end of the project. The brominated compounds give strong and unique ions at m/z 79 and 81 for quantification. Octafluoronaphthalene also gave a strong ion at m/z 272 that was relatively unique in the chromatograms. Octafluoronaphthalene also eluted within 1.5 minutes of the PFB-derivatized acrolein, and thus it was representative of the instrumental conditions for the derivatized acrolein. Though the injection standards could be used for quantification, they would not account for losses of analytes during the collection, derivatization, and extraction steps of the analytical procedure. Therefore, using the injection standards for quantification would underestimate the actual concentrations of the analytes present. To illustrate this phenomenon, we calculated the ambient acrolein concentrations determined over a 3-day study in Roseville, California, in June 2006, which was conducted after the initial HEI review of the project, using both the acrolein-d4 internal standard and the octafluoronaphthalene injection standard. The results showed that the octafluoronaphthalene-based quantification gave concentrations that averaged 86% ± 18% (n = 70) of the concentrations determined by acrolein-d4-based quantification. The difference between the two quantification methods was due to the loss of some acrolein-d4 to volatilization
18
or degradation during sample collection. These samples retained an average of 79% ± 15% (n = 70) of the initial acrolein-d4 spike, which is fairly good given that the ambient temperatures routinely reached 38�C, with a relative humidity of 20% to 30%, during sampling. The use of the acrolein-d4 internal standard compensates for chemical loss and volatilization, but the octafluoronaphthalene injection standard cannot. The one application of the injection standards for quantification was to determine the amounts of the deuterated internal standards (acrolein-d4, benzaldehyde-d6, and acetaldehyde-d4) that were retained in the field samples. In this case, the internal standard peak area was divided by the peak area of the injection standard to give a relative response factor. This relative response calculation can be used to normalize instrumental response and extract volume, but it would not account for any losses of the internal standards during sample collection, derivatization, or extraction. These relative response factors were then compared with the calibration standards to determine the fraction of the internal standard added to the sample that was retained during sample collection. This procedure was only applied to the deuterated internal standard as a quality control measure and was not applied to any analytes. MIST CHAMBER COLLECTION EFFICIENCY OPTIMIZATION The next step in the analytical method development was to determine the minimum bisulfite concentration needed to trap the carbonyls in the mist chambers. First, it was necessary to determine whether derivatization was equally effective in different bisulfite solutions, because we could not test the trapping efficiency of the different solutions without establishing that varying the bisulfite concentration does not affect the derivatization. Four bisulfite solutions were tested, ranging from 0.001 M to 0.1 M, to determine differences in derivatization. Derivatization of the carbonyls in pure water was used for comparison. For each bisulfite solution, a 1:1 molar ratio of bisulfite to hydrogen peroxide was used to degrade the bisulfite. The solutions were allowed to derivatize for 24 hours before extraction. The results (Figure 17) showed that the initial concentration of bisulfite did not systematically affect derivatization so long as the bisulfite was converted to sulfate by hydrogen peroxide, and that derivatizations in the four different bisulfite solutions were comparable to derivatization in pure water. Therefore, we could test the effect of varying the bisulfite concentration in the mist chambers without affecting the derivatization yield.
T.M. Cahill et al.
The collection efficiency of the mist chambers was evaluated in separate experiments with different bisulfite concentrations to determine the most effective concentration for trapping the carbonyls. A Tedlar bag was filled with 200 L of zero-grade air (air that is free of total hydrocarbons) containing the carbonyls of interest. The contents of the bag were then drawn through two mist chambers in series, each containing 10 mL of the bisulfite solution being tested, at approximately 20 L/min for 10 minutes. The air flow rate was regulated by a calibrated Hastings mass flow controller. The concentrations of the analytes were determined in both mist chambers, and the collection efficiency per chamber was determined as Collection efficiency = 1 � ([Cchamber 2] / [Cchamber 1])
(11)
where Cchamber 1 and Cchamber 2 are the analyte concentrations in the first mist chamber and the second mist chamber, respectively. The value can be expressed as a fraction or percentage. The results showed that the collection efficiencies for glyoxal and methylglyoxal were independent of the bisulfite concentration, but the collection efficiencies for the unsaturated carbonyls, acrolein and methacrolein, were directly related to the bisulfite concentration (Figure 18). Furthermore, acrolein and methacrolein were not collected to any extent in the pure water solution. This result proves that a high concentration of bisulfite was necessary to effectively trap the more volatile compounds. Therefore, we selected 0.1 M bisulfite for the mist chamber collection solution. The collection efficiency of glyoxal and methylglyoxal reached a maximum of about 85% irrespective of the bisulfite concentration. This maximum collection efficiency
Figure 17. Influence of bisulfite concentration on derivatization of the test carbonyls when peroxide was added in amounts equimolar to the bisulfite (n = 3, except for water, which was n = 1). Error bars are ± 1 SD.
is limited by loss of collection solution from chamber 1 to chamber 2 during sampling. Although the mist chambers have baffles to collect the water droplets, some solution escapes these baffles and is transported to the next mist chamber. Therefore, two mist chambers were used in series in all future experiments to achieve a total collection efficiency of 97% for the water-soluble compounds. EVALUATION OF A WIDE RANGE OF CARBONYLS The research reported herein focused on only seven representative carbonyls: acrolein, methacrolein, methyl vinyl ketone, crotonaldehyde, glyoxal, methylglyoxal, and benzaldehyde. The efficacy of the method for determining concentrations of these carbonyls was evaluated by three approaches: namely, analyses of collection efficiency, spike recovery, and internal standard retention. Each of these approaches has advantages and disadvantages. To demonstrate the potential effectiveness of the method for determining the concentrations of gaseous carbonyls other than the seven listed above, we conducted a collection efficiency and mass balance test on a set of 57 common aldehydes and ketones (see Table 6). Unfortunately, this test was conducted after the field studies were completed; thus, the expanded compound list was not available for the field validation samples described later in this report. Two mist chambers were connected in series and operated at a flow rate of 19.7 L/min (Figure 19). The mist chambers were loaded with 10 mL of 0.1 M bisulfite that had been enriched with acrolein-d4, benzaldehyde-d6, and acetaldehyde-d4 according to the standard operating procedure presented in Appendix A. A glass elbow tube
Figure 18. Influence of bisulfite concentration on collection efficiency of carbonyls from the air stream (n = 3 each). Higher bisulfite concentrations were necessary to trap the more volatile carbonyls such as acrolein, while the less volatile compounds such as glyoxal were effectively collected regardless of the bisulfite concentration. Error bars are ± 1 SD.
19
Method to Determine Acrolein and Other Carbonyl Concentrations
This mass loading was higher than expected field sample values to ensure detectable concentrations of the analytes in the second mist chamber. We used an experimental setup that was different from the earlier Tedlar bag experiments to avoid the problem of some of the “spiking” chemicals, particularly ones with low vapor pressures, sticking to the inside of the Tedlar bag and not being quantitatively recovered from the bag. Although the earlier tests only needed a chemical-enriched air sample for the calculation of the collection efficiencies, the second round of validation experiments also used a mass balance approach that required quantitative recovery of the analytes from the entire system. Adsorption of low-volatility compounds presents a problem for quantitative recovery of analytes, so the experimental setup was modified to reduce the effects of adsorption.
Figure 19. Diagram of the experimental apparatus for spike recovery. The test chemicals were added to the spiking tube in 10 µL of acetonitrile. The chemicals were then volatilized into the air stream by 19.7 L/min of purified nitrogen gas and carried in the gas phase into the mist chambers.
(hereafter referred to as the “spiking tube”) was placed upstream of the first mist chamber where the analytes would be added to the system. The spiking tube was connected to a cylinder of 99.997% pure nitrogen that was further purified by passing through a charcoal trap. Therefore, the entire system was closed, from the nitrogen cylinder to the vacuum pump. The analyte spiking solution, prepared in acetonitrile, was added to the spiking tube, where the analytes would volatilize into the stream of nitrogen and enter the mist chambers in the gas phase, in a similar fashion as chemicals in ambient air samples. The experiments were conducted at room temperature, so heat was not added to help the analytes volatilize into the gas phase. The analyte spiking solution had a target concentration of approximately 100 ng/µL for each of the 57 analytes, and 10 µL of the solution was used for each analysis run. Therefore, the mass of each analyte added to the system was approximately 1 µg.
20
Two series of experiments were conducted in triplicate. The first was the standard 10-minute collection utilized in the analysis of ambient samples in this report. In this case, the spike was added to the experimental apparatus after 5 minutes, which is halfway through the sample collection. The second set of experiments utilized a 30-minute sample collection time. The spike was also added 5 minutes into the sample collection to be consistent with the first set of experiments. The longer sampling time would allow for greater loss of the chemical by volatilization; thus, these experiments were designed to demonstrate chemical loss as a function of sample collection time and to determine whether a longer sampling time would be feasible as a mechanism for improving sensitivity. Collection Efficiency The determination of collection efficiency is an approach that was described earlier in this report (see Mist Chamber Collection Efficiency Optimization) and was utilized in previous research (e.g., Spaulding et al. 2002). The chemical concentrations determined in the two mist chambers are used to calculate the chemical collection efficiency as a percentage or fraction. It is important to note that the collection efficiency calculation is a relative measure between the two mist chambers and is not related to the initial mass of chemical added to the spiking tube. One advantage of this approach is that it is not necessary to know the air concentration of the chemicals because the collection efficiency is a relative difference between the mass of chemical collected in the first and second chambers. This relative concentration approach can be applied to any sample for which the two mist chamber concentrations are determined separately, so the collection efficiency can be determined in the field under “real” sampling conditions. The disadvantage of this approach is that it is
T.M. Cahill et al.
vulnerable to systematic biases. For example, if half the chemical mass in each mist chamber is lost to wall adhesion, then the calculation will still give a high collection efficiency value because it is a relative measure between the two chambers.
added to the collection solution. This approach is not used to evaluate the ability of the mist chambers to remove chemicals from the air stream. Rather, the retention of the internal standards provides an effective measurement of any loss processes resulting from revolatilization, degradation, or sample handling.
Spike Recovery
The internal standards can be applied to every field sample, so this analysis requires no increase in the number of samples needed. The inherent assumption is that the deuterated internal standards will behave in the same fashion as the target analytes; therefore, any losses that affect the internal standard will also affect the analytes. If the majority of the internal standard is recovered, then it suggests that the majority of the analyte that enters the bisulfite solution should also be retained and that the method appears to be working well under field conditions. Conversely, if a large fraction of the internal standard is lost in a sample, then the analyte will likely be lost as well. This would indicate that there is a problem with the sample collection and analysis for a particular sample.
The spike-recovery approach is also called mass balance or mass recovery. In this case, the mass of the analytes was determined in each mist chamber separately, as well as in a bisulfite rinse of the spiking tube to determine the mass of chemical that never volatilized into the air stream. The total mass recovered from the mist chambers and spiking tube after the sample collection was then compared with the initial mass of chemical added to the spiking tube. Therefore, the spike recovery (%) was calculated as Spike recovery (%) = [(mchamber 1 + mchamber 2 + mspiking tube)/minitial] � 100 (12) where mchamber 1 and mchamber 2 are the mass recovered from mist chambers 1 and 2, respectively, mspiking tube is the mass recovered from the spiking tube (chemical that did not volatilize), and minitial is the mass of chemical initially added to the spiking tube. It should be noted that the bottom of the first mist chamber has glass surfaces where chemical could adsorb and be lost from the mass balance calculation. We anticipated this to be a minor problem except for the less volatile chemicals. Unlike the collection efficiency calculation, the spikerecovery calculation is an absolute calculation that is directly related to the initial amount of chemical present. This is a more rigorous approach to determining the effectiveness of the sampler in collection of carbonyls from the gas phase because it relates the collected mass to the known initial mass of chemical added to the system. The spike-recovery approach is a common method to assess the accuracy of analytical methods because chemical lost by any mechanism (volatilization, degradation, adsorption, incomplete derivatization, sample spillage, etc.) will appear as a low recovery. The disadvantage of this approach is that it cannot be applied during field sampling because one must have a known amount of chemical to start with. Internal Standard Retention Another approach to assessing the efficiency of the mist chamber method is to determine the retention of internal standards added to the collection medium before sample collection starts. The internal standards used were acrolein-d4, benzaldehyde-d6, and acetaldehyde-d4. Unlike the two previous approaches, the chemicals are directly
Because the analytes are quantified relative to these internal standards, the concentration data reported are “normalized” to these standards. Therefore, the retention of the internal standards affects the magnitude of the analyte concentration corrections necessary to account for using a relative response factor based on the internal standards. The greater the internal standard retention, the smaller the correction will be. To determine the retention of the internal standards, their peak areas are normalized to an injection standard, generally octafluoronaphthalene, to account for instrumental drift. This is the only application of the injection standards for quantification of chemicals. EVALUATION OF POSSIBLE INTERFERENCE FROM OZONE To address concerns about possible interference from ozone, we evaluated whether ozone could create either negative or positive artifacts in the analytical system. The question is whether ozone could degrade the carbonyls, and the unsaturated carbonyls in particular, resulting in lower concentration measurements. Conversely, ozone could create positive artifacts if it reacted with other compounds in the air being sampled to generate the carbonyls of interest. We expected the mist chamber methodology to be essentially immune to ozone effects because bisulfite is an effective ozone scrubber. The collection solution consists of 0.1 M bisulfite, so ozone is unlikely to persist in the solution for any appreciable time. Furthermore, the ozone present would be more likely to react with the high concentration of bisulfite than with the low concentrations of the analytes in the collection solution. Even though we did
21
Method to Determine Acrolein and Other Carbonyl Concentrations
not expect to observe ozone effects, we tested for both positive and negative artifacts arising from ozone.
FIELD SAMPLING
The degradation of the collected carbonyls by ozone in the air stream was tested by adding a known concentration of carbonyls to the mist chamber solution. Either zerograde air (control) or zero-grade air with ozone (100 ppb) was then passed through the mist chamber for 10 minutes at 20 L/min. Ozone was added to the air using an ozone generator (Jelight model 600, Jelight Co., Irvine, CA), and the ozone concentration was monitored continuously using an ozone monitor (Dasibi model 1008-AH, Dasibi Environmental Corp., Glendale, CA). In addition, a set of blanks was also prepared that simply consisted of the bisulfite solution without any carbonyls added. Three replicates were performed for each condition.
Peace Bridge in Buffalo
The next set of experiments determined whether the carbonyls could be generated from precursor compounds in the mist chamber. Positive artifacts can occur when ozone oxidizes precursor species present to produce carbonyls, thus creating artificially high concentrations of the carbonyls. We investigated two precursors, 1,3-butadiene and isoprene, as potential sources of carbonyls because they are considered to be the most abundant biogenic and anthropogenic substances that react in the atmosphere to produce various carbonyl species, including acrolein (from 1,3butadiene) and methyl vinyl ketone (from isoprene). Ambient levels of isoprene and 1,3-butadiene vary widely, so we utilized concentrations that were approximately 1000-fold higher than environmental levels to ensure that even minor carbonyl formation would be detected. The following concentrations were utilized: 1,3-Butadiene = 100 µg/200 L = 500 µg/m3 (ambient = 0.2 to 0.7 µg/m3 or 0.1 to 0.3 ppbv) Isoprene = 136 µg/200 L = 680 µg/m3 (ambient = 0.6 to 3.4 µg/m3 or 0.2 to 1.2 ppbv) The precursor compounds were added directly to the mist chamber collection solution, and then ozonated air (100 ppb) or zero-grade air was pulled through the mist chamber for 10 minutes at a flow rate of 20 L/min. This experiment has the same design as the experiment to test ozone degradation of the carbonyls, described above. The samples were derivatized for 24 hours and extracted with hexane. The concentrations of the carbonyls in the samples treated with ozone and those treated with zerograde air were compared. The concentrations of carbonyls in the ozone-treated precursor samples were also compared with the blank samples to determine if appreciable amounts of carbonyls were formed.
22
The ultimate objective of this research was to develop a new method to determine acrolein concentrations in air and then apply it to assess the exposure of a traffic-impacted population to acrolein. The HEI Research Committee suggested that the new analytical apparatus be located next to other sampling systems to assess the consistency and sensitivity of the different available analytical methods. The HEI air toxics hot spot study was already engaged in sampling for gaseous carbonyls at the Peace Bridge in Buffalo, to assess the influence of vehicular emissions on asthma rates in the surrounding areas. Therefore, we decided to conduct acrolein sampling alongside the existing research project in the summer of 2005. The goals of this sampling were, first, to assess the influence of traffic on acrolein concentrations and, second, to compare the mist chamber method with the two other methods that were being deployed to determine acrolein concentrations at the Peace Bridge. The other research groups were scheduled to collect samples at and around the Peace Bridge in July 2005. Although our group’s new analytical methods were functional by this time, they had not been fully optimized or field tested. Some minor refinements to the sample collection procedure were made after this study. Two sampling sites were selected to assess the impact of the Peace Bridge traffic on the local community (Figure 20). One was the “Chapel site” located at the corner of Busti Avenue and Rhode Island Street in downtown Buffalo, downwind (152.4 m to the northeast) of the Peace Bridge plaza. This was also one of the primary sampling sites for the other research groups investigating the impacts of traffic at the Peace Bridge plaza. The second site was the Great Lakes Research Center, which was chosen to represent the conditions upwind (0.8 km to the southwest) of the Peace Bridge plaza. We planned to sample upwind and downwind of the Peace Bridge plaza at the same time to assess the contribution of traffic to the local acrolein concentrations. Samples were collected on three days, namely July 25 through July 27, 2005. On July 25, duplicate samples were collected every hour at the Chapel site from 07:00 to 19:00 hours. Duplicate samples were collected to provide an estimate of method consistency under the same conditions. Samples were collected hourly in order to determine the temporal cycles of acrolein and other small carbonyls. The time range of 07:00 to 19:00 hours was selected to be consistent with the times utilized by Spengler’s group for their cartridge sample collection. On the other two sampling days, we split up the samplers, so one was at the upwind
T.M. Cahill et al.
Figure 20. Location of the two sampling sites near the Peace Bridge at Buffalo. The Great Lakes Research Center was the upwind site, while the Chapel site was downwind of the Peace Bridge plaza.
site and one at the downwind site. Samples were collected every-other hour from 07:00 to 19:00 hours. No duplicate samples were collected in this phase of the project. The sample collection procedure described in Appendix A was used with the following exceptions or modifications: meteorologic data were collected by Spengler’s research group, rather than by our equipment; one calibration curve was made midway through each sampling day at the Chapel site; two field blanks (one in the morning and one in the afternoon) and one reagent blank were prepared each sampling day at both sites; and the internal standard mixture was spiked into the bisulfite solution of the lower mist chamber between 10 and 30 minutes before the sampling event. At both sites, the mist chambers were placed on a folding table, with the air intake approximately 1 m off the ground. Line power was used, resulting in flow rates of 15.8 to 16.5 L/min for the two sets of mist chambers. After sample collection, the mist chamber solutions were stored in the reaction tubes in the dark, at ambient temperature, in a rigid plastic cooler. They were shipped by overnight delivery back to the laboratory at the University of California–Davis, and processed 96 hours after collection. The second objective of sampling at the Peace Bridge was to compare the newly developed mist chamber methodology
and other acrolein determination methods. Researchers from Spengler’s group collected a series of HMP-coated cartridge samples in accordance with OSHA Method 52. The cartridges, deployed at both the Chapel site and the Great Lakes Research Center site, collected ambient air from 07:00 to 19:00 hours. The cartridges were then shipped to Clayton Group Services for extraction and analyses of the samples. Thus, the analysis of these cartridges was completely independent of the other analytical results. Another method that was evaluated was the use of DNSH-based passive samplers obtained from Dr. Jim Zhang of Rutgers University (Herrington et al. 2005). Ten cartridges were deployed at the Chapel site alongside the HMP-coated cartridges and the mist chambers. Eight of the ten cartridges were uncapped on the first day. Two cartridges were never uncapped and hence served as blanks. On each of the following 4 days, two of the open cartridges were capped, thus providing cartridge samples representing 1, 2, 3, and 4 days of collection time. The capped cartridges were sent to Zhang for analysis. The results, reported as micrograms of acrolein per cartridge, were then converted into approximate air concentrations by estimating the effective sampling rate of the passive air sampler as reported elsewhere (Herrington et al. 2005).
23
Method to Determine Acrolein and Other Carbonyl Concentrations
Ambient Sampling in California Three sampling campaigns were conducted in California to validate the optimized analytical method under field conditions. In particular, the consistency of the method was evaluated by collecting a large number of samples over a short time period so that the ambient conditions under which the samples were obtained would be as similar as possible. The accuracy of the method was evaluated by the addition of acrolein-d4 and benzyaldehyde-d6 to the samples in the field; thus, any chemical loss during collection, derivatization, transport, and extraction would be detected. The general applicability of the method was tested by collecting samples from two background sites as well as a site impacted by vehicular emissions and other anthropogenic sources (Figure 21). The background sites were used to determine the accuracy, consistency, and sensitivity of the method when very little anthropogenic acrolein was present. These sites also provided measurements of the natural background of acrolein, serving as a baseline for exposure analysis. The urban site, near a busy roadway, was selected to test the method in a situation where the analysis might be confounded by the presence of vehicular and other anthropogenic pollutants. One background sampling site was at Salt Point along the northern California coast. This site was selected because the meteorologic conditions are dominated by the onshore flow of air from the North Pacific Ocean to the coastal mountains. Therefore, these samples should reflect the concentrations in the marine boundary layer at a hemispheric background level. The area also lacks any development of note, so there are no local anthropogenic sources of acrolein that could confound the analysis. A total of six samples were collected at Salt Point on August 25, 2005, on a bluff above the Pacific Ocean. The mist chamber collection was identical to that in the optimized methodology described in Appendix A. Two mist chamber apparatuses were set up adjacent to each other to collect duplicate samples. Samples were collected at three times in rapid succession from 12:00 to 14:00 hours to ensure the consistency of the ambient conditions. Each sample collection time was 10 minutes at a flow rate of 15.8 to 16.5 L/min. The collection apparatuses were powered by a deep cycle 12-V battery and a 300-W power inverter. A calibration curve was prepared in the field and stored alongside the samples to ensure that the derivatization conditions were equivalent for the samples and the calibration curve. This was achieved by bringing a vial containing a calibration solution (target concentration of 10 ng/µL) into the field. Then a volume of the calibration standard (1 to 100 µL) was added to a series of test tubes containing the bisulfite solution randomly selected from the bisulfite
24
Figure 21. Locations of the three field sampling sites in California. Gray arrows show the dominant surface wind directions for the summer (Hayes et al. 1984), indicating that the samples from the Salt Point site represent oceanic air and that Roseville is downwind of Sacramento.
used in sampling. Next, the internal standards of acroleind4 and benzaldehyde-d6 were added to the bisulfite solution. The test tubes were capped, shaken, and allowed to react for 10 minutes. After 10 minutes the solutions were poured into the reaction tubes to quench the bisulfite reaction and to derivatize the carbonyls. Five calibration solutions were prepared in this experiment. In addition, two field blanks and two reagent blanks were prepared at the site. The field blanks were prepared in the identical fashion as the test samples (the solution was spiked and poured into the mist chambers, then removed after 10 minutes, and the mist chamber was washed), but the vacuum pumps were not turned on. The field blanks are used to account for any contamination arising from sample handling in the field. The meteorologic conditions were ideal for sample collection. The wind was gusty and from the southwest, bringing oceanic air. The ambient temperature was between 18� and 24�C during sample collection. Unfortunately, relative humidity measurements were not available, but it was assumed to be high as there was a very thin fog before sampling commenced. The fog burned off to give sunny conditions during sample collection. Ozone measurements were not available at this site. The other background site was beside Juniper Lake in Lassen Volcanic National Park. This site was chosen because air pollution levels in the park are among the lowest recorded in the 48 contiguous United States (Malm et al. 1994). The sampling area, situated in a mixed conifer forest consisting of Abies and Pinus, was expected to have biogenic sources of carbonyls but few or no anthropogenic sources of carbonyls.
T.M. Cahill et al.
Nine samples were collected at Juniper Lake from 11:00 to 14:00 hours on September 5, 2005, using the optimized mist chamber methodology (see Appendix A). Triplicate mist chamber apparatuses were used to collect samples three times in rapid succession. Each sample collection time was 10 minutes at a flow rate of 15.8 to 16.5 L/min. The collection apparatuses were again powered by a deep cycle 12-V battery and a power inverter (Figure 22). Two reagent blanks and two field blanks were prepared in the field as before. The temperature ranged from 14� to 24�C during sample collection, while the relative humidity ranged from 35% to 51%, with the lower relative humidity occurring at the end of the sample collection time. The wind was from the west at 3 to 8 km/hr, and the skies were clear during sample collection. Ozone measurements were not available at this site. The last site was on North Sunrise Boulevard in Roseville, approximately 460 m from Interstate 80 and downwind of a major railroad depot. It is also typically downwind of the Sacramento metropolitan area (see Figure 21). This is not only a vehicle-impacted site downwind of a major metropolitan area, it is also one of the California ARB monitoring sites for numerous air toxics, including acrolein. The median 24-hour average acrolein concentration that the California ARB reported for samples obtained at the site using canisters according to EPA Method TO-15 was 985 ng/m3 in 2005 and 1240 ng/m3 in 2006 (with a reported MDL of 609 ng/m3 or 0.3 ppbv). Although the California ARB was not collecting samples at the same time as our sampling event, its database of reported values (Aerometric Data Analysis and Management System [ADAM] Air Toxics Summary; available at www.ARB.CA.gov/ADAM/ toxics) gives an indication of the concentrations we should expect at the site. The ozone concentrations during the sampling time ranged from 43 to 54 ppb. Six samples were collected in Roseville at two 10-minute time intervals between 13:00 and 14:00 hours on September 14, 2005, using triplicate samplers with flow rates of 15.8 to 16.5 L/min. Unlike the sampling at the other two sites, the pumps were powered by line power because it was readily available at the Roseville site. Two reagent blanks and two field blanks were prepared in the field. The temperature was between 29� and 32�C during sample collection, while the relative humidity was 34%. The wind was 19 km/hr from the southwest, which meant the site was directly downwind of Interstate 80 during sample collection. The reasonably high wind may have diluted concentrations of emissions from local sources. The skies were clear and sunny during sample collection. After each sampling event, the samples were returned to the laboratory, where they were allowed to derivatize in the dark for 4 days. The samples and standards were then extracted and analyzed according to the standard operating procedure described in Appendix A.
Figure 22. The sample collection system in place at Juniper Lake, Lassen Volcanic National Park. The collection system includes three sets of mist chambers (each with its own pump) to collect triplicate samples simultaneously. Each set consists of two mist chambers in series to determine collection efficiency in the field.
RESULTS OPTIMIZATION OF THE ANALYTICAL TECHNIQUE The majority of the research during the first year and a half of the study consisted of the development of a new analytical method for the determination of acrolein concentrations in the ambient environment. A mist chamber methodology was adopted because it allowed for the collection of large volumes of air in relatively short periods of time compared with cartridge-based sampling systems. However, there were several conditions that needed to be optimized to provide the most effective analytical method available. The results from the experiments to optimize these conditions have already been presented in the Methods section because the result from one experiment influenced the next experiment conducted. Therefore, only the final results are summarized here. The optimal analytical conditions proved to be as follows: (1) a bisulfite concentration of 0.1 M, (2) a very slight molar excess of hydrogen peroxide compared with bisulfite, (3) a PFBHA concentration of 1 mM, (4) a derivatization time of 1 to 4 days, (5) immediate sample derivatization in the field (with no storage time), and (6) the use of acetonitrile as solvent to obtain the best standard stability. The concentration of bisulfite was critical for the efficient collection and trapping of carbonyls from the gas phase. Lower bisulfite concentrations, as opposed to higher concentrations, resulted in poorer collection efficiencies for acrolein (see Figure 18).
25
Method to Determine Acrolein and Other Carbonyl Concentrations
Table 6. Collection Efficiency and Spike Recovery of the Mist Chamber Methodology for a Wide Range of Carbonyls 10-Minute Sampling Time (n = 3)
30-Minute Sampling Time (n = 3)
Collection Efficiency ± SD (%)
Spike Recovery ± SD (%)
Saturated Aldehydes Acetaldehyde Propanal Butanal Pentanal Hexanal Heptanal Octanal Nonanal Decanal 2-Methylpropanal 3-Methylbutanal
81 ± 2 74 ± 3 65 ± 10 71 ± 4 68 ± 6 73 ± 21 59 ± 10 59 ± 8 57 ± 12 61 ± 13 63 ± 12
151 ± 8 179 ± 24 109 ± 3 87 ± 4 101 ± 4 53 ± 6 53 ± 2 44 ± 2 41 ± 2 57 ± 1 72 ± 2
66 ± 1 62 ± 7 49 ± 13 48 ± 7 52 ± 4 47 ± 20 27 ± 4 36 ± 8 31 ± 7 43 ± 8 35 ± 11
118 ± 4 112 ± 7 73 ± 13 77 ± 3 91 ± 7 55 ± 17 42 ± 5 35 ± 4 32 ± 4 52 ± 2 61 ± 6
Unsaturated Aldehydes Acrolein Methacrolein Crotonaldehyde 2-Methyl-2-butenal 3-Methyl-2-butenal 2-Hexenal 2-Heptenal 4-Decenal 2,4-Hexadienal 2,4-Heptadienal
80 ± 3 65 ± 10 84 ± 4 62 ± 21 89 ± 1 77 ± 6 78 ± 15 84 ± 23 99 ± 1 99 ± 1
97 ± 1 31 ± 3 86 ± 4 9±3 83 ± 4 62 ± 3 47 ± 8 17 ± 3 7±2 11 ± 3
71 ± 2 77 ± 2 74 ± 4 73 ± 10 79 ± 2 68 ± 5 66 ± 5 80 ± 6 95 ± 3 97 ± 3
73 ± 5 6±2 54 ± 8