Development and Characterization of Polymorphic ESTSSR and Genomic SSR Markers for Tibetan Annual Wild Barley Mian Zhang1, Weihua Mao2, Guoping Zhang1, Feibo Wu1* 1 Department of Agronomy, College of Agriculture and Biotechnology, Zijingang Campus, Zhejiang University, Hangzhou, P.R. China, 2 Center of Analysis and Measurement, Zhejiang University, Hangzhou, P.R. China
Abstract Tibetan annual wild barley is rich in genetic variation. This study was aimed at the exploitation of new SSRs for the genetic diversity and phylogenetic analysis of wild barley by data mining. We developed 49 novel EST-SSRs and confirmed 20 genomic SSRs for 80 Tibetan annual wild barley and 16 cultivated barley accessions. A total of 213 alleles were generated from 69 loci with an average of 3.14 alleles per locus. The trimeric repeats were the most abundant motifs (40.82%) among the EST-SSRs, while the majority of the genomic SSRs were di-nuleotide repeats. The polymorphic information content (PIC) ranged from 0.08 to 0.75 with a mean of 0.46. Besides this, the expected heterozygosity (He) ranged from 0.0854 to 0.7842 with an average of 0.5279. Overall, the polymorphism of genomic SSRs was higher than that of EST-SSRs. Furthermore, the number of alleles and the PIC of wild barley were both higher than that of cultivated barley, being 3.12 vs 2.59 and 0.44 vs 0.37. Indicating more polymorphism existed in the Tibetan wild barley than in cultivated barley. The 96 accessions were divided into eight subpopulations based on 69 SSR markers, and the cultivated genotypes can be clearly separated from wild barleys. A total of 47 SSR-containing EST unigenes showed significant similarities to the known genes. These EST-SSR markers have potential for application in germplasm appraisal, genetic diversity and population structure analysis, facilitating marker-assisted breeding and crop improvement in barley. Citation: Zhang M, Mao W, Zhang G, Wu F (2014) Development and Characterization of Polymorphic EST-SSR and Genomic SSR Markers for Tibetan Annual Wild Barley. PLoS ONE 9(4): e94881. doi:10.1371/journal.pone.0094881 Editor: Xianlong Zhang, National Key Laboratory of Crop Genetic Improvement, China Received January 19, 2014; Accepted March 19, 2014; Published April 15, 2014 Copyright: ß 2014 Zhang et al. This is an open-access article distributed under the terms of the Creative Commons Attribution License, which permits unrestricted use, distribution, and reproduction in any medium, provided the original author and source are credited. Funding: The project was supported by National Natural Science Foundation of China (31171488), the National 863 Program (2012AA101105), and the Key Research Foundation of Science and Technology Department of Zhejiang Province of China (2012C12902-2). The funders had no role in study design, data collection and analysis, decision to publish, or preparation of the manuscript. Competing Interests: The authors have declared that no competing interests exist. * E-mail:
[email protected]
increasing sequence databases enables the identification of functional genes with similar sequences in related species [9]. EST-based SSR markers (EST-SSRs) have been widely employed as powerful molecular genetic tools in a large number of cereal crop species due to their high level of transferability, close association to genes with known function, codominant inheritance, and low cost for development with available development from public databases [10–12]. Jaikishan et al. [13] used 25 EST-SSRs and 25 genomic SSRs to predict grain yield heterosis; multiple EST-SSRs were generated for wheat (Triticum aestivum L.) and these markers showed high transferability between wheat and the other crops, such as barley, maize, rice, and sorghum [14–16]. Up to date, polymorphic EST-SSRs were identified to establish Hordeum chilense evolutional relationships [17] and new EST-SSRs and genomic SSRs were complemented to the published Australian barley genetic maps [18]. However, to our knowledge, little work has been performed to develop EST-SSRs and apply them for population structure in Tibetan wild barley. In the present study, with the objective of exploiting new SSRs from EST databases and confirming the published genomic SSRs in the Tibetan wild and cultivated barley accessions, 49 EST-SSRs and 20 genomic SSRs were developed and characterized. These markers can be utilized to evaluate the genetic variation and phylogenetic relationships of 96 barley genotypes. Furthermore,
Introduction Barley (Hordeum vulgare L.) is the fourth important cereal crop worldwide. With the rapid development of beer and feed industry, the demand for barley keeps increasing. However, during the longterm domestication of the cultivated barley, especially after the modern breeding and intensive cultivation, the genetic variation degraded significantly, resulting in missing lots of genes, including some rare alleles [1]. The monotonous genetic background of cultivated barley has become the bottleneck of the effectiveness of breeding, while the abundant diversity of wild barley can provide a pool of alleles for barley breeding and improvement [2,3]. Morphological, archaeological cytogenetic and isozyme data revealed that wild barley on the Qinghai-Tibet Plateau is different from the Fertile Crescent wild barley [4]. Researches so far have shown even rich genetic diversity in Tibetan wild barley than in Ethiopian barley [5]. Novel germplasm has been identified from the Tibetan wild barley tolerant to drought, salinity and aluminum toxicity [6–8]. Increasing efficient molecular markers would be valuable in diversity analyses, resource conservation and beneficial alleles exploitation for wild barley. Comprehensive sets of expressed sequence tags (ESTs) sequences have been generated in many plants (http://www.ncbi.nlm.nih.gov/dbEST). The availability of PLOS ONE | www.plosone.org
1
April 2014 | Volume 9 | Issue 4 | e94881
Novel EST-SSR Markers for Tibetan Wild Barley
Table 1. Characterization of 49 polymorphic EST-SSR makers in barley (Hordeum vulgareL.).
Primer
SSR motif
Primer sequence (59-39)
Expected size(bp)
Na
Ne
Ho
He
PIC
227
5
3.23
0.1979
0.6944
0.6379
260
4
3.26
0.6042
0.697
0.635
276
4
3.04
0.1053
0.6746
0.6232
215
3
2.95
0.2727
0.6649
0.5868
211
3
2.89
0.3542
0.657
0.5796
197
3
2.82
0.2188
0.6484
0.5735
140
3
2.57
0.1935
0.6141
0.5391
100
3
2.53
0.0104
0.6073
0.5362
233
3
2.6
0.0957
0.6187
0.5352
169
4
2.49
0.3511
0.6013
0.5344
273
3
2.46
0.25
0.5966
0.5266
251
3
2.4
0.0521
0.5867
0.5186
134
5
2.19
0.4545
0.5473
0.5127
287
4
2.25
0.3684
0.5587
0.4971
252
3
2.33
0.2083
0.5738
0.4898
245
3
2.18
0.2556
0.5439
0.4827
259
3
2.17
0.191
0.5431
0.478
265
3
2.22
0.1149
0.5533
0.4693
278
4
2.21
0.2083
0.5506
0.468
241
3
2.16
0.1684
0.5407
0.4626
259
3
2.07
0.1146
0.5206
0.4573
177
3
2.12
0.1146
0.5301
0.4507
111
4
2.01
0.2812
0.5047
0.4388
132
4
1.95
0.3077
0.4887
0.4256
F/R P181
(GAGAG)4
GTCGTCTCCCTCCCTTCA CATTGCCAGCACTGTTTC
P129
(GCC)7
CGAGGAGTTCGAGGTGGA ACTCTGCGTCCCAGTTCTT
P184
(TGC)9
CCTACCAAACAACGGAATA CAGCCAGAAGGTCTACGA
P50
(AATC)5
ACAAGCAGATCACCGACG AACCCGACTGAACAAATAAT
P91
(TC)13
CGAGGCTCCTCATCTCCT CCAGCATCGTCGCAAACT
P8
(AG)15
TCGTTGATCCGAACTTTACC CACCGCAGACGCTGAGTA
P29
(ATAC)13
CTGCTTAGTTCTAGGAGGCT CTCGGTTCGATTGTTCAT
P103
(CTG)9
P32
(GATG)6
CATTTGGCATTGGTTGAT AGTTCTTCTTCGCTGGAA GCAGAATGGCAGAAACAG CAAGAATGAGCGAAAGGT
P168
(TTC)7
TTCCTCCAGTCCTTCTCC CTGCTGCTACCGTTCTTAT
P99
(ATC)7
GATGTGATCTGATGCCATTT TTTCTTCGGTGTTCTTTCC
P152
(CT)11
ACCAAGCCCACGAGTAGCA CGACCCGAGGACGACAGAT
P144
(CT)11
CTTCGTTCCCTCCTCACC TCCGCTTCCACGATTGAC
P121
(TACAT)4
CCCAGGAATAAGAACAGACAC CACCGCCTAATAGCAACAA
P34
(CTTC)6
GGCGAGGAACTGTTGTTG GATCGGCTTCATCGTCTACT
P101
(ATC)12
CCCCGTATAAACCACCCA GGCAGAACTTCAGCACCC
P149
(AGC)9
P150
(GAGC)5
CTTGGCACGCTTTGTTTG ACTTTCCCACGGCATCAG TAAGTAGGTTTGAGGAAGGGAA CAACATAGACAAGGTGCTGGA
P83
(AAGAA)4
CTCGGCAAACAGAGGACA TTGTAGCAGCGGATGGTC
P30
(ATGT)12
ACTGCCACTCCATTTAGG CTGTCGTAGGCTTGCTTT
P63
(AGC)9
P90
(GAT)7
GGCTTGGCACGCTTTGTT TTTCCCACGGCATCAGTC CGCAAGCCACAGAGCACA TCCGTCCGTTCGTCCATC
P9
(AC)11
ATCACAAACAGCCACTGTCCTA GTGGTGAACCTTGCCCTTG
P3
(GA)10
GCGAGGATGATGTATAAACCG TGCATTCTGTGCCCTAACTAA
PLOS ONE | www.plosone.org
2
April 2014 | Volume 9 | Issue 4 | e94881
Novel EST-SSR Markers for Tibetan Wild Barley
Table 1. Cont.
Primer
SSR motif
Primer sequence (59-39)
Expected size(bp)
Na
Ne
Ho
He
PIC
229
3
2.08
0.1771
0.5219
0.413
264
3
1.78
0.0319
0.4419
0.3926
297
3
1.78
0.0632
0.4415
0.381
176
2
1.99
0.1875
0.5007
0.374
293
2
1.99
0.234
0.5006
0.374
284
2
1.97
0.5729
0.496
0.3717
217
2
1.97
0.2
0.4946
0.371
149
2
1.95
0.3229
0.4903
0.3688
260
2
1.94
0.2604
0.4869
0.367
245
2
1.93
0
0.4849
0.366
161
2
1.91
0.1739
0.479
0.3629
206
2
1.85
0.1383
0.4612
0.3535
287
2
1.83
0.4896
0.4568
0.3512
177
2
1.72
0.2604
0.4197
0.3303
209
2
1.7
0.1875
0.4154
0.3278
224
2
1.63
0.0968
0.3902
0.3128
298
2
1.63
0
0.3899
0.3126
256
3
1.44
0.069
0.3097
0.2853
235
2
1.47
0.1828
0.3204
0.2679
141
2
1.38
0.1333
0.2793
0.2392
201
2
1.38
0.0625
0.2792
0.2392
249
2
1.33
0.0106
0.2473
0.2157
245
2
1.23
0.0208
0.1876
0.1693
241
2
1.11
0.0417
0.0993
0.0939
F/R P45
(GGTT)5
CCCACAACACCAACAAAC GCCCGTAGAATGAACAAGTA
P55
(CTG)9
TTGATGGAGAAGGAGCAT ACATAGTAGGATAGATAGACCC
P105
(CCTCG)4
GCGACTACCAGGACGACAA CACCGACCGATACAGACAGA
P56
(CTG)7
AGTGATCTGAGGCGGTAT CGTACGTCCAATGTTGTC
P66
(CTCTT)4
CAAATGTGCCAGTAGAAA GGATGAGTTGCAGGTGAT
P67
(TTG)12
AGAAACAAACAGACAGACCCAT ATTCCACCACCGTCACCA
P180
(CAG)8
ATTCTCGCCGCCAACAACT CCACGTAGAAAGGGAGGGTCA
P80
(GGTTG)4
P57
(AATA)5
ACTCCTGCTGCTGCTGAC CGGTATTAGGCGACTCTTC ATAACAGCCGTTGATGAG GATCCGTTCCACAAACAT
P54
(ATC)7
CAGCACCACTACTAATCAAGAA GCCACCAACAAGACCTCC
P137
(GAAGA)4
AGAGGACAAGCCAAGGAAG CACGGAAACGGAACAAAA
P106
(CTG)8
CGAGCCGTTGCTTAGGTC TCTACTGCCAGGGCGTGA
P139
(GCAT)5
ACTCACATAGTAATCGAAGGG GGGCAAGAACGAATCTCC
P186
(CTGA)5
GGTAGTTCCGCCATCAGA CCTCCTGTGGACGAAGAT
P187
(GCACA)4
CTCGGACGACCATTTATT TTCAAAGTTCAAGGGTGC
P53
(CCAA)5
AGGGAAAGAAATCCTAAC TTGACTTGCTTATACACCT
P13
(AT)19
P16
(TG)11
CACATGCGTTAGTGTCCC GCGATTATCTTCGTCCAG CGAGCAGGCATAGCCATAT GACGCTGAGTACGTTGAGGT
P61
(GCA)8
CAAATGGAGCCAAGCAAC CCATCCTTGACGCACATC
P81
(CTG)8
GCAGGATAGGCGACACTC GAGACGGAGAAGGAGCAG
P185
(CGG)8
P120
(AGC)7
AAACGGCTTTCACATCTCCC CGCCCAAACAAGTCCTCC GAAATACTCCCAGGACAGC AGCAAGTGCCAGTTCTACC
P100
(CACG)6
CACATAAACAACCGAACCAA CGACATACGCAGGGAGTG
P21
(GAC)7
AACCTATGCCGCCTACTT CCACCCGTCCACTCTTTT
PLOS ONE | www.plosone.org
3
April 2014 | Volume 9 | Issue 4 | e94881
Novel EST-SSR Markers for Tibetan Wild Barley
Table 1. Cont.
Primer
SSR motif
Primer sequence (59-39)
Expected size(bp)
Na
Ne
Ho
He
PIC
165
2
1.09
0
0.0854
0.0813
F/R P44
(GCAA)5
AGTCCCGTAAACCTACCTGAG TGCCGGAGAATGTAATCG
Note: Na, number of alleles; Ne, number of effective alleles; Ho, observed heterozygosity; He, expected heterozygosity; PIC, polymorphic information content. doi:10.1371/journal.pone.0094881.t001
Materials and Methods
temperature. PCR products were diluted and tested on a MegaBACE 1000 DNA analysis system (Amersham Biosciences, Piscataway, NJ) at the Center of Analysis and Measurement in Zhejiang University. The lengths of PCR fragments were calculated using the ET550-R size standard and Genetic Profiler version 2.2.
Plant materials
Calculation of polymorphism
A total of 96 barley accessions were used in this study including 80 Tibetan annual wild barley from Qinghai-Tibet Plateau provided by Huazhong Agricultural University barley germplasm collection, and 16 cultivars from China which were stored at the Institute of Crop Science, Zhejiang University, Hangzhou, China (Table S1). These accessions were collected on public land. And no specific permits were required for the collection. Seeds were surface sterilized with 3% H2O2 for 30 minutes and thoroughly rinsed with distilled water, followed by germination in nutrient rich soil in an incubator (22/18uC, day/night) for 10 days. Total genomic DNA was extracted from barley leaves using the Plant Genomic DNA Kit (TianGen, Beijing, China).
The polymorphism of EST- and genomic SSR alleles were scored for the presence (1) and absence (0) for 96 accessions. Alleles with frequency less than 5% (rare alleles) in the population were removed and considered as missing data for the polymorphism calculation and population structure analysis [19]. The genetic diversity was evaluated by the number of alleles (Na), the effective number of alleles (Ne), observed heterozygosity (Ho), and expected heterozygosity (He) using POPGENE v.1.31 [20]. Polymorphism information content (PIC) was calculated by applying software PIC_CALC version 0.6.
polymorphism, and genetic diversity in the Tibetan wild barley accessions were evaluated which would be particularly useful for identification of novel genes with traits of interest, and markerassisted breeding in barley.
Population structure Population structure was assessed using the STRUCTURE software v2.3.3 based on the admixture model [21]. Models were tested for clusters (k) from 1 to 15, each with ten independent runs and 100,000 MCMC (Markov Chain Monte Carlo) iterations. The most likely number of clusters (k) was indicated by Dk, the change rate of the estimated log probability of the data (LnP[D]) [22].
Sequence screening and primer designing A total of 525999 barley ESTs were acquired from the EST database of GenBank (up to September 2012) (http://www.ncbi. nlm.nih.gov/Genbank/). Redundant sequences were removed from these ESTs using CD-HIT-EST (http://cd-hit.org) with the identity parameter of 95%. The presence of SSRs was screened using Simple Sequence Repeat Identification Tool (SSRIT) software (http://www.gramene.org/gramene/searches/ssrtool). The criteria for di-, tri-, tetra-, and penta-nucleotides were 10, 7, 5, and 4 repeat units, respectively. A total of 188 EST-SSRs were randomly selected and primers were designed using Primer5.0 with a length ranging from 18–22 bp, and product sizes of 100 to 300 bp. The reverse primers were marked with 6FAM or HEX fluorescent dye at 59 side for each pair. Based on the previous study of barley, 41 genomic SSR markers were selected and SSR primers were designed with the same criteria as mentioned above.
Gene function blast EST-SSRs associated unigene sequences were blasted against the GenBank non-redundant (nr) protein database using BLASTX (http://www.ncbi.nlm.nih.gov/BLAST) with an expected value (E-value) of 10210 for the function of polymorphic EST-SSRs.
Results Characterization of polymorphic SSRs In total, 69 SSR primer pairs, including 49 (26% out of 188) EST-SSRs and 20 (49% out of 41) genomic SSRs (Tables 1 and 2), showed polymorphism among 96 accessions. A total of 213 alleles were generated from 69 loci with an average of 3.14 alleles per locus. The ratio of the EST-SSR repeat motifs was not equally distributed. The di-, tri-, tetra-, and penta-nucleotides accounted for 16.32%, 40.82%, 26.53%, and 16.32%, respectively. Whilst most of the genomic SSRs selected were composed of dinucleotide repeats. According to the results of POPGENE for the 69 SSRs, the observed number of alleles per locus (Na) ranged from 2 to 6 (mean = 3.14) and the effective number of alleles per locus (Ne) varied from 1.09 to 4.54 (mean = 2.30). The average Na was 3.12 and 2.59 for wild and cultivated barley, respectively (Table 3). Besides this, the polymorphic information content (PIC) ranged
PCR amplification and sequencing PCR amplification was performed in a total of 20 mL reaction mixture that contained 1 mL of genomic DNA, 1 U ExTaq DNA polymerase (Takara Inc.), 2 mL of 106Ex Taq Buffer (Mg2+ Plus), 0.2 mM dNTPs mix, 0.05 mM forward primers, 0.1 mM reverse primers and fluorescent primers (FAM or HEX). The PCR protocol used was as follows: initial denaturation for 5 min at 94uC, followed by 5 cycles of denaturation for 30 s at 94uC, annealing for 30 s at 50uC, and extension for 30 s at 72uC, subsequently followed by 32 cycles of denaturation for 30 s at 94uC, annealing for 30 s at 55uC, extension for 30 s at 72uC, with a final extension for 10 min at 72uC and a 4uC holding PLOS ONE | www.plosone.org
4
April 2014 | Volume 9 | Issue 4 | e94881
Novel EST-SSR Markers for Tibetan Wild Barley
Table 2. Characterization of 20 genomic-SSR makers in barley.
Primer
SSR motif
Primer sequence (59-39)
Expected size (bp)
Na
Ne
Ho
He
PIC
182
6
4.54
0.022
0.7842
0.748
158
5
4.09
0.0526
0.7595
0.7162
107
5
3.9
0.0211
0.7474
0.7016
177
5
3.49
0.0833
0.7175
0.6776
131
5
3.35
0.0521
0.7049
0.6596
215
4
3.32
0.0326
0.703
0.6504
173
5
3.01
0.0909
0.672
0.6121
173
4
3.04
0.0549
0.6749
0.6106
136
4
2.79
0.0312
0.6455
0.5864
158
4
2.77
0.1889
0.6428
0.5845
169
5
2.73
0.5106
0.6376
0.5828
153
3
2.74
0
0.6384
0.5615
150
3
2.67
0
0.6284
0.5546
135
3
2.46
0.0316
0.5973
0.5292
124
4
2.19
0.0233
0.5464
0.5027
174
3
2.16
0.0319
0.5391
0.4749
149
3
2.18
0.0947
0.5437
0.4647
239
3
2.13
0.766
0.5324
0.4597
138
3
2.1
0.0316
0.5256
0.4547
177
3
1.63
0.0444
0.3899
0.3492
F/R S40
(AT)29
ACACCTTCCCAGGACAATCC CAGAGCACCGAAAAAGTCTGTA
S22
(GT)13,(AG)19
AAGCTCTTTCTTGTATTCGTG GTCCATACTCTTTAACATCCG
S18
(CT)28
CTGGGATTGGATCACTCTAA AAAACAAGTACTGAAAATAGGAGA
S7
(AC)20
ATAGATCACCAAGTGAACCAC GGTTATCACTGAGGCAAATAC
S37
(CT)18
CCGACAACATGCTATGAAGC CTGCAGCAAATACCCATGTG
S2
(AC)7T(CA)15 (AT)9
CCATCAAAGTCCGGCTAG GTCGGGCCTCATACTGAC
S11
(AG)15
TCCATGATGATGTGTGCATAGA CGGATCCCAACAAACACAC
S4
(AT)6(AC)16
S41
(TG)8
GCTATGGCGTACTATGTATGGTTG TCACGATGAGGTATGATCAAAGA AGTATGGGGAATTTATTTGG GCTGCAAAGTATGACAATATG
S25
(CT)24
TTTGTGACATCTCAAGAACAC TGACAAACAAATAATCACAGG
S38
(GA)17(GA)7
CTATCACACGACGCAACATG CCTGAGAAAGAAAGCGCAAC
S30
(GC)5GGG (GT)16
CAAATCAATCAAGAGGCC TTTGAAGTGAGACATTTCCA
S21
(AG)7C(AG)30-(AG)6
GGGAACTTGCTAATGAAGAG AATGTAAGGGAGTGTCCATAG
S19
(AG)19
CCCTAGCCTTCCTTGAAG TTACTCAGCAATGGCACTAG
S29
(GT)16
AGAATCAAGATCGACCAAAC AAAAACATGAACCGATGAA
S15
(CT)16
ATTCATCGATCTTGTATTAGTCC ACATCATGTCGATCAAAGC
S31
(CT)21
S36
(CA)9
CTATTTTCTAATGCTTGGACC TGTCTAGTTCATCATCATTGC GGATTTTCTCAAGAACACTT GCGTGAGTGCATAACATT
S1
(AC)11
GTCCTTTACGCATGAACCGT ACATACGCCAGACTCGTGTG
S8
(AC)13(AT)9
GCTCTCTCTCAGAAAAATGAA GAATTATTCTAGGGCTGTGAA
doi:10.1371/journal.pone.0094881.t002
from 0.08 to 0.75 with a mean of 0.46, and the PIC of wild barley was higher than that of cultivars with 0.44 vs 0.37. The expected heterozygosity (He) ranged from 0.0854 to 0.7842 with an average of 0.5279, while the observed heterozygosity (Ho) ranged from 0 to 0.766 with an average of 0.1677. As an indicator of genetic diversity, the average He was 0.5098 in wild barley accessions and 0.4333 in cultivated accessions.
PLOS ONE | www.plosone.org
Gene functions of the 49 unigene sequences containing polymorphic EST-SSRs Functions of the 49 polymorphic EST-SSRs were determined and 47 unigenes showed significant similarities to the known genes (Table 4), for instance, zinc finger protein MAGPIE, transcription factor LAF1, photosystem II reaction center PSB28 protein, xyloglucan endotransglycosylase (XET), and protein kinase 5
April 2014 | Volume 9 | Issue 4 | e94881
Novel EST-SSR Markers for Tibetan Wild Barley
Table 3. Polymorphism of SSR makers in Tibetan wild and cultivated barley.
No. of alleles
PIC
He
No. of alleles
PIC
He
Marker
Wild
Cultivated Wild
Cultivated Wild
Cultivated Marker
Wild
Cultivated Wild
Cultivated Wild
Cultivated
P3
4
2
0.450
0.156
0.5259
0.1754
P129
4
4
0.581
0.658
0.6544
0.7359
P8
3
3
0.582
0.482
0.6597
0.5565
P137
2
1
0.374
0
0.5019
0
P9
4
2
0.467
0.110
0.5454
0.1210
P139
2
2
0.332
0.366
0.4226
0.4980
P13
2
2
0.271
0.371
0.3251
0.5081
P144
5
2
0.523
0.346
0.5553
0.4598
P16
3
3
0.256
0.375
0.2757
0.4456
P149
3
2
0.495
0.332
0.5609
0.4345
P21
2
1
0.110
0
0.1179
0
P150
3
3
0.460
0.456
0.5357
0.5701
P29
3
3
0.484
0.520
0.5637
0.6048
P152
3
3
0.442
0.450
0.5048
0.5222
P30
3
3
0.431
0.398
0.4908
0.4758
P168
4
2
0.571
0.258
0.6388
0.3145
P32
3
2
0.542
0.315
0.6201
0.4046
P180
2
1
0.374
0
0.5019
0
P34
3
2
0.507
0.366
0.5878
0.4980
P181
4
3
0.618
0.478
0.6731
0.5544
P44
2
2
0.075
0.110
0.0783
0.1210
P184
4
3
0.567
0.468
0.6177
0.5484
P45
3
3
0.365
0.294
0.4623
0.3306
P185
2
2
0.229
0.283
0.2653
0.3528
P50
3
2
0.545
0.305
0.6285
0.3871
P186
2
2
0.345
0.195
0.4458
0.2258
P53
2
2
0.288
0.374
0.3503
0.5149
P187
2
2
0.347
0.110
0.4500
0.1210
P54
2
2
0.372
0.258
0.4981
0.3145
S1
3
2
0.488
0.195
0.5651
0.2258
P55
3
2
0.382
0.359
0.4237
0.4839
S2
4
3
0.655
0.440
0.7106
0.5425
P56
2
2
0.371
0.359
0.4953
0.4839
S4
4
3
0.615
0.561
0.6740
0.6587
P57
2
2
0.347
0.283
0.4500
0.3528
S7
4
2
0.583
0.359
0.6318
0.4839
P61
2
2
0.280
0.195
0.3389
0.2258
S8
3
3
0.275
0.528
0.2988
0.6323
P63
3
2
0.475
0.323
0.5386
0.4173
S11
5
3
0.640
0.327
0.6996
0.3730
P66
2
2
0.364
0.258
0.4821
0.3145
S15
3
3
0.428
0.563
0.4927
0.6621
P67
2
2
0.375
0.305
0.5024
0.3871
S18
5
4
0.704
0.592
0.7511
0.6694
P80
2
2
0.372
0.323
0.4981
0.4173
S19
3
3
0.457
0.412
0.5197
0.4966
P81
2
2
0.248
0.195
0.2916
0.2258
S21
3
3
0.521
0.460
0.5902
0.5652
P83
4
3
0.473
0.438
0.5550
0.5423
S22
5
5
0.683
0.687
0.7344
0.7581
P90
3
3
0.378
0.544
0.4479
0.6371
S25
4
4
0.560
0.515
0.6307
0.6000
P91
3
3
0.587
0.327
0.6650
0.3730
S29
4
4
0.429
0.607
0.4713
0.7059
P99
3
2
0.549
0.305
0.6223
0.3871
S30
3
3
0.528
0.354
0.5985
0.4113
P100
2
2
0.110
0.337
0.1179
0.4435
S31
3
2
0.499
0.110
0.5846
0.1210
P101
3
2
0.499
0.315
0.5637
0.4046
S36
3
3
0.423
0.548
0.5021
0.6414
P103
3
2
0.470
0.371
0.5252
0.5081
S37
5
3
0.584
0.555
0.6318
0.6452
P105
3
2
0.380
0.195
0.4634
0.2258
S38
5
4
0.510
0.626
0.5732
0.7011
P106
2
2
0.329
0.349
0.4185
0.4657
S40
5
3
0.694
0.363
0.7422
0.4203
P120
2
2
0.159
0.359
0.1749
0.4839
S41
4
4
0.530
0.483
0.5809
0.5565
P121
4
3
0.485
0.367
0.5584
0.4529 Average
3.12
2.59
0.441
0.373
0.5098
0.4333
doi:10.1371/journal.pone.0094881.t003
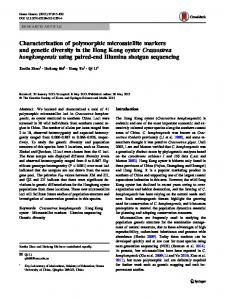
each accession assigned to a subpopulation was shown in Table S1. If the threshold of frequency was set at 0.5, only six accessions were defined as admixed. However, about 80% of the accessions can be derived from the subpopulations when the threshold was at 0.7. The output of structure analysis demonstrated that wild and cultivated barleys were assigned to different subpopulations (Figure 1B). Most of the cultivated barleys were classified into the subpopulation 4, except for A74, Tadmor, B1342 and B1031. Fifty percent of the wild barley accessions studied were assigned to subpopulation 1. According to the values of genetic distance of the eight subpopulations, we get the dendrogram showing the genetic
APK1B. In addition, the results revealed that the most annotated proteins were from Triticum urartu (17, 36.2%), and the species Hordeum vulgare and Aegilops tauschii accounted for the same percentage (11, 23.4%).
Population structure and genetic distance To detect the population structure in the 96 barley genotypes, we performed STRUCTURE program for Bayesian clustering analysis using 69 SSR markers, assuming that the number of populations (K) ranged from 1 to 15. The highest log likelihood score (Dk) was at K = 8 (Figure 1A), indicating that the most suitable number of subpopulations was eight. The frequency of
PLOS ONE | www.plosone.org
6
April 2014 | Volume 9 | Issue 4 | e94881
Novel EST-SSR Markers for Tibetan Wild Barley
Table 4. The putative proteins identified by BLASTX of 49 unigene sequences containing polymorphic EST-SSRs.
Primer
Accession No.
Putative protein
Organism
E-value
P181
CA032876.1
Hypothetical protein TRIUR3_30088
Triticum urartu
4.00E-51
P129
CV063130.1
Putative SKP1 protein
T.aestivum
1.00E-77
P184
CB858539.1
Hypothetical protein TRIUR3_19075
T.urartu
1.00E-46
P50
DN178534.1
UCW116, putative lipase
H. vulgare subsp. vulgare
3.00E-125
P91
FD524685.1
Putative syntaxin-131
Aegilops tauschii
1.00E-93
P8
AL506646.1
Zinc finger protein MAGPIE
T.urartu
4.00E-41
P29
AV943994.1
RNA polymerase sigma factor rpoD
T.urartu
7.00E-116
P103
CA009356.1
GID1-like gibberellin receptor
H. vulgare subsp. vulgare
4.00E-04
P32
EX593207.1
Disease resistance protein RGA2
Aegilops tauschii
8.70E-02
P168
BU997138.1
Hypothetical protein TRIUR3_09517
T.urartu
1.00E-04
P99
GH218162.1
Two-component response regulator ARR9
T.urartu
2.00E-64
P152
AV938130.1
Predicted protein
H. vulgare subsp. vulgare
1.10E-01
P144
EX598444.1
No hit
-
-
P121
CK569829.1
ACC oxidase
H. vulgare
9.00E-74
P34
DN186304.1
Predicted: UDP-glucose 6-dehydrogenase-like
Brachypodium distachyon
5.00E-65
P101
GH223749.1
FT-like protein
H. vulgare subsp. vulgare
1.00E-45
P149
EX583185.1
Condensin-2 complex subunit G2
T.urartu
5.00E-54
P150
FD519288.1
Curcuminoid synthase
T.urartu
5.00E-59
P83
FD527549.1
Putative pectinesterase 53
Aegilops tauschii
1.00E-76
P30
DN177250.1
Hypothetical protein F775_31773
Aegilops tauschii
1.00E-05
P63
EX577085.1
Condensin-2 complex subunit G2
T.urartu
6.00E-69
P90
FD528427.1
Photosystem II reaction center PSB28 protein
T.urartu
2.00E-83
P9
AL505258.1
Hypothetical protein f775_27232
Aegilops tauschii
6.00E-113
P3
BJ547928.1
Hypothetical protein TRIUR3_27885
T.urartu
1.00E-113
P45
FD523777.1
Hypothetical protein OsI_14737
Oryza sativa Indica Group
3.00E-50
P55
AL505545.1
No hit
-
-
P105
CA014373.1
Eukaryotic translation initiation factor 1A
Leymus chinensis
5.00E-72
P56
EX584572.1
Hypothetical protein F775_08651
Aegilops tauschii
2.00E-37
P66
FD518055.1
Predicted: protein LOC100843116
B.distachyon
5.00E-51
P67
FD520223.1
Hypothetical protein TRIUR3_27901
T.urartu
8.00E-36
P180
CA030489.1
Hypothetical protein TRIUR3_23016
T.urartu
4.00E-73
P80
FD523499.1
Casein kinase I-2-like protein
A.tauschii
1.00E-75
P57
EX599270.1
Hypothetical protein ZEAMMB73_419738
Zea mays
7.00E-56
P54
AL500476.1
PM2
H. vulgare subsp. vulgare
5.00E-67
P137
DN180922.1
PREDICTED: protein LOC100846358
B.distachyon
2.00E-02
P106
CA031374.1
OSJNBa0074L08.11
Oryza sativa Japonica Group
1.00E-46
P139
AL501810.1
GDSL esterase/lipase
A.tauschii
3.00E-40
P186
CB864664.1
Protein kinase APK1B, chloroplastic
A.tauschii
4.00E-50
P187
CB864737.1
Inactive ubiquitin carboxyl-terminal hydrolase 54
T.urartu
1.00E-17
P53
EH090859.1
TBC1 domain family member 15
A.tauschii
2.00E-57
P13
CK569261.1
Hypothetical protein TRIUR3_25268
T.urartu
3.50E-01
P16
CB873886.1
Phospholipid transfer protein precursor
H. vulgare subsp. vulgare
2.00E-43
P61
EX573461.1
Predicted protein
H. vulgare subsp. vulgare
6.00E-60
P81
FD521065.1
Predicted protein
H. vulgare subsp. vulgare
1.00E-81
P185
CB860073.1
Peptide transporter PTR2
A.tauschii
5.00E-60
P120
CK569159.1
Xyloglucan endotransglycosylase (XET)
H. vulgare subsp. vulgare
5.00E-69
P100
GH216950.1
Rho GDP-dissociation inhibitor 1
T.urartu
7.00E-69
P21
CK122115.1
Predicted protein
H. vulgare subsp. vulgare
5.00E-116
P44
CV063055.1
Transcription factor LAF1
T.urartu
3.00E-70
doi:10.1371/journal.pone.0094881.t004
PLOS ONE | www.plosone.org
7
April 2014 | Volume 9 | Issue 4 | e94881
Novel EST-SSR Markers for Tibetan Wild Barley
Figure 1. Dk and population structure. Estimation of the likelihood of clusters (k) for the most appropriate subpopulations (Dk) (A), and the population structure of 96 barley accessions in k = 8 clusters (B). doi:10.1371/journal.pone.0094881.g001
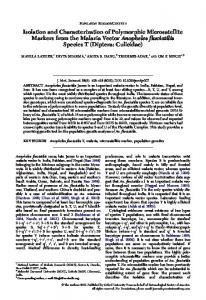
relationship of the subpopulations via UPGMA clustering analysis (Figure 2). The dendrogram showed that the subpopulation 3 was most close to the cultivated barleys (subpopulation 4) with the genetic distance of 132.188. The subpopulation 7 had the largest genetic distance (165.167) with the cultivated subpopulation.
associated with the target traits [23]. The simple sequence repeats (SSRs) are increasingly important due to their high polymorphism and convenient techniques. However, EST-SSRs are superior to genomic SSRs for their transcriptional sequence and suitable application in cross-species [24]. In the present study, we developed 49 EST-SSR and 20 genomic SSR markers for wild barley. These novel EST-derived markers will be a valuable resource for tagging and mapping of genes related to agronomic and stress-resistant traits of interest. In addition, these markers are advantageous for identifying functional diversity of unique adaptive germplasm because of their genic function. In many plants, the di- and tri-nucleotides repeat motifs were the major types, but the predominant motifs were different in various species [25,26]. In our research, the tri-meric repeats were the most abundant motifs (40.82%), followed by the tetra-meric repeats accounted for 26.53%, and the di-meric and penta-meric repeat motifs were at the same frequency (16.32%).The polymorphism of SSRs can be divided into three degrees: high (PIC.0.5), medium (0.5.PIC.0.25) or low (PIC,0.25) [27]. In our study, the genetic diversity of genomic SSRs was higher than the ESTSSRs, with the mean PIC value of 0.57 (high) and 0.41 (medium), respectively, resulting in the general medium polymorphism (mean = 0.46). This finding was in line with previous results, and the lower level of polymorphism of EST-SSRs might be due to the selection against the variation in the conserved regions of the ESTSSRs [28]. Moreover, the expected levels of heterozygosity at EST-SSRs were also not as high as that of genomic SSRs, ranging from 0.0854 to 0.697 vs 0.3899 to 0.7842. Pompanon et al. [29] contributed the deficiency of heterozygosity to the primer problems, the deletion of alleles and appearance of invalid alleles at the annealing points. Studies of the genetic variation in barley suggested that Tibetan wild barley showed higher polymorphism than cultivated barley [30–32]. The results of our study were consistent with the previous studies. The number of alleles and the PIC of wild barley were
Discussion In recent years, different kinds of molecular markers have been used widely, including marker-assisted breeding, study of genetic relationships between populations, and screening candidate genes
Figure 2. The dendrogram of the eight subpopulations according to the genetic distance using UPGMA clustering analysis. doi:10.1371/journal.pone.0094881.g002
PLOS ONE | www.plosone.org
8
April 2014 | Volume 9 | Issue 4 | e94881
Novel EST-SSR Markers for Tibetan Wild Barley
both higher than that of cultivated barley, being 3.12 vs 2.59 and 0.44 vs 0.37. The expected heterozygosity (He) showed the same trend, with 0.5098 and 0.4333 for wild and cultivated barley, respectively. The richness of genetic diversity in Tibetan wild barley may be the source of novel genes contributing to the tolerance of biotic and abiotic stresses, which is important in the barley breeding. BLASTX analysis indicated that 47 (96%) of the 49 unigenes containing EST-SSRs can be matched to at least one important proteins in the NCBI nr protein database. For futher study, we can search the candidate genes of interest via association analysis referring to the function of markers in the metabolism pathways. Furthermore, these EST-SSR markers can be utilized as affirmative markers for comparative studies in the related species, for example, Triticum urartu and Aegilops tauschii. In the present investigation, the findings of population structure analysis demonstrated that the developed EST-SSRs and genomic SSRs could distinguish between the cultivated and wild barley genotypes clearly. The 96 genotypes were divided to eight subpopulations. The subpopulation 3 (XZ161, XZ163, XZ165, XZ168) was most closely related to the cultivated barley (subpopulation 4), and the subpopulation 7 (XZ120, XZ151, XZ153) and the cultivated barleys were two most genetically distant populations. The genetic relation of the subpopulations suggested that the subpopulation 3 contained the most domesticated genotypes among the studied wild barley. Futhermore, the other subpopulations of wild barley, especially subpopulation 7, may be the important germplasm resource for the improvement of cultivars tolerant of abiotic and biotic stresses. These results were consistent with recent clustering studies in the Tibetan wild barley
genotype using DArT markers and SNPs[3]. This indicates that the cluster analysis using EST-SSR and SSR markers is an effective way to determine the structure of populations and can constitute a solid foundation for the genetic variation study.
Conclusion The 49 novel EST-SSRs and 20 genomic SSR markers developed from 96 barley genotypes were highly polymorphic and could be employed to examine genetic diversity, evolution, linkage mapping, comparative genomics, and population structure. The Tibetan wild barley showed higher genetic variation than cultivated barley, and the cultivated subpopulation could be separated from the wild barley clearly. For further studies, these developed markers could be useful in identifying trait-marker association of interest in the marker-assisted breeding programs in barley.
Supporting Information Table S1 List of 96 genotypes used in this study and their inferred subpopulations with k = 8. (DOCX)
Author Contributions Conceived and designed the experiments: FBW MZ. Performed the experiments: MZ. Analyzed the data: MZ WHM. Contributed reagents/ materials/analysis tools: FBW GPZ WHM. Wrote the paper: MZ FBW GPZ WHM.
References 15. Tang J, Gao L, Cao Y, Jia J (2006) Homologous analysis of SSR-ESTs and transferability of wheat SSR-EST markers across barley, rice and maize. Euphytica 151: 87–93. 16. Li L, Wang J, Guo Y, Jiang F, Xu Y (2008) Development of SSR markers from ESTs of gramineous species and their chromosome location on wheat. Prog Nat Sci 18: 1485–1490. 17. Castillo A, Budak H, Varshney RK, Dorado G, Graner A (2008) Transferability and polymorphism of barley EST-SSR markers used for phylogenetic analysis in Hordeum chilense. BMC Plant Biol 8: 97. 18. Willsmore KL, Eckermann P, Varshney RK, Graner A, Langridge P (2006) New eSSR and gSSR markers added to Australian barley maps. Crop Pasture Sci 57: 953–959. 19. Breseghello F, Sorrells ME (2006) Association mapping of kernel size and milling in wheat (Triticum aestivum L.) cultivars. Genetics 172:1165–1177. 20. Yeh FC, Yand RC, Boyle T (1999) POPGENE (Version 1.31): Microsoft Window-bases freeware for population genetic analysis, University of Alberta and the Centre for International Forestry Research. 21. Pritchard JK, Stephens M, Donnelly P (2000) Inference of population structure using multilocus genotype data. Genetics 155: 945–959. 22. Evanno G, Regnaut S, Goudet J (2005) Detecting the number of clusters of individuals using the software STRUCTURE: a simulation study. Mol Ecol 14: 2611–2620. 23. Gupta PK, Rustgi S (2004) Molecular markers from the transcribed/expressed region of the genome in higher plants. Funct Integr Genomics 4: 139–162. 24. Mian MA, Saha MC, Hopskins AA, Wang ZY (2005) Use of tall fescue ESTSSR markers in phylogenetic analysis of cool-season for age grasses. Genome 48: 637–647. 25. Varshney RK, Thiel T, Stein N, Langridge P, Graner A (2002) In silico analysis on frequency and distribution of microsatellites in ESTs of some cereal species. Cell Mol Biol Lett 7:537–546. 26. Kumpatla SP, Mukhopadhyay S (2005) Mining and survey of simple sequence repeats in expressed sequence tags of dicotyledonous species. Genome 48:985– 998. 27. Xie WG, Zhang XQ, Cai HW, Liu W, Peng Y (2010) Genetic diversity analysis and transferability of cereal EST-SSR markers to orchardgrass (Dactylis glomerata L.). Biochem Syst Ecol 38: 740–749. 28. Scott KD, Eggler P, Seaton G, Rossetto M, Ablett EM, et al. (2000) Analysis of SSRs derived from grape ESTs. Theor Appl Genet 100:723–726. 29. Pompanon F, Bonin A, Bellemain E, Taberlet P (2005) Genotyping errors: causes, consequences and solutions. Nat Rev Genet 6:847–859.
1. Russell J, Booth A, Fuller J, Harrower B, Hedley P, et al. (2004) A comparison of sequence-based polymorphism and haplotype content in transcribed and anonymous regions of the barley genome. Genome 47:389–398. 2. Nevo E, Apelbaum-Elkaher I, Garty J, Beiles A (1997) Natural selection causes microscale allozyme diversity in wild barley and lichen at ‘Evolution Canyon’ Mt Carmel Israel. Heredity 78: 373–382. 3. Dai F, Nevo E, Wu DZ, Comadran J, Zhou MX, et al. (2012) Tibet is one of the centers of domestication of cultivated barley. Proc Natl Acad Sci USA 109: 16969–16973. 4. Ren XF, Nevo E, Sun DF, Sun GL (2013) Tibet as a Potential Domestication Center of Cultivated Barley of China. PloS One 8: e62700. 5. Zhang QF, Dai XK (1992) Comparative assessment of genetic variation at 6 isozyme loci in barley from two centers of diversity: Ethiopia and Tibet. Acta Genet Sin 19: 236–243. 6. Zhao J, Sun HY, Dai HX, Zhang GP, Wu FB (2010) Difference in response to drought stress among Tibet wild barley genotypes. Euphytica 172: 395–403. 7. Dai HX, Shan WN, Zhao J, Zhang GP, Li CD, et al. (2011) Difference in response to aluminum stress among Tibetan wild barley genotypes. J Plant Nutr Soil Sc 174: 952–960. 8. Wu DZ, Qiu L, Xu LL, Ye LZ, Chen MX, et al. (2011) Genetic variation of HvCBF genes and their association with salinity tolerance in Tibetan annual wild barley. PloS One 6: e22938. 9. Michalek W, Weschke W, Pleissner KP, Graner A (2002) EST analysis in barley defines a unigene set comprising 4,000 genes. Theor Appl Genet 104:97–103. 10. Varshney RK, Graner A, Sorrells ME (2005) Genic microsatellite markers in plants: features and applications. Trends Biotechnol 23: 48–55. 11. Zeng SH, Xiao G, Guo J, Fei ZJ, Xu YQ, et al. (2010) Development of a EST dataset and characterization of EST-SSRs in a traditional Chinese medicinal plant, Epimedium sagittatum (Sieb. Et Zucc.) maxim. BMC Genomics 11: 94–104. 12. Li M, Zhu L, Zhou CY, Lin L, Fan YJ, et al. (2012) Development and characterization of EST-SSR markers from Scapharca broughtonii and their transferability in Scapharca subcrenata and Tegillarca granosa. Molecules 17: 10716– 10723. 13. Jaikishan I, Rajendrakumar P, Ramesha MS, Viraktamath BC, Balachandran SM, et al. (2010) Prediction of heterosis for grain yield in rice using ‘key’ informative EST-SSR markers. Plant Breeding 129: 108–111. 14. Mohan A, Goyal A, Singh R, Balyan HS, Gupta PK (2006) Physical mapping of wheat and rye expressed sequence tag-simple sequence repeats on wheat chromosomes. Crop Sci 47(S_1): S3–S13.
PLOS ONE | www.plosone.org
9
April 2014 | Volume 9 | Issue 4 | e94881
Novel EST-SSR Markers for Tibetan Wild Barley
30. Ellis RP, Forster BP, Robinson D, Handley LL, Gordon DC, et al. (2000) Wild barley: a source of genes for crop improvement in the 21st century. J Exp Bot 51: 9–17. 31. Jin XL, Cai SG, Han Y, Wang J, Wei K, et al. (2011) Genetic variants of HvGlb1 in Tibetan annual wild barley and cultivated barley and their correlation with malt quality. J Cereal Sci 53: 59–64.
PLOS ONE | www.plosone.org
32. Sun DF, Ren WB, Sun GL, Peng JH (2011) Molecular diversity and association mapping of quantitative traits in Tibetan wild and worldwide originated barley (Hordeum vulgare L.) germplasm. Euphytica 178: 31–43.
10
April 2014 | Volume 9 | Issue 4 | e94881