Development and Implementation of Algorithms for Power Quality Measurements Pedro M. Ramos1,2, Tomáš Radil2, Fernando M. Janeiro2,3, A. Cruz Serra1,2 1
Department of Electrical and Computer Engineering, Instituto Superior Técnico, Technical University of Lisbon, Av. Rovisco Pais 1, 1049-001 Lisbon, Portugal Phone: +351-218418485; Fax: +351-218418472; e-mail:
[email protected],
[email protected] 2
Instituto de Telecomunicações, Av. Rovisco Pais 1, 1049-001 Lisboa, Portugal Phone: +351-218418489, Fax: +351-218418472, e-mail:
[email protected]
3
Universidade de Évora, Rua Romão Ramalho, nº. 59, 7000-671 Évora, Portugal Phone: +351-266745300; e-mail:
[email protected]
Abstract1— In recent years, power quality measurements are one of the research topics of the Instrumentation and Measurement Group of Instituto de Telecomunicações. This paper summarizes the latest achievements. The paper describes the proposed algorithms for detection and classification of power quality disturbances and the new measuring instruments that were developed.
I. INTRODUCTION The assessment and monitoring of power quality (PQ) has become a very important issue in the past years. Standards covering different aspects of PQ measurements were published (e.g., [1-4]) and methods for assessment of the quality of electrical power where described in them. However, in some cases the standards are not specific about which method should be used. Also, the latest developments in signal processing algorithms and the increasing computational power of modern measuring instruments offer the opportunity to improve or replace the commonly used methods. In this paper, the main achievements of the research done by the Instrumentation and Measurement Group of the Instituto de Telecomunicações in the power quality subject are described. The paper describes the algorithms for detection and classification that were developed and the measuring set-ups and instruments designed to implement them. II. NEW ALGORITHMS FOR DETECTION AND CLASSIFICATION OF PQ DISTURBANCES The development of new algorithms focuses on detection and classification of transients and waveform distortions. Unlike in the case of other types of disturbances (such as sags or swells) in case of transients and waveform distortions, the PQ standards only suggest several methods that could be used [1] but there is no method that could be considered standard or reference. Several approaches were experimented. First, a method based on the stationary wavelet transform (SWT) was
Work sponsored by the Portuguese national research project reference PTDC/EEA-ELC/72875/2006.
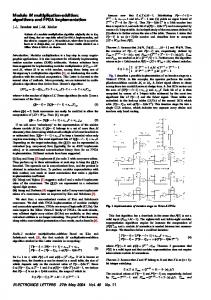
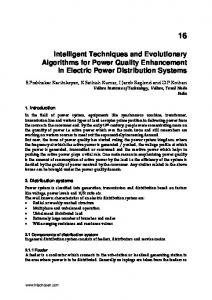
developed [5]. However, as all the methods based on wavelet transform this solution was very sensitive to the selection of the mother wavelet and the number of decomposition levels and was not suitable for reliable detection of disturbances. The next solution used a digital high-pass filter [6] to separate the fundamental and the disturbances. Digital filters can be easily and efficiently implemented in e.g. measuring instruments based on a digital signal processor (DSP); however, the disadvantage of this solution was the filter’s non-linear phase and its inability to detect disturbances with frequencies below the fundamental. The latest version of the detection and classification algorithm is based on sine fitting algorithms. The block diagram of the algorithm is shown in Fig. 1. Besides the part for detection and classification of transients and waveform distortions, Fig. 1 also shows the part that detects sags, swells and interruptions. This part is based on calculation of the RMS value, as suggested by the standards [1]. The algorithm uses the 4-parameter sine fitting algorithm [7] to separate the fundamental uF and the component that contains potential disturbances uε. The envelope of the signal uε is then calculated using the mathematical morphology operation closing [8][9] and the potential events are detected by thresholding the resulting signal uMORPH using a preset threshold level Morph_THR. The classification of the disturbances is based on their duration and the content of harmonic and interharmonic frequencies. The harmonic and interharmonic parts of the signal uε are separated using the non-iterative multiharmonic sine fitting algorithm [10]. The results of the multiharmonic sine fitting are used to calculate the total harmonic distortion (THD) and the total interharmonic distortion (TIHD). For more details on the proposed detection and classification method see [11]. III. MEASURING SET-UP FOR LONG-TERM MONITORING To test the proposed algorithms on signals measured in the power system, the following measuring set-up was assembled. The measuring set-up consists of a sensor box and a PC (Fig. 2). The sensor box contains the voltage transducer (V) LEM CV 3-500, the current transducer (I) LEM LA 25-NP and the data acquisition board (DAQ) NI USB 9215. The supply voltage ±15V for the transducers is derived from the USB +5V voltage using a DC/DC
Fig. 1. Block diagram of the proposed detection and classification algorithm method. converter. The sensor box is connected to the PC using a high-speed USB 2.0 interface. The sensor box is designed for measurements in the 230V/50Hz power systems. The measuring set-up was used for a long-term monitoring of the power system on several locations in Portugal. The gathered disturbances were used to modify and adjust the proposed method in order to achieve accurate detection and classification.
transducers as the measuring set-up described in Section III. The data acquisition is controlled by the DSP (ADSP-21369) which also performs all the signal processing required by the algorithms described in Section II. The analyzer contains a power supply with back-up battery which ensures uninterrupted operation of the analyzer even during sags or interruptions. The detected disturbances are stored on a memory card and can be uploaded to a PC using a full-speed USB 2.0 interface. V. DATABASE OF MEASURED PQ DISTURBANCES
Fig. 2. Block diagram of the measuring set-up. IV. PQ ANALYZER The above described measuring set-up is suitable for laboratory measurements. For field measurements a simpler and more portable instrument is required. For this purpose, a prototype of a power quality analyzer based on a digital signal processor (DSP) was designed and assembled. The block diagram of the analyzer is shown in Fig. 3. The PQ analyzer is able to monitor in real-time a singlephase power system and to detect and classify the disturbances that occur. The PQ analyzer contains the same
In recent years, many new methods for detection and classification of disturbances were proposed. Comparison of their performance is difficult as, especially in case of transients and waveform distortions, no reference method is proposed by the standards and different authors use different test signals to demonstrate the capabilities of their methods. Furthermore, the performance of these methods is usually shown only on simulated signals which may not illustrate well the method’s behavior in real-world conditions. For example, the performance of methods for detection of sags is usually shown on simulated signals containing a sudden drop and sudden restoration of the voltage. In such case, the behavior of wavelet transform based methods is very different compared to the commonly encountered case of sags with gradual voltage drop and/or restoration. In order to allow easier comparison of algorithms for detection and classification of PQ disturbances the disturbances gathered using the long-term monitoring were used to create an on-line database. The database is accessible at http://gim.lx.it.pt/fct57708/data/ and, at this point, contains
Fig. 3. Block diagram of the proposed PQ analyzer. over 15 000 disturbances gathered from June 2006 up to March 2008. The database contains a list of disturbances with information about the time of their occurrence, their duration and magnitude. Detailed information about each of the disturbances is available in four different formats: • HTML, • PQDIF, • plain text and • Matlab.
1
u (pu)
0.5 0 -0.5 -1 -1.5 0
a)
50
100
150
200 t (ms)
250
300
350
400
50
100
150
200 t (ms)
250
300
350
400
0.7 0.6
uMORPH (pu)
0.5 0.4 0.3 0.2 0.1
b)
0 0
1.5 1 uMORPH (pu)
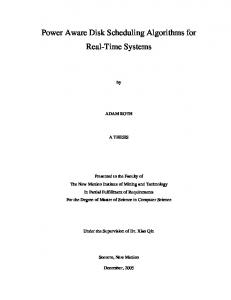
The HTML files contain figures with the voltage waveforms that contain the disturbances and the waveforms of the signal used in the detection and classification process. In case of sags, swells and interruptions, the evolution of the RMS value is shown. In case of transients and waveform distortions, the signal after the closing operation (uMORPH) is shown. The Power Quality Data Interchange Format (PQDIF) is a standard format [12] for storage of power quality-related data. The PQDIF files available in the database contain the normalized voltage waveform with the disturbance. Plain text files contain basic information about the disturbance (e.g., its duration and magnitude), the measurement conditions (e.g., sampling rate) and the samples of the voltage signal containing the disturbance. The Matlab .MAT file contains the information about the disturbance (type, duration, time of occurrence, magnitude), information about the location where the disturbance was measured, the voltage waveform with the disturbance and the signals used in the detection and classification process. An example of signals stored in the Matlab file is shown in Fig. 4. This file contains a transient that was measured on February 13th, 2007. The event started at 21:15:27.694, its duration was 2.04 ms and the transient’s magnitude was 0.59 pu. Fig. 4a depicts the normalized voltage containing the disturbance. As can be seen, the voltage waveform stored in the file starts approximately 200 ms before the event and ends 200 ms after the event. Fig. 4b shows the signal after the closing operation uMORPH that was used to detect and classify the event. Detail of the event is shown in Fig. 4c.
1.5
0.5 0 -0.5 -1
c)
-1.5 170
180
190
200 t (ms)
210
220
230
Fig. 4. Example of a measured transient; a) voltage waveform containing the transient; b) signal after closing operation (uMORPH); c) detail of the event.
VI. CONCLUSIONS In the scope of research in the area of power quality, several methods for detection and classification of power quality disturbances were developed. Theses methods were implemented in the designed measuring set-up and in the prototype of a stand-alone power quality anaylzer. The future development will focus on improving the algorithm for detection and classification so it can detect more disturbances (e.g., flicker). Further, both the algorithm and the PQ analyzer will be extended so they can be used for three-phase measurements. REFERENCES [1] IEC 61000-4-30 Electromagnetic compatibility: Testing and measurement techniques – Power quality measurement methods, IEC 2003. [2] IEC 61000-4-7 Electromagnetic compatibility: Testing and measurement techniques – General guide on harmonics and interharmonics measurement and instrumentation, for power supply systems and equipment connected hereto, IEC 2002. [3] IEC 61000-4-15 Electromagnetic compatibility: Testing and measurement techniques – Flickermeter – Functional and design specifications, IEC 2003. [4] IEEE Std. 1159-1995, IEEE Recommended Practice for Monitoring Electric Power Quality”, Dec. 1995. [5] V. Matz, T. Radil, P.M. Ramos, “Multifunction Power Quality Monitoring Systemy,” Proc Technical Computing Prague, Prague, Czech Republic, pp. 67 - 74, Oct. 2006.
[6] V. Matz, T. Radil, P.M. Ramos, A.C. Serra, “Automated Power Quality Monitoring System for On-line Detection and Classification of Disturbances,” Proc IEEE Instrumentation and Measurement Technology Conf., Warsaw, Poland, May, 2007. [7] IEEE Std. 1057-1994 (R2001) – IEEE Standard for Digitizing Waveform Recorders, Sept. 2001. [8] J. Serra, Image Analysis and Mathematical Morphology, vol. 1, Academic Press, 1982. [9] T. Radil, P. M. Ramos, F. M. Janeiro, A. C. Serra, “DSP Based Power Quality Analyzer for Detection and Classification of Disturbances in a Single-phase Power System”, Metrology and Measurement Systems, Vol. XIV, No. 4, pp. 483 - 494, Dec. 2007. [10] P. M. Ramos, M. F. da Silva, R. C. Martins, A. C. Serra, "Simulation and experimental results of multiharmonic least-squares fitting algorithms applied to periodic signals," IEEE Trans. Instrum. Meas., vol. 55, no. 2, pp. 646-651, Apr. 2006. [11] T. Radil, P. M. Ramos, A. C. Serra, “Improved Method for Detection and Classification of Transients and Waveform Distortions Using Sine Fitting Algorithms,” Int. Conference on Renewable Energies and Power Quality ICREPQ’09, Valencia, Spain (accepted) [12] IEEE 1159.3 Recommended Practice for the Transfer of Power Quality Data, 2003.