Edward Seidman; LaRue Allen; J. Lawrence Aber; Christina Mitchell; Joanna Feinman; Hirokazu .... Lanza, A. F., Cameron, A. E., & Revenson, T. A. (in press).
American Journal of Community Psychology, Vol. 23, No. 3, 1995
Development' and Validation of AdolescentPerceived Microsystem Scales: Social Support, Daily Hassles, and Involvement 1 Edward Seidman 2 and LaRue Allen New York University
J. Lawrence Aber School of Public Health, Columbia University
Christina Mitchell Health Sciences Center, University of Colorado
Joanna Feinman and Hirokazu Yoshikawa New York University
Katherine Anne Comtois University of Maryland
Judith Golz, Robin L. Miller, and Blanca Ortiz-Torres New York University
Gillian Carty Roper University of Maryland
1This research was supported in part by grants from the National Institute of Mental Health (MH43084) and the Carnegie Corporation (B4850) awarded to Edward Seidman, J. Lawrence Abet, LaRue Allen, and Christina Mitchell. We express our appreciation to the children and schools whose cooperation made this study possible, as well as to Traosy A. Revenson for her creative suggestions on restructuring an earlier draft of this manuscript. 2All correspondence should be sent to Edward Seidman, Adolescent Pathways Project, Center for Community Research and Action, Psychology Department, Room 277, New York University, 6 Washington Place, New York, New York 10003. 355
0091-0562/95/0600-0355507.50/0 9 1995PlenumPublishingCorporation
356
Seidman et al.
Developed and validated instruments for urban and culturally diverse adolescents to assess their self-reported transactions with family, peer, school and neighborhood microsystems for the constructs of social support, daily hassles, and involvement. The sample of 998 youth were from schools in three Eastern cities with high percentages of economically disadvantaged youth. Data were collected before and after the transition to junior high school or to senior high school. Blacks constituted 26%, whites 26%, and Latinos 37% of the sample. Factor analyses confirmed and enhanced the hypothesized four-factor microsystem factor structure for support, hassles, and involvement; internal consistency and stability coefficients were consistent with these structures. In general, the microsystem factors were common across gender, ethnicity, and age. However, when group differences did occur on these demographic variables, they tended to validate the salience of microsystem specificity. In contrast to the total scores, the microsystem-specific factors yielded more meaningful and differential information with regard to demographic differences and the mediating processes across a school transition. KEY WORDS: at-risk adolescents; microsystem measures; social support; daily hassles; participation.
In the last several decades, psychology has moved beyond a sole focus on person-centered constructs to the study of behavior in context. Many researchers in developmental and community psychology have presented comprehensive ecological frameworks for understanding human behavior and development that underscore the importance of mediating processes (e.g., Bronfenbrenner, 1979; Lerner, 1986; Seidman, 1983; Trickett, Kelly, & Todd, 1972). The daily transactions that an individual has with her ramfly, peer, school, and neighborhood microsystems constitute a critical set of mediating processes (Bronfenbrenner, 1979). Empirical research, however, has not fully caught up with the challenge offered by these ecological frameworks. By and large, mediating processes have been examined in a broad, global and nonspecific fashion, in contrast to a contextualized assessment that represents an individual's unique transactions with each specific microsystem. In this article, we report the development and validation of instruments which assess microsystem-specific transactions and are appropriate for poor, urban, and culturally diverse adolescents. The instruments measure three types of mediating processes, support/cohesion, daily hassles, and involvement, within four microsystems: the family, peer, school, and neighborhood contexts. Self-report instruments to assess microsystem-specific processes have been available for only selected constructs, such as social support (Cauce, Felner, & Primavera, 1982; Slavin, 1991) and daily hassles (Bobo, Gilchrist, Elmer, Snow, & Schinke, 1986). With one exception
Microsystem Scales
357
(Cauce et al., 1982), none were developed for urban, culturally diverse adolescents. These new instruments allow us to examine, for example, whether measurement of perceived transactions within particular microsystems (e.g., schools or family) yield richer information regarding how microsystem-specific transactions mediate the effect of risk factors on developmental outcomes in contrast to transactions averaged across microsystems. The following sections examine the conceptual importance and extant evidence for the microsystem-specific mediating processes of social support/cohesion, daily hassles, and involvement. Except for social support, the differential patterns of transactions with family, peer, school, and neighborhood microsystems as they relate to a variety of adaptive and maladaptive outcomes seldom have been addressed.
Social Support~Cohesion Perceived social support in family, peer, and school relationships is commonly employed to tap the affective quality of microsystem transactions. Neighborhood relationships have been operationalized in terms of cohesion or a psychological sense of community (Buckner, 1988). Most often, social support is measured by asking respondents what type(s) of support they have received from different providers, then summing or averaging across providers to obtain a global score. Yet, an argument frequently has been made for the differential effectiveness of social support as a function of who provided the support (Cauce et al., 1982; Lanza, Cameron, & Revenson, in press; Procidano & Heller, 1983; Slavin, 1991). Assessing the helpfulness of 10 different providers, Cauce et al. (1982) reported a three-component structure for inner-city high school students: family (parents and relatives), formal relationships (with school and employment personnel), and informal relationships (with other adults and friends). Similarly, the Perceived Emotional/Support Scale for adolescents (Slavin, 1991) produced separate factors for family, nonfamily adults, and friends. Cauce, Reid, Landesman, and Gonzales (1990) refer to this microsystem specificity as the provider model of support, in contrast to functional models in which the emphasis is on the function of the support (e.g., emotional, instrumental; Mitchell & Trickett, 1980). Overall, the differential validity of the provider model has consistently received greater empirical substantiation than the functional model (Cauce et al., 1982; Cauce & Srebnik, 1989; Furman & Buhrmester, 1985; Slavin, 1991; Wolchik, Beals, & Sandier, 1989). Several studies have demonstrated the differential valid-
358
Seidman et al.
ity of the provider model of support with adolescent samples, though, to date, connectedness to the neighborhood has not been part of this model. Family or parental support has been positively associated with selfesteem and mental health in student samples ranging from public inner-city schools to private suburban schools (Cauce et al., 1982; Cauce, Harman, & Sargeant, 1992; Rowlison & Felner, 1988). How the gender, race/ethnicity, and age of the recipients of support affect these relationships has been addressed less frequently. (Hereafter, for ease of exposition, ethnicity is used in place of the more cumbersome phrase race/ethnicity; it is also the more inclusive term.) Main effects for age or gender in perceived family support were not found in several studies (Cauce et al., 1982; Fitzgerald, 1991; Slavin & Rainer, 1990). However, in one study, the relationship to depression was limited to girls (Slavin & Rainer, 1990), and in another, an interaction between gender and age was found (Cauce et al., 1982). Younger males reported greater support than older males and, conversely, younger females perceived less support than older females. Blacks also perceived greater support than whites or Latinos and, although family support was positively associated with scholastic self-concept overall, the correlation for black females was negative. Peer support has been positively related to mental health indices in a number of investigations (Cauce et al., 1982, 1992; Hartup, 1983; Hirsch & DuBois, 1992; Rowlison & Felner, 1988; Slavin & Rainer, 1990), but the findings for the relationship between peer support and school achievement have been mixed. Females perceived greater support from friends (and informal sources) than did males (Cauce et al., 1982; Rowlison & Felner, 1988; Slavin & Rainer, 1990). Peer support increased with age/grade in some (DuBois, Felner, Brand, Adan, & Evans, 1992; Fitzgerald, 1991; Rowlison & Felner, 1988) but not all studies. Peer support has been related to race, though not always in the same fashion (Cauce et al., 1982; Rowlison & Felner, 1988). Hirsch and DuBois (1992) found that peer support was inversely related to psychological symptoms across the transition to junior high school. The effects of peer and family support on adolescent sexual activity may vary by ethnicity. For African American teenagers, neither family nor friend sources of support was predictive of sexual activity. Among Latinos, however, both family and friend support predicted sexual activity: Family support was associated with delayed sexual activity, whereas friend support was associated with early engagement in sexual activity (Fitzgerald, 1991). School-based support has been positively related to school competence (Cauce et al., 1992), self-concept, adjustment, and school attendance (Rowlison & Felner, 1988). No significant relationships between school support and gender, ethnicity, or age have been reported.
Microsystem Scales
359
Overall, the evidence suggests the importance of the microsystem specificity of support in the prediction of adolescent outcomes, as there are differential demographic relationships among family and peer sources of support. Moreover, given the importance of neighborhoods during this phase of development (Gephart, 1989), a microsystem-specific support measure should include adolescents' perceived supportive transactions with the neighborhood.
Daily Hassles There has been increasing attention to the effects of perceived daily hassles and role strains on health and well-being. Pearlin and Lieberman (1979) have defined role strains as "persistent . . . problems with which people collide in their daily lives" (p. 26); similarly, Kanner, Coyne, Schaefer, and Lazarus (1981) have defined hassles as "irritating, frustrating, distressing demands that to some degree characterize everyday transactions with the environment" (p. 31). Research has demonstrated the importance of daily hassles for adjustment and other adaptive outcomes (Lazarus & Folkman, 1984), though it has been strongly argued by some that this association is, in part, an artifact of the similar measurement techniques used in symptom and hassle reports (Dohrenwend, Dohrenwend, Dodson, & Shrout, 1984). Increasingly, researchers investigate the role of daily hassles in adolescents' lives. To a large extent, assessment has focused on the global as opposed to microsystem-specific experience of daily hassles. For example, Rowlison and Felner (1988) found a negative association between global daily hassles and psychological adjustment. Two studies have developed instruments to tap more specific aspects of hassles and strains; both employed small samples of primarily white, middle-class, fifth- and sixth-grade students. The Early Adolescent School Role Strain Inventory (EASRSI; Fenzel, 1989b) yielded four factors labeled peer interaction, school demands, parent control, and teacher relations. The Adolescent Hassles Inventory (AHI; Bobo et al., 1986) produced eight components, three of which tapped the critical microsystems of school, peer, and parents. All four subseales of the EASRSI were related negatively to self-esteem and related positively to anxiety. However, the relationships of peer strain to self-esteem and of parental control to anxiety were much larger than the other correlations (Fenzel, 1989b). In a study of the transition to a middle school with a team-teaching structure, Fenzel (1989a) reported declines in the magnitude of perceived strain across the transition, primarily accounted for by decreases in peer and teacher control. For the AHI, re-
360
Seidman et al.
males perceived greater hassles than did males from school and peers, and peer hassles had the largest inverse relationship to peer satisfaction for both boys and girls (Bobo et al., 1986).
Involvement Participation or involvement with extracurricular school activities (Holland & Andre, 1987) and leisure or recreational activities (e.g., Garton & Pratt, 1991; Hutchinson, 1987) have become topics of some import in research on adolescents. Extracurricular participation is positively correlated with self-esteem, improved race relations, political and social activity, male academic ability and grades, educational aspirations, feelings of control, and lower delinquency rates (Holland & Andre, 1987), though its causal role in the sequence has not been demonstrated. Many theories discuss the importance of a youth's involvement with family and peers as critical to well-being. Time spent with p a r e n t s decreases t h r o u g h o u t adolescence, while the frequency of interactions with friends increases (Csikszentmihalyi & Larson, 1984). Moreover, the location for leisure activities, for example, the neighborhood, may be as significant as the activity itself (Fine, Mortimer, & Roberts, 1990). To our knowledge there are no available self-report instruments to assess an adolescent's involvement with family, peers, school, and neighborhood.
Goals and Objectives In the current study, we describe the development and validation of instruments to assess support/cohesion, daily hassles, and involvement within the family, peer, school, and neighborhood microsystems. These measures were expected to meet several conceptual and psychometric criteria. First, we wanted these measures to be relevant for poor, urban, and culturally diverse adolescents. Prior literature has often neglected these populations (Graham, 1992) or used instruments developed and standardized on middle-class, white samples to address questions that may be culturally anchored (Hughes, Seidman, & Williams, 1993). The development and validation of instruments to assess microsystem-speeific processes for middle-class youth is also imperative, but given our concerns, we developed some items that might prove particularly salient to populations of poor, urban, and culturally diverse adolescents. Second, we wanted each construct to consist of separate and integrally related sets of items (factors) that represent each of the four postulated
Microsystem Scales
361
microsystems. However, by designing items particularly suited to the population of interest, we did not want to dictate a four-factor microsystem structure, unless such a solution was warranted by the data. Consequently, we utilized exploratory as opposed to confirmatory factor analytic procedures. Third, the empirically derived microsystem factors for each dimension were expected to manifest acceptable levels of both internal consistency and test-retest reliability. Fourth, a subtheme of both the second and third objectives was the extent to which the resulting factor structures and reliabilities were unique or common across gender, ethnicity, and age (Seidman, 1991). Thus, for each construct, we compared the resulting factor structure derived from the total sample with those derived from the gender, ethnicity, and age cohort subsamples. Similarly, we examined whether the internal consistency reliabilities for each microsystem factor were similar or different within gender, ethnicity, and age cohorts. Fifth, for each dimension, we wanted to demonstrate that the microsystem factor scores yielded richer, more specific information--the microsystem-specific hypothesis. We assessed these validity questions both cross-sectionally and longitudinally. Cross-sectionally, we examined differences in gender, ethnicity, and age cohort among each dimension's microsystem factor scores. For example, developmentally old cohort youth might be expected to report more daily hassles with family than with peers. Longitudinally, we examined the impact of a school transition for each dimension, contrasting the differential effects among the microsystem factor scores with the total score. We speculated that the disruptiveness of a school transition would impact perceived social support, daily hassles, and involvement with the school microsystem to the greatest extent, and secondarily the peer microsystem dimensions (Eccles & Midgley, 1989), while the reported transactions with the neighborhood would be least likely to be affected.
METHOD Sample Data for this study were drawn from the Adolescent Pathways Project (APP), a longitudinal study of youth attending public schools in three Eastern cities (Baltimore, Washington, DC, and New York City) with high concentrations of poor children (for additional details, see Seidman, 1991). To ensure that the sample consisted primarily of youth from low-income populations, elementary schools and intermediate or junior high schools with high proportions of the student body eligible for reduced and/or free lunch
362
Seidman et al.
(R/FL) were targeted. Predominantly black or Latino schools with a minimum of 80% and predominantly white schools with a minimum of 60% of the student body eligible for R/FL were targeted (the poorest white schools did not have as high concentrations of economically poor students as did the schools with predominantly minority enrollments). Within targeted schools, all students in the grade prior to the transition to an intermediate/junior high school (Young Cohort; fifth or sixth graders) or senior high school (Old Cohort; eighth or ninth graders) were recruited. The grade structure of the Baltimore schools was K-5/6-8/9-12, while in Washington it was K-6/7-9/10-12. To avoid confounding grade sequence with city, both grade sequences were sampled in New York City. Across cities, these youth initially came from 32 elementary and junior high schools and 82 junior and senior high schools in the transition year. Study participants were recruited in each classroom of the targeted grades. Active parental consent was mandated for participation. Only youth for whom we had signed consent forms from both themselves and a parent were recruited for the transition wave of data collection. On the average, Wave 2 data collection occurred 10 months after Wave 1. Of the original sample 69% had completed protocols at both waves of data collection, hereafter referred to as the transition sample. While attrition differences in demographic and life stress variables were evident, in no case did any one of them account for more than 1% of variation. (For additional details on recruitment and attrition, see Seidman, 1991 and Seidman, Allen, Abet, Mitchell, & Feinman, 1994.) The transition sample consisted of 998 youth. In terms of gender, the sample was 59% female, and in ethnicity, 26% black, 26% white, 37% Latino, and 11% other (consisting primarily of Asians and biracial youth). The black youth were both African American and Caribbean American, the whites were primarily Greek American and Italian American, and the Latinos were predominantly Puerto Rican and Dominican. At the time of the posttransition data collection, youth ranged in age from 10 to 18 (M = 13.09, SD = 1.53). Almost four fifths (78%) of the sample was from New York City, 15% from Washington, DC, and 7% from Baltimore. In general, the ethnic ratios of participants within cities reflected those within the public school systems. The Washington sample was primarily black, with a small percentage of Latinos and no whites. The Baltimore sample had a mix of black and white students, and the New York sample contained Latinos as well as blacks and whites. Further confirmation of the low socioeconomic status (SES) of the sample was gathered by examining the poverty of the neighborhood in which they resided. Fifty-seven percent of the transition sample youth lived in census tracts where 20% or more of the nonelderly residents fell below
Microsystem Scales
363
the official poverty line, and 20% of these youth lived in census tracts referred to as concentrated poverty or "underclass" neighborhoods (40% or more below the poverty line). However, residing in economically disadvantaged neighborhoods was distinctively characteristic of the Latino and black subsamples in contrast to the white subsample" 80 and 35% of the Latino subsample, 77 and 21% of the black subsample, while only 8 and 1% of the white subsample lived in poverty and concentrated poverty neighborhoods, respectively. Measures and Procedures
We developed the instruments to meet three criteria: (a) to assess the proposed constructs of social support/cohesion, daily hassles, and involvement within the family, peer, school, and neighborhood microsystems; (b) to be appropriate for administration to poor, inner-city adolescents; and (c) to be brief. As a first step, we presented the items to small groups of poor urban, culturally diverse youth to ascertain whether the measures were comprehensible, linguistically appropriate, and meaningful. Second, we made the necessary modifications to achieve our three objectives. Finally, based on the scales' psychometric properties in Wave 1, we fine-tuned them by including/excluding some items on a few scales before administering the final versions to the transition sample in Wave 2. The data were collected in group settings at schools by APP staff of different racial and ethnic backgrounds. Instructions and questions were read aloud as the staff members circulated to answer questions and spotcheck measures where directions were more complicated.
Support~Cohesion Microsystem Scales To assess perceived social support in the family, peer, and school microsystems and perceived cohesion in the neighborhood microsystem, we modified widely used measures of social support and psychological sense of community. The nature and format of the social support and cohesion measures are different. The Social Support Microsystem Scale was developed by modifying and elaborating Cauce's seminal Social Support Rating Scale (SSRS; Cauce et al., 1982). The SSRS asks two questions for each of 10 providers: "When you need information to help you deal with a problem, how helpful is each of the following people?" and "When you go to talk about a personal problem, how helpful is each of the following people?" Respondents use a 3point scale, ranging from 1 (not at all) to 2 (somewhat), or 3 (a great deal).
364
Seidman et al.
In our initial modification, we added several providers (e.g., stepmother, siblings, neighbors, pets). Before asking questions about support, we asked the youth to confirm whether: "This person is in your life." For those providers for whom the youth provided an affirmative response, the youth was then asked to rate the person's helpfulness "when I have a personal problem" and "when I need money and other things," and to indicate how much "I have fun with this person." Respondents rated each item using the 3-point format of the SSRS. The third question adds satisfaction with support to the emotional and instrumental functions of social support already tapped by the SSRS. We reduced the number of providers to seven in the final instrument, primarily because of the low endorsement of people rated as being in the youth's life and the length of the measure. Youth could also fill in and rate an eighth provider that they listed under the heading of "Other people." The social support items are listed in the left-hand column of Table I. In the Wave 1 sample, all seven providers were viewed as substantially in the lives of our participants. The most endorsed support provider was mother (98%); the least endorsed provider was principal/assistant principal (53%). The pattern of item endorsements on each of the three questions differed by provider. The only item with truncated variability was the helpfulness of the principal/assistant principal with money or other things; 89% described this provider as "not at all helpful" with this function. The Neighborhood Cohesion Scale consisted of six items adapted from the Neighborhood Cohesion Instrument (Buckner, 1988), rated on a 4-point scale ranging from very true to not at all true. The items are: I fit in with neighbors; Relationships with neighbors mean a lot; I like living in my neighborhood; Neighbors would help in an emergency; Neighbors can tell if someone's a stranger; My neighborhood is better than other nearby neighborhoods. The pattern of item endorsements was skewed toward reporting high cohesion. Daily Hassles Microsystem Scale
In developing the Daily Hassles Microsystem Scale, we selected items from the Daily Hassles Questionnaire (DHQ; Rowlison & Felner, 1988), a modification of the Hassles Scale (Kanner et al., 1981). From the DHQ, we selected items that focused on family, peer, and school hassles and developed additional items to assess perceived neighborhood hassles. Pilot study analyses enabled us to shorten the instrument to 28 items. For each item, the youth responded "yes" or "no" to whether the event "hasn't happened this month," and if the hassle had occurred, how
Microsystem Scales
365
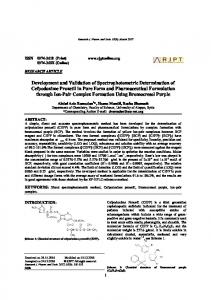
Table I. Social Support Rotated Factor Structure and Corresponding Alpha
Coefficientsa Factor Items
Group of close friends--personal problem Kids your age--personal problem Group of close friends--money and other things Group of close friends--fun Kids your age--fun Kids your age--money and other things Father--fun Father--personal problem Father--money and other things Mother--personal problem Mother--fun Mother--money and other things Sisters/brothers--personal problem Sisters/brothers-- fun Sisters/brothers--money and other things Principal/asst. principal--personal problems Principal/asst. principal--fun Principal/asst. principal--money and other things Teacher--money and other things Teacher--personal problem Teacher--fun
I
II
III
70 67 63 59 59 57 69 68 58 56 50 41 35 34 30 63 61 60 57 57 48
Alpha coefficients 81 75 74 aThe three-factor structure was the result of a principal axis factor analysis with varimax rotation. Only loadings > .30 are presented; decimal points are omitted. In the left-hand column, the provider is noted first followed by the specific function.
m u c h o f a hassle it was, on a 4-point scale ranging f r o m 1 (not at all a hassle) to 4 (a very big hassle). T o avoid dropping participants, ratings o f " h a s n ' t h a p p e n e d this m o n t h " and " n o t at all a hassle" were scored as 1 in calculating the hassles intensity scores. T h e items are listed in the lefth a n d c o l u m n o f Table II. All 28 items had acceptable e n d o r s e m e n t frequency distributions.
Involvement Microsystem Scale T h e Involvement Microsystem Scale was developed to m e a s u r e u r b a n adolescents' reports o f their actual involvement, participation and engage-
366
Seidman et al.
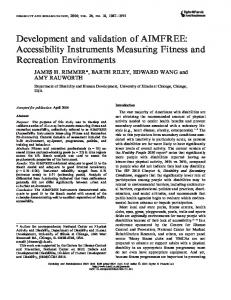
Table IL Daily Hassles Rotated Factor Structure and Corresponding Alpha Coefficientsa
Factor Items
I
Trying to make good grades Pressure to do well in school Possibility of failing in class School being too hard Participating in gym/P.E, class Parents too nosy about what you do Trouble with parents over how you spend your time after school and on weekends Increased number of arguments between parents Getting caught in arguments between family members Being approached by a drug dealer in your neighborhood Being scared by someone in your neighborhood (scared of walking alone) Living in a noisy neighborhood Seeing homeless people in your neighborhood (drunks, bums) Not having a place to play with your friends in the neighborhood Worries about getting pregnant/getting someone pregnant Not spending enough time with parent after divorce Having a sick brother or sister Difficulties with friends Problems with friends Trouble with friends over beliefs, opinions and choices Being left out of activities or ignored by other kids Friends bugging you to party Not having your own room Not having enough bathrooms at home Not having enough nice clothes to wear Trouble with brothers and/or sisters Not having a way to earn money in your neighborhood Parent not home as much
79 71 57 57
Alpha coefficients
79
II
III
IV
V
67 63 62 52
31 71 51 49 40 39
81
72 33 54 46 40 37 34
32
75
74
71
69
aThe five-factor structure was the result of a principal axis factor analysis with varimax rotation. Only loadings > .30 are presented; decimal points are omitted. When an item loaded on two factors, it was assigned to the mierosystem scale upon which it loaded more highly.
ment with salient microsystems. A number of items were culled from the Health and Daily Living Form (Moos, Cronkite, Billings, & Finney, 1984), and we created additional items. Pilot study analyses enabled us to shorten the instrument to 31 items. Youth were asked how often they did several
Microsystem Scales
367
n e u t r a l o r positively v a l e n c e d activities with e a c h m i c r o s y s t e m , d u r i n g t h e l a s t year: " y o u r family" (7 items), " y o u r friends o u t s i d e o f s c h o o l " (6 items), " a t y o u r school" (9 items), a n d "in y o u r neighborhood, n o t i n c l u d i n g y o u r s c h o o l " (9 items). T h e items a r e p r e s e n t e d in t h e l e f t - h a n d c o l u m n o f T a b l e III.
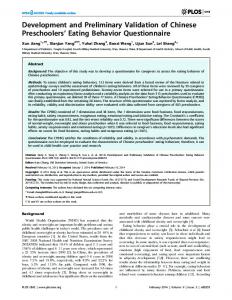
Table HI. Involvement Rotated Factor Structure and Corresponding Alpha Coefficients a
Factor Items
Neighborhood--helping to organize Neighborhood--speaking in public Neighborhood--contributing time Neighborhood--holding an office Neighborhood--clean up Neighborhood--youth organization Neighborhood--events School--academic activities School--newspaper School--clubs School--debate team School--student government School--volunteer helpers School--musical activities School--fundraising event School--cheerleaders Family--going to social events Family--get togethers Family--going to cultural events Family--vacations Friends--going to athletic events F•nds--playing sports/athletics Family--playing sports/athletics Family--going to athletic events Friends--watching TVA,ideos Friends--hang out Friends--going to social events Friends--going out on dates Neighborhood--talking to neighbors Neighborhood--visiting neighbors Family--watching TVA,ideos
I
II
III
IV
V
VI
70 67 66 60 56 53 45
33
54 54 51 49 43 43 41 39 34 61 57 49 37 38 30
31
64 63 56 52
36
59 59 49 69 67 33
Alpha coefficients 84 73 70 75 62 71 aThe six-factor structure was a result of a principal factor analysis with varimax rotation. Only Ioadings > .30 are presented; decimal points are omitted. In the left hand column, the microsystem is noted first, followed by the activity in which the youth participated. When an item loaded on two factors, it was assigned to the microsystem scale upon which it loaded more highly. Since the scale based on Factor VI contained two items, the r is only .52.
368
Seidman et al.
Each involvement item was rated on a 6-point frequency scale: 1 (never or almost never), 2 (once a day), 3 (a few times a year), 4 (once a month), 5 (once a week), or 6 (almost every day). All items had acceptable endorsement frequency distributions, although the patterns varied greatly; some items were normally distributed, while others were positively or negatively skewed, and others manifested a rectangular distribution.
Data Analytic Strategy For each construct--social support/cohesion, daily hassles, and involvement--a series of analyses was conducted. These included structural, reliability, test-retest, and validity analyses. First, using the total transition sample, each of the instruments was subjected to an exploratory principal axis factor analysis (PAF) with both orthogonal (varimax) and oblique (oblimin) rotations to examine whether the underlying structure corresponded with the proposed microsystem structure or yielded a modified microsystem structure. Given that for all three constructs, both types of rotations yielded essentially identical results, only the results of the varimax rotations are presented. To examine whether the factor structure solution resulting from the total sample analysis was common or unique to each major demographic grouping, the PAF was repeated within each subsample--female and male, younger and older cohorts, and blacks, whites, and Latinos. Second, after calculating microsystem-specific scores by unit weighing and summing each item that loaded greater than .30 on a factor, alpha coefficients were computed for the total sample and for each of the gender, cohort, and ethnicity subsamples. (In the few instances in which an item loaded greater than .30 on more than one factor, the item was scored as part of the factor upon which it loaded highest.) The square roots of the subsample alpha coefficients were then transformed into z scores and the differences within each of the three subsample breakdowns compared, to examine whether the resulting structures were different for female versus male, blacks versus whites versus Latinos, and young versus old cohorts. A z score greater than 1.96 represents a significant difference, p < .05 (Cohen & Cohen, 1983). To insure that the significantly different alpha coefficients that occurred were not a result of chance, given the large number of comparisons performed, corroboration was sought using data from the Wave 1 sample. Only subsample alpha coefficients that were significantly different in both waves of data collection were considered meaningful.
Microsystem Scales
369
Third, test-retest reliability coefficients for each instrument's microsystem-specific factor scores were calculated across the 10-month interval between the first and second waves of data collection for the total sample. Fourth, we addressed the validity of the microsystem-specific hypothesis by asking" Do the microsystem-specific scales of a particular construct, such as involvement, manifest the same or a different pattern of relationships with each other and with the total scale score? We addressed this question in two ways. We compared the differential relationships between microsystem-specific scales and the total scale within gender, cohort, and ethnicity to evaluate the demographic utility of the microsystem-specific hypothesis. We also compared the differential pattern of microsystem and total scale changes across a school transition to evaluate the utility of the microsystem-specific hypothesis. To examine demographic utility for each construct, a Gender x Cohort x Ethnicity multivariate analysis of variance (MANOVA) with the mierosystem factor scores as dependent variables was conducted. This analysis explored the possible multivariate and specific univariate between-subject main and interaction effects. For patterns of change across the transition, both a repeated measures analysis of covariance (ANCOVA) and a repeated measures multivariate analysis of covariance (MANCOVA), controlling for whether the transition was to junior or senior high school, were performed for the total score and the set of microsystem-specific scores, respectively. The directions of the transitional effects for the total and microsystem-specific constructs were contrasted. Finally, a matrix of perceived microsystem factor score intercorrelations is presented.
RESULTS Social Support/Cohesion Structural Analyses
For the Social Support Microsystem Scale, a rotated three-factor structure was clear, conceptually meaningful, and also suggested by the scree criterion (Cattell, 1966). The unrotated three-factor structure initially accounted for 43% of the total variance and, following rotation, accounted for 34% of the common variance. [The percentage of variance explained by unrotated and final factor solutions in PAF are usually different, in contrast to the results of principal components analysis (SPSS Inc., 1991)]. As
370
Seidman et al.
shown in Table I, the hypothesized three-factor structure for family, peer, and school support was confirmed for the total sample. All 21 items loaded uniquely and above .30 on one of the three factors. The first, second, and third factors corresponded to the peer, family, and school support items, as designed, and accounted for 17, 9, and 9% of the common variance, respectively. The three-factor solution was remarkably consistent across all subsample analyses (gender, cohort, and ethnicity). For the YC and Latino subsamples, the scree criterion suggested a four-factor structure which was conceptually dearer: The three items pertaining to father split off to form a separate factor. Overall, however, the three-factor structure was remarkably consistent. Given the dramatic differences in format between the neighborhood and other three microsystem sets of items, the Neighborhood Cohesion Scale was scored separately. Collectively, the social support and neighborhood cohesion subscales assess support/cohesion specific to each microsystem.
Internal Consistency As can be seen at the bottom of Table I, the microsystem-specific alpha coefficients (range: .74-.81) compare favorably with the 21-item total support scale (a = .80). The six neighborhood cohesion items yielded an tx = .83. Alpha coefficients for the four microsystems were computed separately within gender, cohort, and ethnicity subsamples. Each of the square roots of these alpha coefficients was transformed into a z score and compared males to females, blacks to whites, blacks to Latinos, whites to Latinos, and young to old cohort. Of the 20 comparisons made (5 per microsystem), only 1 was statistically significant. Because of the large number of comparisons and the possibility of chance findings, we conducted this z comparison on Wave 1 data to determine whether this subsample alpha difference was consistent and meaningful. It was not replicated.
Test-Retest Reliability The 10-month test-retest reliability coefficients for family, peer, and school social support were .48, .40, and .35, respectively; for neighborhood cohesion it was .53. The fact that school support manifests the lowest testretest reliability makes sense given that these youth experienced a school transition during the intervening year.
Microsystem Scales
371
Validity For each support/cohesion microsystem score, the set of specific demographic, that is, Gender x Cohort x Ethnicity means are displayed in Table IV. A 2 • 2 • 3 M A N O V A for support/cohesion revealed multivariate main effects for gender, F(4, 568) = 7.32, p < .001, ES = .05, cohort, F(4, 568) = 8.34, p < .001, ES = .06, and ethnicity, F(8, 1138) = 8.80, p < .001, ES = .06. 3 No significant two- or three-way interaction effects were evident. Univariate analyses indicated that the gender effect for social support was accounted for primarily by differences in the family, F(1, 571) = 8.39, p < .01, 112 = .01, and peer microsystems, F(1, 571) = 13.81, p < .001, rl 2 = .02. Males perceived more support from family than did females, and females reported more support from peers than did males. The multivariate cohort effect was accounted for significantly by all but the peer microsystern. Old cohort youth perceived themselves as less cohesive with their neighborhood, family, and school than young cohort youth, F(1, 571) = 19.39, p < .001, rl 2 = .03; F(1, 571) = 7.50, p < .01, ~2 = .01; and F(1, 571) = 11.75, p < .01, ~2 = .02, respectively. The multivariate ethnicity effect was accounted for by all four microsystems; family, F(2, 571) = 10.99, p < .001, rl 2 = .04; peer, F(2, 571) = 7.36, p < .01, 112 = .03; school, F(2, 571) = 4.12, p < .05, ~2 = .01; and neighborhood, F(2, 571) = 13.37, p < .001, 112 = .04; but with some differential patterns. Whites perceived greater support than blacks and Latinos from their family, peer, and neighborhood microsystems, but less support from the school microsystem. A Gender • Ethnicity repeated measures M A N C O V A was performed on each of the four microsystem-specific support scores, controlling for whether the transition was to junior versus senior high school. This analysis was contrasted with a parallel A N C O V A using the total social support scale as the dependent variable. Both the multivariate and univariate analyses revealed statistically significant effects across the transition, F(4, 383) = 8.26, p < .001, ES = .08, and F(1, 624) = 9.09, p < .01, ~2 = .01, respectively. The multivariate microsystem analysis added greater specificity to the support/cohesion decrement manifested in the univariate analysis. The multivariate analysis revealed that the decrement in support across the transition was accounted for by a decrease in perceived support from the school 3Effect size (ES) and eta-squared (~2) are two different symbols that represent the strength of association or percentage of variance in common between independent and dependent variables. Each formula yields the same results and has the identical meaning. In SPSS output, ES and 1"12are used to indicate the strength of association in multivariate and univariate analyses, respectively.
372
$ e i d m a n et al.
,"~O
c-id
C4~
~d
c~c~
•
o
c~d
c~c~
c~c~
c~c~
0 •
0~
~d
c~,qC40
~C'4
c,lc~
~c5
,-sO
~Lt~
i ~ ,"~0
c~c~
~c5
c~c~
c~d
0o0
~c5
,"~0
0
Microsystem Scales
373
microsystem, F(1, 386) = 30.40, p < .001, ~z = .07, and not from family, peers, or neighborhood.
Daily Hassles Structural Analyses The hypothesized four-microsystem structure was not as clear as a five-factor structure; the five-factor structure was also suggested by the scree criterion. The unrotated five-factor structure accounted for 43% of the total variance, and following rotation accounted for 33% of the common variance. The five-factor structure is shown in Table II. All but 7 of the 28 items loaded above .30 on one or more of the five factors. Factor I accounted for 18% of the common variance and consisted of four items concerned with pressure to do well academically; this factor was labeled school hassles. Factor II, labeled faro@ hassles, accounted for 5% of the common variance and consisted of four items that represent parental or family conflict. Factor III, labeled neighborhood hassles, accounted for 4% o f the common variance and consisted of five items concerning hassles in the neighborhood. Factor IV, labeled peer hassles, accounted for 4% of the common variance and consisted of three items distinctly representing trouble with friends. Factor V, labeled resource hassles, accounted for 2% of the common variance and consisted of five items representing hassles over lack of resources, primarily in the home. The items, "Getting caught in arguments between family members" and "Trouble with brothers and/or sisters" loaded highest on Factor II and Factor V, respectively, but both items double-loaded on the other factor as well. Not surprisingly, when only four factors were rotated, family hassles and most (4 of 5) of the resource hassles items joined together to form a single factor. We chose to retain the five-factor solution for empirical as well as conceptual reasons, most importantly, to distinguish hassles originating from family conflict from those originating from lack of resources. For the female, younger cohort, and Latino subsamples, the five-factor structure for daily hassles was remarkably consistent. This is not surprising, since the females, younger cohort, and Latinos are the largest gender, cohort, and ethnicity subsamples, respectively. For the males, older cohort, and black subsamples, a smaller resource factor emerged, while for the white subsample, family and resource hassles stayed together as a single factor.
374
Seidman et al.
Internal Consistency As can be seen at the bottom of Table II, despite the small number of items on each subscale, the microsystem-specific alpha coefficients (range: .69-.97) are adequate though smaller than the coefficient for the 28-item total daily hassles intensity scale, (t~ = .89). Alpha coefficients for the five daily hassles microsystem factor scores were computed separately within each gender, cohort, and ethnicity subsample and compared. Of the 25 comparisons made (5 per microsystem), only 2 reached significance at the .05 level. The z comparisons conducted on Wave 1 data to determine whether these four subsample alpha differences were consistent and meaningful suggested that they were not.
Test-Retest Reliability The 10-month test-retest reliability coefficients for family, peer, school, neighborhood, and resource hassles were .44, .29, .40, .42, and .52, respectively. The family and resource factors appear somewhat more stable than peer, school, and neighborhood hassles; the school and peer microsystems were most likely to have been disrupted by the school transition.
Validity For each hassles microsystem score, the specific nature of demographic differences is displayed by the Gender • Cohort x Ethnicity means presented in Table V. A 2 x 2 • 3 M A N O V A revealed multivariate main effects for gender, F(5, 853) = 3.25, p < .01, ES = .02; cohort, F(5, 853) = 5.49, p < .001, ES = .03; and ethnicity, F(10, 1708) = 2.50, p < .01, ES = .01; but no two- or three-way interaction effects. The effect for gender was accounted for primarily by the differences in resource, /7(1, 857) = 12.79, p < .001, 112 = .01, and peer hassles, F(1, 857) = 5.89, p < .05, 112 = .01: females reported more hassles over resources and with peers than did males. The multivariate cohort effect, on the other hand, was accounted for primarily by hassles with family, F(1, 857) = 16.13, p < .001, rl 2 = .02, and school, F(1, 857) = 7.21, p < .01, HE = .01: old cohort youth reported greater hassles with family and school than young cohort youth. The multivariate ethnicity effect was accounted for primarily by neighborhood, F(2, 857) = 9.61, p < .001, rl 2 = .02, and resource hassles, F(2, 857) = 3.76, p < .05, rl z = .01: Latinos reported greater neighborhood and resource hassles than whites, and blacks reported greater hassles with their neighborhoods than whites.
Microsystem Scales
37S
~I~
~I~ •
• 0 0
..
N
~
~q
~
~
376
Seidman et al.
Next, a Gender x Ethnicity repeated measures MANCOVA was performed using each of the five microsystem-specific hassles scores as dependent variables, controlling for whether the transition was to junior versus senior high school; this analysis was contrasted with a parallel ANCOVA using the total daily hassles scale as the dependent variable. Both the multivariate and univariate analyses revealed statistically significant temporal effects across the school transition, F(5, 805) = 33.69, p < .001, ES = .17, and F(1, 839) = 42.37, p < .001, ri 2 = .05, respectively. Although the multivariate repeated measures effect was accounted for by all microsystem factors except family hassles, the direction of the changes differed by microsystem. As expected from the decrement over time for the total score, peer, F(1, 809) = 63.13, p < .001, rl 2 = .07, resource, F(1, 809) = 63.53, p < .001, rl 2 = .07, and neighborhood, F(1, 809) = 45.05, p < .001, rl 2 = .05, hassles all decreased significantly. However, for the school microsystem, hassles increased significantly across the transition, F(1, 809) = 14.50, p < .001, rl 2 = .02.
Involvement
Structural Analyses For the total sample, the hypothesized four-factor structure was insufficient. Conceptual clarity and the scree criterion suggested a six-factor structure that accounted for 49% of the total variance and 38% of the common variance. As shown in Table III, the four postulated microsystem factors were found with two additional variations: an extra neighborhood factor and a sports/athletic involvement factor. The neighborhood involvement items split into two factors, I and VI. Factor I, labeled neighborhood-action involvement, consisted of seven items representing community participation (e.g., helping to organize) and accounted for 20% of the common variance. Factor VI, labeled neighborhood-social involvement, consisted of three items and accounted for 2% of the common variance. Two items reflected social involvement in the neighborhood, but the third item, which had a low loading (.33) was from the family microsystem ("watching TV or videos"). Thus, the neighborhood-social subscale was scored as a two-item factor. Factor IV, the other nonhypothesized factor, was labeled sports~athletic involvement, and accounted for 3% of the common variance. It consisted of two items written for the family and two items written for the peer microsystem, but the content of all four focused on sports and athletic activities.
Microsystem Scales
377
The remaining three factors were congruent with the school, family, and peer microsystems. Factor II, labeled school involvement, consisted of nine items; all were concerned with involvement in a wide array of school activities and accounted for 7% of the common variance. Factors III and V, labeled family involvement and peer involvement, consisted of four familyand three peer-related activities and accounted for 3 and 2% of the common variance, respectively. This six-factor solution was manifest in all gender, cohort, and ethnicity subsample analyses with one exception. For the black subsample, based on the scree criterion, a five-factor solution was empirically as well as conceptually clearer. Three of the four sports/athletics involvement items, except one family item, were incorporated into the peer microsystem factor for the optimal black subsample solution. Overall, the six-factor structure was a good representation of the microsystem structure for involvement.
lntemal Consistency The microsystem-specific alpha coefficients (range: .62-.84; see Table III) are adequate though, of course, smaller than the internal consistency coefficient of the 29-item total involvement intensity scale (ct = .87). (Two items had very low loadings [watching TV or video with family/friends] and were dropped from the total involvement scale.) Once again, alpha coefficients for each microsystem were computed separately within each of the demographic subsamples and compared. Of 30 comparisons, 12 were statistically significant, though only 2 of these differences were replicated in Wave 1. Both significant differences occurred for ethnicity on the neighborhood-social factor, the two-item scale with low internal consistency reliability: blacks and Latinos were more internally consistent than whites.
Test-Retest Reliability4 For the family, peer, school, neighborhood-social, neighborhood-action, and sports/athletic subscales, the test-retest coefficients were .42, .53, .38, .32, .44, and .51, respectively. Again, as expected, the school microsystem manifested the lowest temporal stability. 4"1"o calculate these test-retest reliability coefficients, we dropped the academic activity item from the school factor since it was not included in Wave 1 data collection, and altered the format of the neighborhood-action items to a dichotomous format in order to replicate the format of these items in Wave 1.
Seidman et al.
378
Validity For each involvement microsystem score, the specific nature of demographic differences is displayed by the Gender x Cohort x Ethnicity means presented in Table VI. A 2 x 2 x 3 M A N O V A revealed multivariate main effects for gender, F(6, 818) = 11.69, p < .001, ES = .08; cohort, F(6, 818) = 16.37, p < .001, ES = .11; and ethnicity, F(12, 1638) = 2.80, p < .01, ES = .02; and no significant two- or three-way interaction effects. The multivariate gender effect was accounted for primarily by the differences in involvement with sports/athletics, F(1, 823) = 40.84, p < .001, rl 2 = .05; socializing in the neighborhood, F(1, 823) = 4.43, p < .05, rl 2 = .01; and being active in the neighborhood, F(1, 823) = 4.26, p < .05, ~2 = .01. Males r e p o r t e d m o r e sports/athletic and neighborhood-action engagement, whereas females reported greater neighborhood-social involvement. The multivariate cohort effect was accounted for by all microsystem factor scores, except neighborhood-social: family, F(1, 823) = 23.79, p < .001, rl 2 = .03; peer, F(1, 823) = 16.96, p < .001, 112 = .02; school, F(1, 823) = 34.23, p < .001, 1]2 = .04; neighborhood-action, F(1, 823) = 14.07, p < .001, rl 2 = .02; and sports/athletics, F(1, 823) = 14.15, p < .001, rl 2 = .02. Young cohort youth reported greater family, school, and neighborhood action engagement, while older cohort youth reported greater engagement with peers. The multivariate ethnicity effect was accounted for primarily by peer, F(2, 823) = 5.12, p < .05, 112 = .01, and neighborhood-social, F(2, 823) = 3.59, p < .05, 112 = .01: Whites reported greater social activity with their peers and in their neighborhoods than blacks and Latinos. Next, a Gender x Ethnicity repeated measures M A N C O V A was performed using each of the six microsystem-specific involvement scores as dependent variables, controlling for whether the transition was to junior versus senior high school; this analysis was contrasted with a parallel ANC O V A using the total involvement scale as the dependent variable. 5 Both the multivariate and univariate analyses revealed statistically significant temporal effects across the school transition, F(6, 670) = 8.80, p < .001, ES = .07; and F(1,736) = 10.34, p < .01, 112 = .01, respectively. Although the multivariate repeated measures effect was accounted for by four of the six microsystem factors (all but sports/athletics and neighborhood-action), the direction of the changes differed by microsystem. As expected from the decrement in participation over time for the total score, youth involvement with family, F(1, 675) = 12.25, p < .001, 112 = .02, and neighborhood5Due to the dichotomous format of some of the items in Wave 1 (see Footnote 4), the entire scale for this ANCOVA was dichotomized. In the MANCOVA, only the neighborhood-action factor was dichotomized, and the academic activity item from the school factor was again dropped (see Footnote 4).
Microsystem Scales
379
t'qO~
o O t'r t ' ~ v--4
r
f'q~
,.4
o-~ .r-4
~t"q
o O v--4
r162 v-4
t"4~
.q" ,--4
"O
•
O~O~
~DU~
"O r-
•
v--4
O~OO
C',l tt'~ '~'V3
O
r~'q"
t ' ~ v--4
t ' ~
Cr
OOt~l t~
f'q~ OOl'~
,--4
t'~q O~
T--s
t"q I r ~ ,--4~
r~OO t ~
~O0
OOt'q
t'q~
v--4 e-4
cr
v.-~
r
-e-4
O0~ t'q~
~fr~ t'q~
cr
v.-4
"q" "~-4
C ~ 'q:l" t~
OOOO
~r
"q- ~-4
,-'t
OOU~ U'~ ,e.-4
U"
t'~oO
tr3~
9q - ,~-s
t~e-s
U'-~O ~OO~
OCr~
v-'4~
t t 3 r162
e-~ e-q
~o 8
? "O O O r-~ A:I
380
Seidman et al.
social activities, F(1, 675) = 22.28, p < .001, 112 = .03, decreased over the course of a year. However, involvement with the peer microsystem increased significantly, F(1, 675) = 9.59, p < .01, rl 2 = .01.
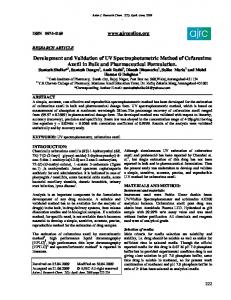
Perceived Microsystem Factor Score Intercorrelations A correlation matrix of the perceived microsystem factor scores is presented in Table VII. Given the large sample, many of the correlations manifest statistical significance even though they account for a minimal amount of variance. Observation of the within-construct factor intercorrelations reveals a dominant pattern of significant correlations in contrast to the acrossconstruct correlations. (Since factor scores were computed with unit as opposed to absolute weights, the magnitude of the within-construct correlations is artificially inflated.) Nevertheless, in absolute terms, the correlations within social support/cohesion are low, while those within daily hassles and involvement are modest. The pattern of across-construct correlations suggests modest relationships for the same microsystem across constructs. For social support and daily hassles, the pattern of relationships, as expected, is inverse, except for the peer microsystem. Across the social support and involvement constructs, the same microsystems are positively related. Microsystem relationships between involvement and daily hassles are weak. DISCUSSION We were successful in developing and refining instruments to tap the ecological transactions of support/cohesion, daily hassles, and involvement specific to family, peer, school, and neighborhood microsystems for culturally diverse, urban adolescents. For each construct, the four-factor microsystem structure was confirmed, and in the cases of hassles and involvement, the structure was delineated even further. The utility of the three-item daily hassles and involvement for peers and two-item neighborhood-social involvement microsystem scales should be enhanced in the future by the development and validation of additional items. The internal consistency of the microsystem factors ranged from adequate to good and the pattern of stability coefficients among the microsystems were meaningful. In general, the differential pattern of effects among microsystem factors on social support, daily hassles, and involvement in terms of gender, ethnicity, and age cohort validate the salience of microsystem specificity. Moreover, analyses of microsystem-specific factors across a school transition also point to the greater specificity and potential utility of microsystem-specific
Microsystem Scales
381
I ~
I I
0
I::
I I I
oo~
9
8
9
8
I"
I
"
"
I"
"
I I I I
I
I
I
t
I'I'I'I'I"
I
I
I
I
I
I
I
I
!
o
.o
0
r
. . . .
0
~ 0
0
vv ~,.~
382
Seidman et al.
scores when compared to a global assessment. The assessment of microsystem specificity is critical if we are to accurately understand how mediating processes influence the relationship between risk factors and developmental outcomes. We now turn to discussions of the utility, meaningfulness, and action implications of microsystem-specific processes and assessment. We discuss these issues for support, daily hassles, and involvement as each pertains to the lives of culturally diverse urban adolescents.
Support~Cohesion It is not surprising that the three-factor microsystem structure of social support emerged, as it has been found, at least in part, by several other investigators (Cauce et al., 1982; Procidano & Heller, 1983). In our refinement of the social support scale, we tapped multiple functions (emotional, instrumental, and satisfaction) and providers (family, peers, and school). Consistent with earlier work, the microsystem or provider model proves stronger than the functional model in determining the ultimate factor structure (Cauce et al., 1990). By tapping cohesive or supportive transactions with the neighborhood, a comprehensive assessment of the affective quality of transactions across all four microsystems is achieved. The proposed four-factor microsystem structure of support/cohesion is common across gender, ethnicity, and age cohort; however, there are important demographic differences on several microsystem factors. These differences would have been obscured without a microsystem-specific assessment. Confirming previous studies (Berndt, 1988; Cauce et al., 1982; Rowlison & Felner, 1988; Slavin & Rainer, 1990; Youniss & Smollar, 1985), females perceived greater support from the peer microsystem than males did, but unlike previous studies, we found that males perceived greater family support than females. Univariate effects for gender were not manifested for the school and neighborhood microsystems. Young cohort youth perceived more support than the older cohort from family, school, and neighborhood, but not from peers. In part, these findings are consistent with the developmental phenomena of younger adolescents perceiving closer ties and support from families. Family support declines during adolescence, while peer support takes on new meaning and importance (Csikszentmihalyi & Larson, 1984). However, the interaction for family support between gender and age reported by Cauce et al. (1982) was not replicated.
Microsystem Scales
383
Whites reported perceiving more support than blacks and Latinos did from family, peer and neighborhood, but less support from school. It should be recalled that more black and Latino youth lived in poor and concentrated poverty neighborhoods than did white youth. Since the poverty of the neighborhood has been associated with a host of negative life events and stressors (e.g., Gephart, 1989), youth residing in these neighborhoods may be less likely to perceive support from family, friends, and neighbors. On the other hand, for relatively more advantaged white students who perceive greater support from family, peers, and neighborhood, school may be less important as a source of support. Perceived support and neighborhood cohesion decreased across school transitions; however, the multivariate analyses revealed that this decrement was accounted for almost exclusively by a drop in perceived support from school personnel. A school transition does not lead to a disjuncture in the transactions with one's family or neighborhood, or even peers if they are out-of-school peers, as it does with teachers and other school personnel. One set of teachers, guidance counselors, and principals are abruptly replaced by a new set after a school transition. Relationships, and the support that comes from them, have to be re-established anew (Seidman, et al., 1994). This finding illustrates precisely how a microsystem-specific model can pinpoint crucial social regularities (Seidman, 1988) and mediating processes. If school transitions are to remain part of the United States educational system, careful attention should be directed toward restructuring the school environment in such a fashion that each student continues to have an adult contact in the school whom they perceive as supportive.
Daily Hassles We confirmed the postulated microsystem structure for daily hassles with one additional refinement. In addition to peer, school, and neighborhood hassles, family hassles split into two aspects, one representing hassles attributable to family conflict and the other due to a lack of resources. The family, peer, and school factors of the Fenzel (1989b) and Bobo et al. (1986) structures were replicated. The school hassles factor was closer to Fenzel's (1989b) factor of school demands, but we did not include a sufficient number of items measuring teacher relations. On the other hand, the emergence of a resource hassles factor in our data is most likely a result of having developed the instrument on a population of urban youth living in economically disadvantaged neighborhoods. These youth often experience considerable strain because of the lack of available resources--an experience uncommon to the lives of most of the middle-class youth in
384
Seidman et al.
previous studies. For the white sample, who were not primarily from poverty neighborhoods, resource hassles were not distinct from other family hassles. With regard to gender differences, females reported greater peer hassles than did males, yet, they also reported greater peer support. The peer microsystem seems to be more salient and influential in the lives of adolescent girls, both in terms of its demandingness and its positive benefits. In some instances females were more susceptible to peer influence than males (for a review, see Brown, 1990). In addition, females perceived greater hassles than males did over the lack of resources. Having to share a bedroom or bathroom and not having enough nice clothes may produce more strain among adolescent females than males. The differential utility of the microsystem assessment of daily hassles is further augmented by the fact that differences were manifested between age cohorts for family and school hassles, but not peer hassles. Not surprisingly, older youth reported more family and school hassles than did younger adolescents. At the same time, as previously noted, older adolescents reported less support from family and school. The ethnic differences in daily hassles within different microsystems also highlights the importance of microsystem-specific assessment. Whites experienced less intense neighborhood hassles than did Latinos or blacks. Similarly, whites experienced fewer resource-related hassles. The reader will recall that the Latino youth come from the poorest neighborhoods and the white youth from primarily working-class neighborhoods. This suggests the importance of neighborhoods as a locus of intervention if we are to reduce the hassles that our most economically disadvantaged youth are subjected to daily. Perceived hassles with peers, neighborhood, and resources declined across a school transition, as did total hassles, although school hassles increased. The hassles initiated by the disjuncture of a school transition were microsystem-specific, as were the changes in perceived support (Seidman et al., 1994). Once again, both the critical mediating processes and the implications for restructuring schools are underscored. Involvement
For involvement, we found an expanded structure. While we did indeed identify family, peer, school, and neighborhood microsystem factors, the neighborhood microsystem was further differentiated into social involvement and community action. In addition, attending and participating in athletic events with family or friends formed its own unique functional
Microsystem Scales
385
factor in all subsamples except for the black subsample; here, attendance and participation in athletic events emerged mostly as part of the peer microsystem. Use of these two variations on the postulated four-factor microsystem structure of involvement allows us even greater specificity in examining future questions of how microsystem participation might mediate the relations between risks and developmental outcomes. The utility of the microsystem-specific assessment of involvement is supported by the gender and cohort difference findings. Not surprisingly, the gender difference that accounted for the largest portion of variance was involvement with sports/athletics. Males reported greater engagement in sports activities and neighborhood community activities, whereas females reported greater socializing in the neighborhood. There were no significant gender differences within the family, peer, or school microsystems. Younger youth reported greater involvement in most of the microsystems than older youth did. The older cohort adolescents reported greater engagement with peers than the young cohort youth did (see also Savin-Williams & Berndt, 1990). The changes associated with a school transition are consistent with the developmental differences between the young and old cohorts: Involvement with family and neighborhood-social activities declined, while engagement with peers increased. Conclusions
In this study, we report the development and validation of a set of instruments to tap the microsystem-speciflcity of critical transactional processes-perceived support/cohesion, daily hassles, and involvement--for culturally diverse, urban adolescents. The appropriateness and utility of this set of instruments for middle-class, rural and/or suburban youth has yet to be demonstrated. However, for the target population, our ability to assess these perceived microsystem-speciflc processes may afford us a more complete understanding of how they mediate the influence of risk on developmental outcomes in future research. These mediating processes are less immutable than many risk and protective bases (e.g., ethnicity, parental death), and thus, emerge as important loci for preventive interventions. REFERENCES Berndt, T. J. (1988). The nature and significance of children's friendships. In R. Vasta (Ed.), Annals of Child Development (Vol. 5, pp. 155-186). Greenwich, CT: JAI. Bobo, J. K., Gilchrist, L D., Elmer, J. F., Snow, W. H., & Schinke, S. P. (1986). Hassles, role strain, and peer relations in young adolescents. Journal of Early Adolescence, 6, 339-352.
386
Seidman et al.
Bronfenbrenner, U. (1979). The ecology of human development: Experiments by nature and design. Cambridge, MA: Harvard University Press. Brown, B. B. (1990). Peer groups and peer culture. In S. S. Feldman & G. R. Elliott (Eds.), At the threshold: The developing adolescent (pp. 171-196). Cambridge, MA: Harvard University Press. Buekner, J. C. (1988). The development of an instrument to measure neighborhood cohesion. American Journal of Community Psychology, 16, 771-791. Cattell, R. B. (1966). The scrce test for the number of factors. Multivariate Behavioral Research, 1, 245-276. Cauce, A., Felner, R. D., & Primavera, J. (1982). Social support in high-risk adolescents: Structural components and adaptive impact. American Journal of Community Psychology, 10, 417-428. Cauce, A. M., Hannan, K., & Sargeant, M. (1992). Life stress, social support, and locus of control during early adolescence: Interactive effects. American Journal of Community Psychology, 20, 787-798. Cauce, A. M., Reid, M., Landesman, S., & Gonzales, N. (1990). Social support in young children: Measurement, structure, and behavioral impact. In B. Sarason, I. Sarason, & G. Pierce (Eds.), Social support: An interactional view (pp. 64-94). New York: Wiley. Cauce, A. M., & Srebnik, D. S. (1989). Peer networks and social support: A focus for preventive efforts with youth. In L. A. Bond & B. E. Compas (Eds.), Primary prevention and promotion in the schools (pp. 235-254). Newbury Park, CA: Sage. Cohen, J., & Cohen, P. (1983). Applied multiple regression~correlationanal,sis for the behavioral sciences. Hillsdale, NJ: Erlbaum. Csikszentmihalyi, M., & Larson, R. (1984). Being adolescent. New York: Basic Books. Dohrenwend, B. S., Dohrenwend, B. P., Dodson, M., & Shrout, P. E. (1984). Symptoms, hassles, social supports and life events: The problem of confounded measures. Journal of Abnormal Psychology, 93, 220-230. DuBois, D. L., Felner, R. D., Brand, S., Adan, A. M., & Evans, E. G. (1992). A prospective study of life stress, social support, and adaptation in early adolescence. Child Development, 63, 542-557. Eccles, J. S., & Midgley, C. (1989). Stage/environment fit: Developmentally appropriate classrooms for young adolescents. In R. E. Ames & C. Ames (Eds.), Research on motivation in education (Vol. 3, pp. 139-186). New York: Academic Press. Fenzel, L. M. (1989a). Role strains and the transition to middle school: Longitudinal trends and sex differences. Journal of Early Adolescence, 9, 211-226. Fenzel, L. M. (1989b). Role strains in early adolescence: A model for investigating school transition stress. Journal of Early Adolescence, 9, 13-33. Fine, G. A., Mortimer, J. T., & Roberts, D. F. (1990). Leisure, work, and the mass media. In S. S. Feldman & G. R. Elliott (Eds.), At the threshold: The developing adolescent (pp. 225-252). Cambridge, MA: Harvard University Press. Fitzgerald, P. (1991, April). Social support from ramie, and friends is not necessarily the same. Paper presented at the Biennial Meeting of the Society for Research in Child Development, Seattle, WA. Furman, W., & Buhrmester, D. (1985). Children's perceptions of the personal relationships in their social networks. Developmental Psychology, 21, 1016-1024. Garton, A. F., & Pratt, C. (1991). Leisure activities of adolescent school students: Predictors of participation and interest. Journal of Adolescence, 14, 305-321. Gephart, M. A. (1989). Neighborhoods and communities in concentrated poverty. Items, 43, 84-92. Graham, S. (1992). "Most of the subjects where white and middle class": Trends in published research on African Americans in selected APA journals, 1970-1989. American Psychologist, 47, 629-639. Hartup, W. W. (1983). Peer relations. In E. M. Hetherington (Ed.), Handbook of child psychology: Socialization, personality, and social development (Vol. 4, pp. 103-196). New York: Wiley.
Micrnsystem Scales
387
Hirsch, B. J., & DuBois, D. L. (1992). The relation of peer social support and psychological symptomatology during the transition to junior high school: A two-year longitudinal analysis. American Journal of Community Psychology, 20, 333-347. Holland, A., & Andre, T. (1987). Participation in extracurricular activities in secondary school: What is known, what needs to be known? Review of Educational Research, 57, 437-466. Hughes, D., Seidman, E., & Williams, N. (1993). Cultural phenomena and the research enterprise: Toward a culturally anchored methodology. Amer/can Journal of Community Psychology, 21, 687-704. Hutchinson, R. (1987). Ethnicity and urban recreation: Whites, Blacks, and Hispanics in Chicago's public parks. Journal of Leixure Research, 19, 205-222. Kanner, A. D., Coyne, J. C., Schaefer, C., & Lazarus, R. S. (1981). Comparison of two modes of stress measurement: Daily hassles, uplifts and major life events to health status. Journal of Behavioral Medicine, 4, 1-39. Lanza, A. F., Cameron, A. E., & Revenson, T. A. (in press). Helpful and unhelpful support among individuals with rheumatic diseases. Psychology and Health: An International
Journal Lazarus, R. S., & Folkman, S. (1984). Stress, appraisal and coping. New York: Springer. I~rner, R. M. (1986). Concepts and theories of human development (2nd ed.). New York: Random House. Mitchell, R. E., & Trickett, E. J. (1980). Task Force Report: Social networks as mediators of social support. An analysis of the effects and determinants of social networks. Community Mental Health Journas 16, 27-44. Moos, R. H., Cronkite, R. C., Billings, A. G., & Finney, J. W. (1984). Health and Dai~ Living Form Manual. Palo Alto, CA: Social Ecology Laboratory, Veterans Administration and Stanford University Medical Centers. Peadin, L. I., & Lieberman, M. A. (1979). Social sources of emotional distress. Research in Community Mental Health, 1, 217-248. Procidano, M. E., & Heller, K. E. (1983). Measures of perceived social support from friends and from family: Three validation studies. American Journal of Community Psychology,
11, 1-24. Rowlison, R., & Felner, R. D. (1988). Major life events, hassles and adaptation in adolescence: Confounding in the conceptualization and measurement of life stress and adjustment revisited. Journal of Personality and Social Psychology, 55, 432-444. Savin-Williams, R. C., & Berndt, T. J. (1990). Friendship and peer relations. In S. S. Feldman & G. R. Elliott (Eds.), At the threshold: The developing adolescent (pp. 277-307). Cambridge, MA: Harvard University Press. Seidman, E. (1983). Introduction. In E. Seidman (Ed.), Handbook of social intervention (pp. 11-17). Beverly Hills: Sage. Seidman, E. (1988). Back to the future, Community Psychology: Unfolding a theory of social intervention. American Journal of Community Psychology, 16, 3-24. Seidman, E. (1991). Growing up the hard way: Pathways of urban adolescents. American Journal of Community Psychology, 19, 173-205. Seidman, E., Allen, L., Aber, J. L., Mitchell, C., & Feinman, J. (1994). The impact of school transitions in early adolescence on the self-system and perceived social context of poor urban youth. Child Development, 65, 507-522. Siavin, L. A. (1991). Validation studies of the PEPSS, a scale to measure emotional support among adolescents. Journal of Adolescent Research, 6, 316-335. Slavin, L. A., & Rainer, K. L. (1990). Gender differences in emotional support and depressive symptoms among adolescents: A prospective analysis. American Journal of Community Psychology, 18, 407-421. SPSS Inc. (1991). SPSS statistical algorithms (2nd ed.). Chicago: Author. Trickett, E. J., Kelly, J. G., & Todd, D. M. (1972). The social environment of the high school: Guidelines for individual change and organizational redevelopment. In S. E. Golann, & C. Eisdorfer (Eds.), Handbook of community mental health (p. 331-406). New York: Appleton-Century-Crofts.
388
Seidman et al.
Wolchik, S. A., Beals, J., & Sandier, I. N. (1989). Mapping children's support networks: Conceptual and methodological issues. In D. Belle (Ed.), Children's social networks and social support~ (pp. 191-220). New York: Wiley. Youniss, J., & Smollar, J. (1985). Adolescent relations with mothers, fathers, and friends. Chicago: University of Chicago Press.