http://dx.doi.org/10.1590/s2175-97902017000115181
Development and validation of alternative methods by non-aqueous acid-base titration and derivative ultraviolet spectrophotometry for quantification of sildenafil in raw material and tablets Taízia Dutra Silva*, Cibele Rodrigues Toledo, Cristina Duarte Vianna-Soares Department of Pharmaceutical Products, Faculty of Pharmacy, Federal University of Minas Gerais, Belo Horizonte, MG, Brazil
Sildenafil citrate (SILC) is a potent phosphodiesterase-5 inhibitor used for erectile dysfunction and pulmonary hypertension. This study shows two simple, fast and alternative analytical methods for SILC determination by non-aqueous titration and by derivative ultraviolet spectrophotometry (DUS) in active pharmaceutical ingredient and/or dosage forms. The quantitation method of SILC active pharmaceutical ingredient by non-aqueous acid-base titration was developed using methanol as solvent and 0.1 mol/L of perchloric acid in acetic acid as titrant. The endpoint was potentiometrically detected. The non-aqueous titration method shows satisfactory repeatability and intermediate precision (RSD 0.70-1.09%). The neutralization reaction occurred in the stoichiometric ratio 1:1 in methanol. The determination of SILC active pharmaceutical ingredient or dosage forms by DUS was developed in the linear range from 10 to 40 µg/mL, in 0.01 mol/L HCl, using the first order zero-peak method at λ 256 nm. The DUS method shows selectivity toward tablets excipients, appropriate linearity (R2 0.9996), trueness (recovery range 98.86-99.30%), repeatability and intermediate precision in three concentration levels (RSD 1.17-1.28%; 1.29-1.71%, respectively). Therefore, the methods developed are excellent alternatives to sophisticated instrumental methods and can be easily applied in any pharmaceutical laboratory routine due to simple and fast executions. Uniterms: Sildenafil citrate. Vasodilator. Derivative ultraviolet spectrophotometry. Non-aqueous acidbase titrimetry. Sildenafil citrate/quality control.
INTRODUCTION Sildenafil citrate (SILC, Figure 1) is a potent 5-fosfodiesterase (PDE-5) inhibitor with a pharmacological effect through an increase in intracellular concentration of cyclic guanosine monophosphate (cGMP), a potent vasodilator. SILC is a compound of the pyrazolopyrimidinyl-methyl piperazine class used not only for erectile dysfunction treatment but also for pulmonary arterial hypertension (Escribano, Jimínez, Calzada, 2005; American College of Cardiology Foundation; American Heart Association, 2009; Galiè et al., 2010, Sawatdee, Phetmung, Srichana, 2013). Since the patent of the reference medicine Viagra® (Pfizer Laboratories Ltd.) expired in 2010, many generic *Correspondence: T. D. Silva. Departamento de Farmácia. Faculdade de Ciências Biológicas e da Saúde. Universidade Federal dos Vales do Jequitinhonha e Mucuri, Campus JK. Rodovia MGT 367, Km 583, n° 5000, 39100-000, Diamantina, MG, Brasil. E-mail:
[email protected] Braz. J. Pharm. Sci. 2017;53(1):e15181
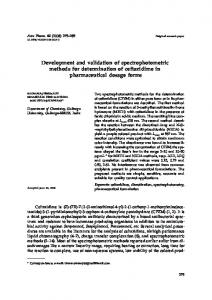
FIGURE 1 - Chemical structure of vasodilator sildenafil citrate,
MM 666.70 g/mol.
drug companies were able to bring out to the market similar dosage forms with lower prices. Moreover, the trend of the number of pharmaceutical companies around the world, that will produce drugs containing SILC, is to increase. Compounding pharmacies also aim the production in a smaller scale of the different formula containing SILC, as their dispensation is commonly high due to the PDE5 inhibitor popularity. Therefore, in order to assure the manufacturing uniformity for the treatment of erectile dysfunction or pulmonary hypertension, as well as for quality Page 1 / 12
Article
Brazilian Journal of Pharmaceutical Sciences
T. D. Silva, C. R. Toledo, C. D. Vianna-Soares
control purposes, it is important to establish alternative validated methods that can be performed as a simple and fast drug quantitation in either the active pharmaceutical ingredient (API) or the pharmaceutical dosage forms. Furthermore, with a simple and fast development of standard analytical methods for SILC it is possible to support the pharmacovigilance, once SILC tablets have frequently been a target of contraband and counterfeit (Ortiz, Antunes, Linden, 2010; Ames, Souza, 2012). There are several methods described in the literature for SILC API determination or dosage forms by various techniques. Most of these methods are based on the high-performance liquid chromatography (HPLC) or ultra-performance liquid chromatography (UPLC) using UV-Vis or mass detectors, however, they require several pieces of expensive reagents/equipments (Gratz, Flurer, Wolnik, 2004; De Orsi et al., 2009; Song, El-Demerdash, Lee, 2012; Damiano et al., 2014; Fejos et al., 2014). Methods based on the formation of colored complexes for the determination of SILC in tablets have also been described by visible spectrophotometry (Amin, ElBeshbeshy, 2001; Dinesh et al., 2002; Salem, 2006; Weinert, Pezza, Pezza, 2008; Issa et al., 2010; Frag, Mohamed, Alelaiwe, 2011a). Spectrofluorimetry and electroanalytical methods such as voltammetry using different electrodes were exploited by several researchers (Othman, Rizk, El-Shahawi, 2004; Hassan et al., 2006; Tyszczuk, Korolczuk, 2010; Wang et al., 2010; Balasoiu et al., 2011; Frag, Mohamed, Alelaiwe, 2011b; Wang, Gómez, Fernandez, 2013). However, these methods are laborious to be performed since they demand several types of reagents or sample treatment or involve many reactions steps and/or extraction processes for a quality control routine. The titrimetry of several API based on chemical reactions of neutralization, oxi-reduction, precipitation or complexation can be found in the pharmacopeias. They show many advantages such as the ease of execution, a small consumption and simplicity/availability of reagents, the low cost, with precise and reliable results. Such features make the titration an excellent alternative to instrumental sophisticated analytical methods for the SILC raw material’s determination because it can be easily applied by any pharmaceutical company or compounding pharmacy in the drugs’ routine quality control. The non-aqueous acid-base titrimetry is used more to quantify weak acids or bases, which do not provide a well-defined endpoint in the aqueous solvent. Moreover, this technique allows working with many water-insoluble substances when dissolved in appropriate organic solvents (USP, 2013a; BRITISH Pharmacopoeia, 2014). Pure substances can be titrated directly; however it is often Page 2 / 12
necessary to isolate the API in pharmaceutical preparations from any interfering excipients. The environmental contamination and operator exposure to the organic solvents are reduced with the use of a small volume burette (such as 5.00 or 10.00 mL), or better, with the utilization of an automatic titrator, under the hood. The derivative ultraviolet spectrophotometry (DUS) is widely used as an analytical tool in the medicines quality control for drug determination in multicomponent systems. This technique is simple and fast and allows the interference elimination of placebo, impurities or degradation products, improving the selectivity without a need of sample pre-treatment or drug extraction (Rojas, Ojeda, 2009; Donato et al., 2010). A non-aqueous acid-base titrimetry and a DUS were chosen for the SILC analysis due to its simplicity and fastness. In addition, these analysis methods bear a lower cost, compared to methods such as liquid chromatography, and have a greater chance of application in compounding pharmacies and the majority of laboratory providers of routine quality control certificates. Therefore, the aim of this work is to develop simple and alternative methods for the SILC API quantitation and dosage forms by titration in non-aqueous media and by DUS.
MATERIAL AND METHODS Material and reagents
SILC working standard (99.69% purity; batch UT2100403; Ultratech India Limited, New Mumbai, India) and SILC 25 mg and 100 mg tablets (Sollevare®) were kindly donated by Vita Nova Institute (Hortolândia, SP, Brazil). Placebo was prepared using excipients: anhydrous calcium hydrogenated phosphate; hypromellose; magnesium stearate; lactose (Ipiranga Química, Santos, SP); blue aluminum lake color; croscarmellose sodium (Blanver, Taboão da Serra, SP); microcrystalline cellulose Microcel® MC102 (Colorcon do Brasil, São Paulo, SP); polyethylene glycol (PEG) 4000 (LabSynth, Diadema, SP); titanium dioxide (JB Química Indústria e Comércio Ltda, Suzano, SP, Brazil). Methanol (Tedia Company, Fairfield, IO, USA); hydrochloric acid; perchloric acid; glacial acetic acid (Merck, Darmstadt, Germany). All chemicals and reagents were of analytical grade. Instrumental
An ultrasonic cleaner (1400, Unique; Indaiatuba, SP, Brazil), a centrifuge (Jouan B4i, Thermo Scientific; Braz. J. Pharm. Sci. 2017;53(1):e15181
Development and validation of alternative methods by non-aqueous acid-base titration and derivative ultraviolet spectrophotometry
Waltham, MA, USA), a dry oven (306/1, Fanem; São Paulo, SP, Brazil) were used. For the non-aqueous acid-base titrimetry of SILC raw material was used an automatic titrator (DL53, Mettler Toledo; Columbus, OH, USA) equipped with a burette (resolution 0.002 mL) and a proper combined glass electrode. DUS method for the quantitation of SILC in bulk drug and tablets was performed in a Shimadzu 1800 UVVisible spectrophotometer (Shimadzu, Tokyo, Japan) with photodiode array detector. UV probe software version 2.33 was used for data acquisition. The absorption spectra were scanned using 1 cm quartz cells. SILC active pharmaceutical ingredient determination by non-aqueous acid-base titrimetry
For the non-aqueous acid-base titrimetry of the API about 200 mg of SILC, previously dried (105 °C, 5 h, dry heat), were accurately weighed and dissolved in 40 mL of solvent previously neutralized. The solvents tested were glacial acetic acid and methanol. The samples were sonicated for 10 min. A volumetric solution (VS) of 0.1 mol/L HClO4 in acetic acid, previously standardized with potassium biphthalate, was used as titrant. The titration was preceded by 90 s of mechanical agitation in the automatic titrator for drug dissolution. The endpoint was indicated potentiometrically. The repeatability and intermediate precision were evaluated by means of analysis of average content of six SILC replicates dissolved in methanol, in two days. SILC active pharmaceutical ingredient determination and dosage form by DUS
All SILC or placebo’s solutions were dissolved and diluted in 0.01 mol/L HCl. Parameters for the optimization were selected in the range from λ 200 to 400 nm. The absorption measurement in the first order of derivative (D1) using the zero-peak method was at λ 256 nm; the differential wavelength selected was λ 2 nm for a medium scan speed. Validation The parameters studied in the DUS method validation were selectivity, linearity, matrix effect, recovery, precision, detection limit, quantitation limit and robustness. These parameters were considered in order to verify the fitness for the purpose of the method (International Conference on Harmonization, 1996; Thompson, Ellison, Wood, 2002). The significance levels in hypothesis tests were α = 0.05. Braz. J. Pharm. Sci. 2017;53(1):e15181
The DUS method selectivity was evaluated using a placebo containing excipients commonly used in the SILC tablets manufacturing: anhydrous calcium hydrogenated phosphate (diluent, 36%); microcrystalline cellulose (diluent, 36%); croscarmellose sodium (disintegrant, 5.0%); magnesium stearate (lubricant, 5.0%) and coating constituents as blue aluminum lake color (0.6%); hypromellose (0.5%); lactose (4.0%); PEG 4000 (0.1%) and titanium dioxide (0.4%). To verify the selectivity in D1, SILC solutions of 25 µg/mL and placebo were prepared in triplicate. The placebo solutions containing proportional amounts of excipients compared to a 25 µg/mL SILC from a dosage form solution were also prepared in the same solvent, 0.01 mol/L HCl, in triplicate. SILC and placebo solutions were separately scanned and overlapped in the D1 in the range λ 200-400 nm, and evaluated for any potential interference at λ 256 nm. The DUS linearity method was evaluated using SILC standard solutions in the concentration range from 10 to 40 µg/mL in 0.01 mol/L HCl. The calibration curve was prepared at five concentration levels, in three independent replicates. The ordinary least squares method (OLSM) was applied to the experimental data to estimate the regression parameters. This method assumes that the residuals are normally distributed, homoscedastic, independent of each other and that the model is linear (Draper, Smith, 1998). Violations of assumptions underlying OLSM residuals were evaluated by the following tests: residual normality by Ryan-Joiner, homoscedasticity by Brown-Forsythe and independence by Durbin–Watson; F tests were applied to check the regression significance and linearity deviation (Durbin, Watson, 1951; Souza, Junqueira, 2005). The matrix effect in the measurement of analyte concentration was investigated by the comparison of the slopes obtained for the solvent curve with that achieved for the matrix-matched curve by t test. The DUS method validation for repeatability and intermediate precision was performed using SILC 25 mg tablets. SILC solutions at three levels of concentration, 10, 25 and 40 µg/mL, correspondent to 40%, 100% and 160% of the working concentration (25 µg/mL) were prepared in 0.01 mol/L HCl, in triplicate. For the repeatability evaluation of DUS method, twenty units of SILC 25 mg tablets were crushed, and an accurately weighed portion of the powder, equivalent to one average weight, was transferred to a 100 mL volumetric flask followed by the addition of 60 mL of 0.01 mol/L HCl. The dispersions were sonicated for 10 min and the volume was completed with the same solvent to obtain the concentration 250 μg/mL. After Page 3 / 12
T. D. Silva, C. R. Toledo, C. D. Vianna-Soares
centrifugation (10 min, 4,000 rpm) aliquots removed from the supernatant of each stock solution were diluted to final concentrations 10, 25 and 40 µg/mL, in 0.01 mol/L HCl (each in triplicate). The precision, under repeatability and intermediate precision conditions, was estimated by ANOVA and expressed in terms of relative standard deviation (RSD) for the replicates of tablets samples at each level and in three different days (International Organization for Standardization, 1994). The method accuracy was reported as recovery percentage of known amount of SILC standard added to the placebo. An amount of 25 mg SILC standard was added to an equivalent mass of placebo, transferred to 100 mL volumetric flasks containing 60 mL of 0.01 mol/L HCl. The flasks were sonicated for 10 minutes and filled up to the mark with the respective solvents. The dispersions prepared in triplicate, were centrifuged (10 min, 4,000 rpm) and aliquots removed from the supernatant were diluted to final concentrations as described for the precision. The evaluated analytical method accuracy by recovery was calculated according to the equation %R=[CP/CS]×100, where CP is the concentration in a spiked dispersion of placebo, and CS is the standard solution concentration. Limits of quantitation (LOQ), the lowest SILC concentration that can accurately be determined, was calculated by the equation LOQ = 10 sa/b, where sa is the standard deviation of the calibration curve intercept, a; b is the slope of the calibration curve (International Conference on Harmonization, 1996; FDA, 1994). The DUS method robustness was evaluated by assay of sextuplicate 25 µg/mL solutions of SILC tablets and their reference solution in the working concentration 25 µg/mL using different instrumentation: a HP8453 UV-visible (Agilent Technologies, Inc., Santa Clara, CA, USA) with photodiode array detector and HP ChemStation software; and a Shimadzu 1800 UV-Visible with UV probe software version 2.33. The results obtained with the two spectrophotometers were compared by ANOVA and Tukey tests (α = 0.05).
RESULTS AND DISCUSSION SILC active pharmaceutical ingredient determination by non-aqueous acid-base titrimetry
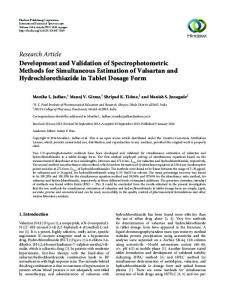
Due to the presence of the functional groups piperazine, pyrimidinone and pyrazole in the sildenafil molecule, as shown in Figure 2, four ionization sites are expected: three of which are basic centers (A, B, C) and one acid center (D). Page 4 / 12
Gobry et al. (2000) have shown the determination of the ionization constant (pKa), in water/methanol, of the most basic nitrogen (A, piperazine, pKa 6.78) which shows sp3 hybridization and the pKa of a weak amide acid group (D, pyrimidinone, sp3, pKa 9.12). Hence, sildenafil is an amphoteric compound with a moderate basicity and a weak acidity for the ionization sites A and D, respectively. The authors mention that the ionization constants for the B and C groups were not determined due to uncertain basicity (Gobry et al., 2000; Wang, Chow, Zuo, 2008). On the other hand, the pKa of the salt molecule, SILC, for the tertiary protonated nitrogen of the piperazine ring, is found to be 8.7 as stated, for instance, in the drug’s reference book Clarke’s Analysis of Drugs and Poisons (Moffat, Osselton, Widdap, 2004).
FIGURE 2 - Potential ionization sites of sildenafil (666.70 g/mol)
in basic functional groups (A) piperazine, (B) pyrimidinone, (C) pyrazole and (D) weak amide acid group. (Adapted from Gobry et al., 2000).
The presence of such groups in the molecule leads to a partial ionization in aqueous solution and a low inflexion endpoint, therefore, requiring a non-aqueous medium for the acid-base titration. Thus, SILC basicity or acidity can be leveled at the hydroxilate or oxonium ions strength, if dissolved in a proper organic leveling solvent capable of evidencing their inflexion point. In the present SILC acid-base titration in non-aqueous solvent, acidic amphiprotic glacial acetic acid was initially tested as the drug solvent because it is more commonly used in the determination of weak organic bases. The titration curve for the accurately weighed mass 200 mg of SILC in this solvent showed two inflection points, as shown in Figure 3a and b in zero and first orders, respectively. The volumes of titrant consumed due to the presence of two equivalence points were detected in 2.89 mL and 6.36 mL, as evidenced in Figure 3a and b. Therefore, the stoichiometric ratio of the reaction was found to be 1 SILC to 2 HClO4. The volumetric factor found for the mass of the analyte reacted with the volume of titrant is equivalent to 33.336 mg of SILC per Braz. J. Pharm. Sci. 2017;53(1):e15181
Development and validation of alternative methods by non-aqueous acid-base titration and derivative ultraviolet spectrophotometry
a differentiation effect, so that the weak basic nitrogens are not titrated in SILC salt molecule. The stoichiometric ratio of titration reaction in this case is 1 SILC to 1 HClO4. The titre found for the mass of the analyte reacting with the volume of titrant is equivalent to 66.671 mg of SILC per milliliter of 0.1 mol/L perchloric acid VS.
FIGURE 3 - Graphical representation of the non-aqueous
titration curves in (a) zero and (b) first order using potentiometric endpoint detection for 200 mg of SILC in glacial acetic acid with volumetric solution of 0.1 mol/L of perchloric acid in acetic acid, as titrant. Volumes of titrant consumed in the two equivalence points detected were 2.89 mL and 6.36 mL.
milliliter of 0.1 mol/L perchloric acid VS, i.e., each mL of titrant is equivalent to 33.336 mg of SILC. The first endpoint was attributed to the citrate ion titration formed by SILC dissociation in the medium as long as the strongest basic group, A (Figure 2), present in the piperazine ring has already been protonated in the SILC molecule. Thus, the drug is titrated indirectly through its counterion, citrate and a displacement of the citrate ion of SILC takes place by the perchlorate ion. The second endpoint was attributed to the weak basic nitrogen titration (B, Figure 2) in the SILC pyrimidinone ring. In acetic acid, the titration of this group was possible because its strength was evidenced due to the solvent leveling effect for weak basic compounds. Similarly, methanol, a neutral amphyprotic organic solvent, was used as a medium free of water for the SILC titration. Unlike observed using glacial acetic acid as solvent, the presence of only one inflection, hence, only one equivalence point was detected by the consumption of 2.70 mL of titrant for the same mass of SILC, due to titration of the citrate ion (Figure 4). The explanation for the observation of only one equivalence point in methanol is that this solvent presents Braz. J. Pharm. Sci. 2017;53(1):e15181
FIGURE 4 - Graphical representation of the non-aqueous
titration curves in (a) zero and (b) first order using potentiometric endpoint detection for 200 mg of SILC in methanol with volumetric solution of 0.1 mol/L perchloric acid in acetic acid, as titrant. Volumes of titrant consumed in the equivalence point was 2.70 mL.
The partial and global reactions of the SILC titration in acetic acid or methanol with 0.1 mol/L perchloric acid in acetic acid are shown in Figure 5. The chemical equation (Figure 5) shows that when the titrant is a strong acid such as perchloric acid dissolved in acetic acid, the latter can act as a base and accept protons donated by perchloric acid, forming acetic acid oxonium (CH3COOH2+) and a very weak base, the perchlorate. The first endpoint of the non-aqueous SILC titration ([RN+H] RCOO-), dissociated in protonated sildenafil (R3N+H) and citrate ion (RCOO-) in either acetic acid or methanol, is attributed to the reaction of strong acetic acid oxonium. The species (CH3COOH2+) easily donates protons to the strong base citrate and, a rapid reaction to regenerate acetic acid and citric acid occurs in the medium. Following the Page 5 / 12
T. D. Silva, C. R. Toledo, C. D. Vianna-Soares
FIGURE 5 - General chemical reaction for the first endpoint of the non-aqueous SILC titration in acetic acid (following the
titration takes up another drug to titrant stoichiometric ratio 1:2), as well as for the single endpoint of SILC titration in methanol (stoichiometric ratio 1:1) using 0.1 mol/L perchloric acid VS as titrant and potentiometric endpoint detection.
titrant addition, SILC takes up another mole of 0.1 mol/L of perchloric acid so that the stoichiometric ratio is 1:2 (drug to titrant), in acetic acid solvent (reaction of the second endpoint not shown). On the other hand, when SILC is dissolved in the differentiating solvent methanol there is no subsequent reaction and the stoichiometric ratio is 1:1. The global reaction shows the displacement of citrate counterion by perchlorate to produce sildenafil perchlorate. Hence, either solvent acetic acid or methanol can be used for the SILC titration of. The use of methanol as the organic solvent was selected due to a less irritant odor than acetic acid and the lower titrant consumption for the same mass of SILC. Therefore, the method using methanol contributes to a lower chemical residue production for the environment; however, it is up to the analyst to choose what is more convenient to their reality. Six replicates of raw material dissolved in methanol were analyzed in two days for determination of repeatability (n=6) and intermediate (n=12) precision. The results for SILC precision and quantitation by nonaqueous acid-base titrimetry are described in Table I. The average content results for SILC determination comply with the established range of purity (98.0-102.0%)
for the active ingredient, as described in the monograph for SILC raw material in United States Pharmacopeia (USP, 2013b). The RSD found values were satisfactory (0.10; b: p>0.05; c: p>critical F; p< 0.001) while the lack of fit from linear model was not significant (F0.05), indicating linearity in the studied concentration range from 10 to 40 µg/mL (Table II). The determination coefficient, R2 was 0.9996 for the analytical curve equation y = (0.00111±0.00001)x + (0.00018±0.0002). No matrix effects were detected, because no significant differences were observed between the slopes achieved for the solvent and matrix-matched curves (p>0.05). The method precision was expressed by the %RSD values of a series of measurements in three nonconsecutive days by different analysts. In Table III, the summarized results are shown for repeatability and intermediate precision for three levels of concentration (triplicate). The %RSD values obtained for repeatability and intermediate precision were satisfactory, not exceeding the maximum acceptable value of 2% or 5%, respectively (Green, 1996; International Conference on Harmonization, 1996). The results for the trueness, evaluated by the standard addition method to the placebo and expressed as the percentage of recovery are shown in Table III. They indicate no lack of trueness, since the average recovery obtained for the replicates was within the range (98.0102.0%), as recommended by Green (1996) at each concentration level. The estimated LOD and LOQ of the method, calculated by the equations using standard deviation of the curve intercept and the slope of the calibration curve were 0.48 and 1.58 µg/mL, respectively. The DUS method robustness was evaluated by the parameter that has the greatest potential to interfere in the assay results generated by a DUS method, the differentiation program. The assay of sextuplicate sample solutions of SILC tablets (25 µg/mL, 0.01 Braz. J. Pharm. Sci. 2017;53(1):e15181
%RSDa Intermediate precision, (n = 9) 1.71 1.29 1.60
%Recovery (%RSDa; n = 3) 98.86 (0.98) 99.79 (1.61) 99.30 (1.61)
mol/L HCl) using two different spectrophotometers was performed for comparison of the obtained results by means of t test (α = 0.05). The equipments used to assess the method robustness have internal differentiation programs that operate in different modes. In the Agilent HP8453 software, it is not allowed to change important derivatization parameters such as Δλ and scanning speed, which are automatically selected and optimized. On the other hand, in the Shimadzu UV1800 software the user is able to select such parameters in order to assess the method optimization. The results for the DUS method robustness are shown in Table IV. TABLE IV - Robustness results for SILC determination by DUS
(first order of derivative; zero-peak method; λ 256 nm; Δλ=2 nm; in 0.01 mol/L HCl; medium scan speed) Content (%) Sample Condition HP8453 Shimadzu UV1800 1 98.82 99.10 2 99.25 99.33 3 98.17 98.38 4 99.30 99.79 5 99.57 100.03 6 96.50 97.01 a Average; RSD 98.60; 1.16 98.94; 1.12 a: RSD, relative standard deviation.
The calculated value for t statistic test (t=0.522) was lower than the critical value (t=2.228; α=0.05). Thus, there was no significant difference between the assay results for the SILC tablets pool analyzed in different spectrophotometers, what proves the method robustness. In a study performed by El-Gindy et al. (2010), SILC was quantified by DUS in the concentration range from 4 to 36 µg/mL in the presence of four separate Page 9 / 12
T. D. Silva, C. R. Toledo, C. D. Vianna-Soares
impurities by first, second or third derivative order. Different wavelengths were chosen for the selective SILC determination in methanol:water (30:70) for each derivative order and for each impurity, by zero-peak methods or ratio spectra derivative (El-Gindy et al., 2010). Noteworthy, that method is not able to quantify the SILC in the presence of all four impurities simultaneously. Moreover, the interference towards excipients commonly found in SILC tablets was not appropriately evaluated. The authors ran only a recovery assay by means of standard addition to the tablets. A study of the matrix effect should have been conducted, as well as a careful evaluation of the spectral interference of excipients, the proper selection of λ, and the derivative order in which the interferences were null or minimal, in light of what was done in the present work. Doubtless, the method developed by El-Gindy et al. (2010) is effective towards the SILC determination in the presence of its impurities, when evaluated separately. Therefore, the method shows limited applicability and the validation protocol is incomplete, since it is necessary to evaluate the stability indication of the method for a formulation in the presence of its placebo. The method developed to quantify SILC API or tablets in the described conditions was satisfactorily validated. The interference regarding the placebo including the blue dye present in SILC tablets was eliminated and carefully evaluated in the first derivative order by zeropeak method, λ 256 nm. Moreover, the use of aqueous 0.01 mol/L HCl as the drug diluent, hence, a chemical residue, is easy to neutralize or discharge and is less aggressive to the environment.
CONCLUSION The SILC determination, such as API or as blue dyed tablets, by first derivative ultraviolet spectrophotometry showed no placebo interference and was successfully validated and achieved. The simple, fast and low cost developed methods, by non-aqueous titration and DUS, are excellent alternatives to sophisticated instrumental methods and can be easily applied in the quality control routine of such a popular drug, as SILC.
ACKNOWLEDGMENTS The authors are grateful to FAPEMIG, CNPq (Brazil) for the research financial support and Instituto Vita Nova (Hortolândia, SP, Brazil) for the kind donation of citrate of sildenafil raw materials.
Page 10 / 12
REFERENCES AMERICAN COLLEGE OF CARDIOLOGY FOUNDATION; AMERICAN HEART ASSOCIATION. ACCF; AHA. Expert consensus document on pulmonary hypertension, J. Am. Coll. Cardiol., v.53, p.1573-1619, 2009. AMES, J.; SOUZA, D.Z. Falsificação de medicamentos no Brasil. Rev. Saúde Públ., v.46, p.154-159, 2012. AMIN, A.; EL-BESHBESHY, A.M. Utility of certain s and p-acceptors for the spectrophotometric determination of sildenafil citrate (Viagra). Microchim. Acta, v.137, p.6369, 2001. B A D WA N, A.A.; N A B U L S, L.; A L-O M A R I, M.M.; DARAGHMEH, N.; ASHOUR, M. Sildenafil citrate. Anal. Profiles Drug Subst. Excipients, v.27, p.339-376, 2001. BALASOIU, S.C.; STADEN, R.L.S.V.; STADEN, J.F.V.; ION, R.M.; RADU, G.L.; ABOUL-EINEIN, H.Y. Amperometric dot-sensors based on zinc porphyrins for sildenafil citrate determination. Electroquim. Acta, v.58, p.290-295, 2011. BECKETT, A.H.; STENLAKE, J.B. Practical pharmaceutical chemistry. 4.ed. London: The Athlone Press, 1998. v.1, p.165-175. BRITISH Pharmacopoeia. London: The Stationary Office, 2014. v.2, p.VA267. (Titration). BROWN, M.B.; FORSYTHE, A.B. Robust tests for equality for variances. J. Am. Stat. Assoc., v.69, p.364-367, 1974. DAMIANO, F.; SILVA, C.; GREGORI, A.; VACONDIO, F.; MOR, M.; MENOZZI, M.; DI GIORGIO, D. Analysis of illicit dietary supplements sold in the Italian Market: identification of a sildenafil thioderivative as adulterant using UPLC-TOF/MS and GC/MS. Sci. Justice, v.54, p.228-237, 2014. DE ORSI, D.; PELLEGRINI, M.; MARCHEI, E.; NEBULONI, P.; GALLINELLA, B.; SCARAVELLI, G.; MARTUFI, A.; GAGLIARDI, L.; PICHINI, S. High performance liquid chromatography-diode array and electrospray-mass spectrometry analysis of vardenafil, sildenafil, tadalafil, testosterone and local anesthetics in cosmetic creams sold on the Internet web sites. J. Pharm. Biomed. Anal., v.50, p.362-369, 2009.
Braz. J. Pharm. Sci. 2017;53(1):e15181
Development and validation of alternative methods by non-aqueous acid-base titration and derivative ultraviolet spectrophotometry
DINESH, N.D.; NAGARAJA, P.; GOWDA, N.M.M.; RANGAPPA, K.S. Extractive spectrophotometric methods for the assay of sildenafil citrate (Viagra) in pure form and in pharmaceutical formulation. Talanta, v.57, p.757-764, 2002.
FRAG, E.Y.Z.; MOHAMED, G.G.; ALELAIWI, H.M.S. Electroanalytical determination of sildenafil in Viagra tablets using screen-printed and conventional carbon paste electrodes. J. Electroanal. Chem., v.659, p.121-127, 2011b.
DONATO, E.M.; CANEDO, N.A.P.; ADAMS, A.I.H.; FROEHLICH, P.E.; BERGOLD, A.M. Espectrofotometria derivada: uma contribuição prática para o desenvolvimento de métodos. Rev. Cienc. Farm. Básica Apl., v.31, p.125130, 2010.
GALIÈ, N.; PALAZZINI, M.; LECI, E.; MANES, A. Corazón derecho y circulación pulmonar. VI. Estrategias terapéuticas actuales en la hipertensión arterial pulmonar. Rev. Esp. Cardiol., v.63, p.708-724, 2010.
DRAPER, N.R.; SMITH, H. Applied regression analysis. 3.ed. New York: Wiley, 1998. DURBIN, J.; WATSON, G.S. Testing for serial correlation in least squares regression II. Biometrika, v.38, p.159-178, 1951. EL-GINDY, A.E.; SHOKRY, E.; FAROUK, M.; EL-AZIZ, L.A. Validated methods for determination of sildenafil citrate in the presence of its potential impurities. J. Biomed. Sci. Res., v.2, p.262-278, 2010. ESCRIBANO, P.; JIMÍNEZ, C.; CALZADA, C.S. Hipertensión arterial pulmonar en el año 2004. Rev. Esp. Cardiol., v.5, p.90A-103A, 2005. FEJOS, I.; NEUMAJER, G.; BÉNI, S.; JANKOVICS, P. Qualitative and quantitative analysis of PDE-5 inhibitors in counterfeit medicines and dietary supplements by HPLCUV using sildenafil as a sole reference. J. Pharm. Biomed. Anal., v.98, p.327-333, 2014. FOOD AND DRUG ADMINISTRATION. FDA. Reviewer guidance validation of chromatographic methods. Maryland: Center for Drug Evaluation and Research (CDER), 1994. 30 p. FOOD AND DRUG ADMINISTRATION. FDA. Dissolution profiles. Available from: . Accessed on: 06 Nov. 2014. FRAG, E.Y.Z.; MOHAMED, G.G.; ALELAIWI, H.M.S. Utility of ion-associate formation reactions for the spectrophotometric determination of sildenafil citrate in pure form and in Virecta tablets. Pharm. Anal. Acta, v.2, p.1-7, 2011a.
Braz. J. Pharm. Sci. 2017;53(1):e15181
GOBRY, V.; BOUCHARD, G.; CARRUPT, P.A.; TESTA, B.; GIRAULT, H.H. Physicochemical characterization of sildenafil: ionization, lipophilicity behavior, and ionicpartition diagram studied by two-phase titration and electrochemistry. Helv. Chim. Acta, v.83, p.1465-1474, 2000. GRATZ, S.R.; FLURER, C.L.; WOLNIK, K.A. Analysis of undeclared synthetic phosphodiesterase-5 inhibitors in dietary supplements and herbal matrices by LC–ESI–MS and LC–UV. J. Pharm. Biomed. Anal., v.36, p.525-533, 2004. GREEN, J.M. A practical guide to analytical method validation. Anal. Chem., v.68, p.305A-309A, 1996. HASSAN, S.S.M.; ELNEMMA, E.M.; MAHMOUD, W.H.; MOHAMMED, A.H.K. Continuos potentiometric monitoring of viagra (sildenafil) in pharmaceutical preparations using novel membrane sensors. J. Appl. Electrochem., v.36, p.139-146, 2006. INTERNATIONAL CONFERENCE ON HARMONIZATION. ICH. Guidance for Industry: Q2B Validation of Analytical Procedures: Methodology. Geneva: ICH, 1996. I N T E R N AT I O N A L O R G A N I Z AT I O N F O R STANDARDIZATION. ISO. ISO 5725: Accuracy (trueness and precision) of measurement methods and results - Parts 1, 2, 3, 4 and 6. Geneva: ISO, 1994. ISSA, Y.M.; EL-HAWARY, W.F.; YOUSSEF, A.F.A.; SENOSY, A.R. Spectrophotometric determination of sildenafil citrate in pure form and in pharmaceutical formulation using some chromotropic acido azo dyes. Spectrochim. Acta, v.75, p.1297-1303, 2010. MOFFAT, A.C.; OSSELTON, M.D.; WIDDAP, B. Clarke’s analysis of drugs and poisons: in pharmaceuticals, body fluids and postmortem material. 3.ed. London: Pharmaceutical Press, 2004. v.2. Page 11 / 12
T. D. Silva, C. R. Toledo, C. D. Vianna-Soares
MORELLI, B. Determination of binary mixtures of analgesic and spasmolytic drugs in pure and dosage forms by derivative spectrophotometry. J. Pharm. Biomed. Anal., v.33, p.423-433, 2003. ORTIZ, R.S.; ANTUNES, M.V.; LINDEN, R. Determinação de citrato de sildenafil e de tadalafil por cromatografia líquida de ultraeficiência com detecção por arranjo de diodos (CLUE-DAD). Quim. Nova, v.33, p.389-393, 2010. O’HAVER, T.C.; BEGLEY, T. Signal-to-noise ratio in higher order derivative spectrometry. Anal. Chem, v.53, p.18761878, 1981. O’HAVER, T.C.; THOMAS, C.; FELL, A.F.; SMITH, G.; GANS, P.; SNEDDON, J.; BEZUR, L.; MICHEL, R.G.; OTTAWAY, J.M.; MILLER, J.N.; AHMAD, T.A.; CHADBURN, B.P.; COTTRELL, C.T. Derivative spectroscopy and its applications in analysis. Anal. Proc., v.19, n.1, p.22-46, 1982. OTHMAN, A.M.; RIZK, N.M.H.; EL-SHAHAWI, M.S. Polymer membrane sensors for sildenafil citrate (Viagra) determination in pharmaceutical preparations. Anal. Chim. Acta, v.515, p.303-309, 2004. ROJAS, F.S.; OJEDA, C.B. Recent development in derivative ultraviolet/visible absorption spectrophotometry: 20042008: a review. Anal. Chim. Acta,, v.635, p.22-44, 2009. RYAN, T.A.; JOINER, B.L. Normal probability plots and tests for normality. The State College, Pennsylvania State University, 1976. Available from: . Accessed on: 2015. SALEM, H.J. Spectrochemical methods for the determination of sildenafil citrate (viagra) in bulk powder and in pharmaceutical dosage form. Appl. Sci., v.8, p.28-43, 2006. SAWATDEE, S.; PHETMUNG, H.; SRICHANA, T. Sildenafil citrate monohydrate–cyclodextrin nanosuspension complexes for use in metered-dose inhalers. Int. J. Pharm., v.455, p.248-258, 2013.
SOUZA, S.V.C.; JUNQUEIRA, R.G. A procedure to assess linearity by ordinary least squares method. Anal. Chim. Acta, v.552, p.25-35, 2005. THOMPSON, M.; ELLISON, S.L.R.; WOOD, R. Harmonized guidelines for single-laboratory validation of methods of analysis. Pure Appl. Chem., v.74, p.835-855, 2002. TYSZCZUK, K.; KOROLCZUK, M. Voltammetric method for the determination of sildenafil citrate (Viagra) in pure form and in pharmaceutical formulations. Bioelectrochemistry, v.78, p.113-117, 2010. UNITED STATES Pharmacopoeia: USP 36. Maryland: United States Pharmacopeial Convention, 2013a. (541 Titrimetry). UNITED STATES Pharmacopeia: USP 36. Maryland: United States Pharmacopeial Convention, 2013b. p.5137-5139. UNITED STATES Pharmacopoeia: USP 36. Maryland: United States Pharmacopeial Convention, 2013c. (1092 The dissolution procedure: development and validation). WANG, Y.; CHOW, M.S.S.; ZUO, Z. Mechanistic analysis of pH-dependent solubility and transmembrane permeability of amphoteric compounds: application to sildenafil citrate. Int. J. Pharm., v.352, p.217-224, 2008. WANG, C.C.; GÓMEZ, R.A.; FERNANDEZ, L.P. Determination of sildenafil by preconcentration on surfactant coated polymeric resin followed by spectrofluorimetry. J. Pharm. Anal., v.3, p.173-179, 2013. WANG, C.C.; SILVA, R.A.; MASI, A.N.; FERNANDEZ, L. Sensitive spectrofluorimetric determination of sildenafil. Analytical Methods, v.2, p.519-524, 2010. WEINERT, P.; PEZZA, L.; PEZZA, H.R. Determinação espectrofotométrica de citrato de sildenafil em formulações farmacêuticas. Quim. Nova, v.31, p.1112-1116, 2008. Received for publication on 14th October 2015 Accepted for publication on 21st November 2016
SONG, F.; EL-DEMERDASH, A.; LEE, S.J.S.H. Screening for multiple phosphodiesterase type 5 inhibitor drugs in dietary supplement materials by flow injection mass spectrometry and their quantification by liquid chromatography tandem mass spectrometry. J. Pharm. Biomed. Anal., v.70, p.4046, 2012. Page 12 / 12
Braz. J. Pharm. Sci. 2017;53(1):e15181