ISSN(Print) 1975-0102 ISSN(Online) 2093-7423
J Electr Eng Technol Vol. 8, No. 4: 920-929, 2013 http://dx.doi.org/10.5370/JEET.2013.8.4.920
Development and Validation of an Energy Management System for an Electric Vehicle with a split Battery Storage System Jan Becker†, Christoph Schaeper*, Susanne Rothgang** and Dirk Uwe Sauer*** Abstract - Within the project ‘e performance’ supported by the German Ministry of Education and Research (BMBF) an electric vehicle, powered by two lithium-ion battery packs of different capacity and voltage has been developed. The required Energy Management System (EMS) in this system controls the current flows of both packs independently by means of two individual dc-dc converters. It acts as an intermediary between energy storage (battery management systems-BMS) and the drivetrain controller on the vehicle control unit (VCU) as well as the on-board charger. This paper describes the most important tasks of the EMS and its interfaces to the BMS and the VCU. To validate the algorithms before integrating them into the vehicle prototype, a detailed Matlab / Simulink-model was created in the project. Test procedures and results from the simulation as well as experiences and comparisons from the real car are presented at the end. Keywords: Electric vehicle, Li-Ion battery system, Energy management system, Battery management system
1. Introduction
greater flexibility when distributing the battery in the vehicle chassis and brings further advantages which will be discussed later on. The simplest way is to hardwire the single packs in a parallel or a series connection, as accomplished in [5]. This paper presents a vehicle concept which has been developed in cooperation with Audi AG, Audi Electronics Venture GmbH, Bosch, Bosch Engineering Group and RWTH Aachen University. The battery system is made from two individual battery packs located at different places in the vehicle. Furthermore the packs have different voltage and capacity to fit best into the available space. The battery packs are connected via dc-dc converters to the drive train. The project aims at investigating several innovative concepts and approaches in the electrical drive train which may improve future EVs by means of driving performance, safety, driving range, reliability and costs. The construction of the prototype vehicle was completed in the end of 2012 allowing test drives in the real car.
Energy management systems (EMS) for vehicular applications control and optimize the power flow between electric consumers and power sources in the system. The strategies primarily aim at maximizing driving range and power of the vehicle. In case of more than one energy source in the vehicle, the EMS ultimately becomes more complex, as there are more control options. Previous publications consider hybrid energy storage systems consisting of batteries and ultra-capacitors [1] or batteries and fuel cells [2]. These systems are designed to gain best performance out of a high energy density source combined with a more powerful peak power device. For full electric vehicles such a system has not been brought to market yet. Most electric vehicles (EVs) that can be purchased today are powered by one single lithium-ion battery pack, for example the Mitsubishi i-MiEV [3]. A battery pack internally consists of a series connection of single battery cells to reach a voltage level required by the power electronics and the engines. High voltages are preferred to minimize currents and so the required copper in the vehicle. In some cases parallel connection of more than one string are used to extent the capacity [4]. An alternative approach is to divide the desired battery capacity into more than one battery unit. This results in
2. Drivetrain and Battery Topology The developed car is based on the Audi R8 chassis and is driven by three electric machines which provide a peak power of 50 kW each. One drives the front axle differential and two machines independently propel the rear wheels. The drivetrain is powered by two completely independent Li-Ion battery packs which are housed in the tunnel between the two seats and in the rear of the car (see Fig. 1). Each of the two battery units is equipped with its own battery management system (BMS) and is electrically connected to the HV-DC link via an independent
†
Corresponding Author: Institute for Power Electronics and Electrical Drives (ISEA), Germany. (
[email protected]) * Electrochemical Energy Conversion and Storage Systems Group, Institute for Power Electronics and Electrical Drives (ISEA), RWTH Aachen University, Germany. ** Institute for Power Generation and Storage Systems (PGS), E.ON ERC, RWTH Aachen University, Germany. *** Jülich Aachen Research Alliance, JARA-Energy, Germany. Received: May 27, 2013; Accepted: June 7, 2013
920
Jan Becker, Christoph Schaeper, Susanne Rothgang and Dirk Uwe Sauer
U N = 144 V
UN = 216 V
Fig. 2. ECU communication structure which must not be exceeded while charging the battery, as well as for the lower voltage limit in case of discharging. Exceeding these boundaries will lead to physical degradation and can cause severe damages up to fire or explosion [8]. Mainly due to these voltage limitations, both batteries are subject to certain power limitations. In the chosen HV topology it is crucial to avoid voltage breakdowns in the HV-DC link, which might happen in case the inverters require more power than the batteries can provide. To avoid such a failure, the EMS limits the maximum power that can be used for acceleration or regenerative braking by the vehicle dynamics manager (VDM). To guarantee the maximum possible power in each time step, the EMS continuously receives information from the two battery management systems (Fig. 2). The BMS in each battery pack calculates the maximum power of the corresponding storage unit ) that can be MaxDisch delivered to the HV-DC link as well as the maximum power, the battery can absorb from the DC link ( MaxCharge ). These calculations follow the maximum current rating of the converter and the above mentioned limits of the battery cells and are based on self-adapting onboard diagnostic algorithms, as described in [9] in order to determine the state of the battery for further power estimation [10]. A complex thermal battery model was developed in the project to support the algorithms with accurate temperature data [11]. Additionally, the EMS provides a maximum duration for which the currently requested power may be supplied by the battery system, considering a time prediction of available power from each BMS . This is based on algorithms as described MaxCurrentPower in [12]. The time prediction allows the VDM to prevent the drivetrain from sudden power drops which may result in decreasing acceleration and could therefore lead to safety concerns, e.g. during an overtaking maneuver. The maximum power maxProp , which is available for acceleration is calculated using the maximum discharge power of the batteries ( MaxDischRear , MaxDischTunnel ) and the power of the auxiliaries connected to the DC link (electric air-conditioning, heater Aux as
Fig. 1. Topology of HV system dc-dc converter. The battery system offers a combined capacity of 40 kWh. As the car can be driven with one pack only in a reduced power mode, this concept directly leads to a higher overall reliability besides offering more flexibility on placing the battery in the car and on choosing the voltage level of the battery units. A failure in one pack does not affect the remaining pack. Due to the different available installation space, the battery packs consist of a different amount of cells which leads to unequal nominal voltages. The battery packs are designed and located in order to maximize crash safety [6]. Also connected to the DC link are the three traction inverters, an electric heat pump, an electrical air condition compressor and a 20 kW on-board battery charger. Ultimately a more complex and adapted EMS is required for such a vehicle concept.
3. Description of the Energy Management System The major task of the EMS is to control the power flow between the batteries and the drivetrain during acceleration, braking and recharging the batteries from the grid. In charging mode the EMS controls the individual battery charging currents. A further task of the EMS is the adaption of the voltage-level of the HV-DC link to the speed dependent voltage requests of the inverters in order to minimize switching losses in the converters [7]. To prevent the drivetrain from overloading the batteries, the EMS also calculates a power limit which must not be exceeded while accelerating or braking. The above mentioned functions are described in the following chapters. The EMS algorithms are executed on a rapid prototyping electronic control unit (ECU) as this guarantees maximum flexibility during software development in Matlab / Simulink. The ECU also provides a CAN bus interface, which is used by the EMS and the VCU to communicate with the external ECUs (see Fig. 2).
3.1 Calculation of the maximum propulsion power
maxProp
MaxDischRear
MaxDischTunnel
Aux
.
(1)
This information is then transferred to the VDM. The maximum power, that can be used for recuperation is
Li-ion batteries require a strict compliance with the voltage limitations. This applies for the upper voltage limit, 921
Development and Validation of an Energy Management System for an Electric Vehicle with a split Battery Storage System
converter. A change during operation requires the demanded propulsion power to be very low (e.g. vehicle is not driving). Otherwise a voltage breakdown in the DC link might occur. As the total power demand may be subject to high dynamic variation and the EMS’ adaption of the power distribution is only updated with 1 kHz frequency, the actual power at the converters varies slightly from the demanded values when the controllers regulate the DC link voltage. The power distribution stays constant until the dc-dc converters receive the next distribution values from the EMS. As mentioned above, the two battery packs consist of the same type of battery cells. Thus, the developed power distribution algorithm primarily aims at equalizing the states of charge (SoC) and available power for the following time period in both battery units. This strategy guarantees a maximum power capability of the system even at the lowest SoCs which is desired in the developed sports vehicle. Furthermore the two battery units suffer from approximately the same rate of degradation using this distribution algorithm. A reason for having uneven states of charge in the two packs might be due to unequal selfdischarge rates based on cell production distribution or different compartment temperatures. The calculation of the power distribution is based on three independent summands (s1, s2, s3) adding up to the power distribution.
calculated following the sum of the maximum charging powers of each battery unit plus the auxiliary power consumption.
3.2 Power distribution to the batteries In normal operation mode there are two battery units that may provide the propulsion power. For most situations the maximum power of one single pack would be sufficient for feeding the traction inverters with power. Nevertheless, using only one pack at a time is not the optimum way by means of system lifetime and reliability. When accelerating very fast, the driver may demand more power, than one pack can deliver. The chosen strategy and the implementation of the power distribution are described in this chapter. First the function collects all power demands of the three inverters and the auxiliaries to determine the effective total power demand for the two storage units. The EMS uses this information to distribute the requested power to the battery packs by controlling the two dc-dc converters. The control of the power distribution is implemented by regulating the battery currents through one CAN message ( PowerDistrib ) which specifies the proportional power distribution in percent between the two packs (see Fig. 3). Besides the actual distribution, the EMS determines which of the two dc-dc converters operates as master and therefore regulates the DC-link voltage. The master feeds as much power into the DC link, as the EMS requests and simultaneously sends a current demand ( Slave to the second converter to set its percentage of the total power. This results in an effective power provided by the first converter assigned as master Master and respectively the power of the second converter Slave . Equations (2) and (3) show, how the propulsion power Prop is distributed to the two batteries. Master Slave
Prop Prop
PowerDistrib
(2)
Master
(3)
pPowerDistrib
VCU BMS 1
I Slave
Master pPowerDistrib
BMS 2 DC-DC 2
E M S
Pmax Pr op
s
x
s
x
s
(4)
Considered individually, the summand s would lead to a balanced current distribution in both packs so that the states of charge (SoCs) change likewise. The unequal terminal voltages of the two battery units are taken into account in the calculating of this component. The task of the variable s is to balance the SoCs in both packs. It shifts the power distribution more or less to the battery unit with the lower SoC, depending on the power direction (accelerating or recuperating). The component’s absolute value increases with a rising difference between the SoCs of the batteries so that the pack with the higher state of charge feeds a greater portion of the propulsion power. Its value is also depending on the absolute value of the SoC in order to accelerate the equalization when the battery approaches its end of discharge. The third component s is similar to the second one but aims to equalize the predicted maximum power times MaxCurrentPower of the two battery packs. Thus it changes the power distribution in a way that the pack with the lower MaxCurrentPower prediction is loaded with less power. Such a situation may occur if one unit has a significantly higher temperature than the other one which would lead to an earlier temperature affected power reduction of this pack. In principle it is possible, that s and s have opposite signs, which means that they would influence the power distribution in opposite directions. The component s is more critical and much more dynamic than s (equalization of the SoC). Thus s is prioritized
The master / slave assignment of the dc-dc converters can stay unchanged during driving but in case of a battery failure or operation with only one battery pack the EMS assigns the master task to the remaining battery unit and
DC-DC 1
x
Dynamics Manager
Slave
Fig. 3. Control principle of the dc-dc converters 922
Jan Becker, Christoph Schaeper, Susanne Rothgang and Dirk Uwe Sauer
by the algorithm, meaning that the ability to get power out of both battery units is privileged over having an even state of charge in both packs, if it is necessary. After calculating the three components, they are weighted with variable factors ( x , x , x in (4)) before being added up to the final power distribution. The weighting factors were tuned using the vehicle model and many representative driving cycles so that they generate an appropriate distribution which supports the driver’s requirements and simultaneously is beneficial for the battery-lifetime. To minimize switching losses in the converters, the EMS disables one of them in times of low power operation by assigning the complete power to one of the two converters. This enables the inactive converter to switch into a power saving standby-mode. Nevertheless this mode is only activated if the drivetrain power has been below a certain threshold for at least 0.5 seconds so that the control of the DC link voltage is not overstressed when driving the vehicle in the margin around the threshold. The occurring imbalance of SoCs in the battery packs which results from using only one dc-dc converter is leveled later on. To further support the SoC equalization strategy, the EMS disables the converter of the battery having the lower SoC.
Time Controlled Charging
Negotiate Charge Duration with BMSs Charge Duration balanced
t = tStart Charging
Charging (in exclusive modes) SoC balancing
Itunnel = IRear
Pmax Charger
Pmax Batteries
One Battery fully charged
Charging Finished / Cancelled
Stop Charging / Post‐Charging procedures / Preconditioning passenger cabin / System Shutdown Fig. 4. Flow Chart of Charging Process on-board charger operates in constant voltage mode so the charging power being fed into each batter pack has to be actively drawn from the DC link. That is why the EMS computes a battery charging current for each pack. The algorithm simultaneously aims at maximizing the total charging power and to equalize the state of charge in both packs. This leads to a minimum overall charging time. Differing from the other EMS functions, the charging algorithm is implemented in Matlab / Stateflow. This reflects the fact, that in charging mode the EMS passes through several different states which influence the charging currents of the batteries. For example, in case of imbalanced SoCs, the EMS tries to feed all the available charging power into the pack with the lower SoC. If the battery cannot use the complete charging power, the remaining part is consequently fed into the other pack to maximize the used charging power and therefore minimize the charging duration. Further states during the charging process are, that the charging power is limited by the batteries (most likely, when they are both in constant voltage phase), that one of the packs is completely charged and finally that both units have reached full charge state (i.e. at the end of charging process). A further reason for using Stateflow is, that the interaction between the battery management systems and the VCU prior to the actual charging process is complex (Fig. 4 - state “Pre-charge preparations) and thus easier to implement in a state machine than in Simulink. It is not unlikely that in time controlled charging mode the vehicle rests for several hours before the batteries are charged (e.g. over night). This implies that some conditions can change significantly between the first calculation of the charging start time and the actual start of charging. For example, a drop of ambient temperature requires a
3.3 Charge control Two charging modes were implemented in the system. The driver can either instantaneously charge the batteries when connected to the power grid (“normal charging”) or define a certain point in time, when he expects the batteries to be fully charged. This may be the time he wants to continue his journey (e.g. the next morning). The latter method is called “time controlled charging” and can extend the batteries’ lifetime since the EMS initializes the charging as lately as possible. Thus, unnecessary time periods at high SoCs are minimized which lead to accelerated degradation of Li-Ion batteries [13]. The time controlled charging is a requirement for vehicle to grid concepts (V2G) in the future as explained in [14] and in [15]. In time controlled charging mode, the EMS determines the charge start time by establishing a bidirectional communication with the battery management systems (see Fig. 4). The EMS requests an individual time prediction, how long the full charging would take with a particular percentage of the available charging power from each battery. If the two predictions differ significantly, the EMS redistributes the charging power and starts another inquiry (State “Pre-Charge preparations” in Fig. 4). The aim of this process is to iteratively find an identical charging duration for both battery packs, even if they have unequal states of charge and charging power capabilities. This method finally leads to the shortest possible charging time. In contrast to the driving mode, the EMS does not calculate a power distribution for the charging power. The 923
Development and Validation of an Energy Management System for an Electric Vehicle with a split Battery Storage System 40
SOC tunnel pack SOC rear pack
SOC (%)
35 30 25 20 0
100
200
300
400
500
600
700
80 Total drive train power Power of tunnel pack Power of rear pack
70 60
Power (kW)
50 40 30 20 10 0 -10 -20 0
100
200
300
400 time in s
500
600
700
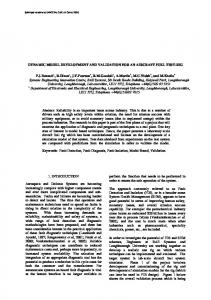
Fig. 5. Equalization of States of Charge during a driving scenario (simulation) the driving power (blue curve in bottom plot) is distributed in a way (red and green curve in bottom plot) that none of the battery packs is stressed to its maximum which may lead to unnecessary heating of a battery and therefore increase the ageing effects of the battery cells. What can be observed from the lower plot in Fig. 5 is, that at the beginning of the shown driving cycle the requested propulsion power is small enough so that it can be almost completely delivered by the pack with the higher SoC (in this case the rear pack). When the vehicle is in recuperation mode (P < 0) the EMS attempts to feed all the kinetic energy into the tunnel pack. If the recuperation power exceeds the beneficial charging power of the pack, the remaining power is fed into the other pack to avoid unnecessary battery stress. The more the two SoCs are balanced, the more the power is distributed equally to both packs. Note that the two packs have the same Ah-capacity but unequal nominal terminal voltages so that the power is not distributed 50 / 50 in case of balanced SoCs - only the battery currents are identical then (not shown in this figure). As mentioned in the beginning, the redundancy in the battery system is a great advantage of the vehicle concept, compared to conventional EV battery systems. While offering a higher availability, a discontinuation of one pack must be handled correctly by the EMS and the VCU. Fig. 7 shows a test scenario for this functionality in which one of the battery packs fails due to an internal hardware error. In the simulated scenario the car accelerates with maximum power (upper plot) to top speed when suddenly a cell voltage sensor in the rear pack fails. The BMS immediately measures zero volts on this sensor (2nd plot from top). In the simulation, the BMS is forced to set the maximum power allowed for this battery to zero (red dashed line in 3rd plot). Such an error is handled differently by the BMS
preheating of the batteries before electrically charging them. To take account of changing conditions, the system wakes up in regular time intervals to recalculate the charging start time with the current conditions. If the time of charging is not reached yet, the system shuts down again to save energy after each recalculation.
4. Software Validation in a Vehicle Model Besides the advantage, that software failures do not lead to hardware damages when run in a model, a model based testing environment ensures equal accuracy of input conditions every time, the test is conducted. This is usually not the case when executing software in the target system. Especially for debugging and tuning this possibility proved to be of great importance. In the following, test results from the simulations are presented correlating to the above presented EMS functions.
4.1 Validation of EMS functions in driving mode Several driving cycles were used for testing driving related functions of the EMS software. Most important were the “ARTEMIS” driving cycles which are more dynamic than NEDC (New European Driving Cycle) and are therefore said to deliver the more realistic consumption values [16]. During the tests it was of particular interest, whether the EMS meets its demands for an optimum power distribution under all circumstances. As an example Fig. 5 shows, how imbalanced SoCs in the packs (upper plot) are equalized in relatively short time to assure continuous power supply from both packs even at low states of charge. Nevertheless 924
Power (kW)
Jan Becker, Christoph Schaeper, Susanne Rothgang and Dirk Uwe Sauer 120 100 80 60 40 20
Voltage (V)
10
Power (kW)
20
30
40
50
60
4 2
UCell13 in Rear Pack
0 10
Power (kW)
described in chapter 0 had to be validated. Fig. 7 shows the actual charging part of a time controlled charging scenario. The charging was programmed to be completed at 6:30 am. As described above, the latest start of charging is negotiated by the EMS and the two battery management systems to complete charging just in time. The tunnel pack has a higher state of charge than the rear pack (upper plot) before the charging is initiated. Thus, the EMS starts charging the pack with the lower SoC at its maximum power (4:46 am until 4:54 am). The figure also shows that the maximum power which can be delivered by the charger is completely fed into the rear pack (3rd plot from top) - there is no power left for charging the tunnel pack in this case. Note that the voltage of the HV-DC link differs from the battery voltages so that
PPropulsion
20
30
150
40
50
60
50
60
Pact Rear
100
Pmax Rear
50 0
10
20
30
150
40 Pact Tunnel
100
Pmax Tunnel
50 0
10
20
30
40 time in s
50
60
ICharger
Fig. 6. Simulated reaction to a hardware failure in one battery pack while driving
4.1 Validation of EMS charging function
(5)
Rear Pack
04:43
04:50
04:56
05:03
05:10
05:16
05:23
05:30
05:36
05:43
05:50
05:56
06:03
06:10
06:16
05:36
05:43
05:50
05:56
06:03
06:10
06:16
05:30
05:36
05:43
05:50
05:56
06:03
06:10
06:16
05:23 05:30 System time
05:36
05:43
05:50
05:56
06:03
06:10
06:16
I
Tunnel Pack
I
max Charge Tunnel Pack
04:43
04:50
04:56
05:03
05:10
05:16
05:23
05:30
I
Rear Pack
I
max Charge Rear Pack
04:43
04:50
04:56
05:03
05:10
0
05:16
05:23
I
-20 -40 -60 04:36
.
Tunnel Pack
-50 -100 04:36
P
SoC
-50 -100 04:36 0
I
SoC
50
0
Current (A)
Current (A)
Current (A)
SoC (%)
Related to the charging functions, the simulations had to prove that the EMS distributes the power as intended during the actual charging process. On the other hand the negotiation processes for the time controlled charging,
0 04:36
P
As soon as the SoCs are balanced (4:54 am), the EMS switches into the charging mode in which both packs are charged with the exact same current (2nd and 3rd plot). Thus, the packs approach their individual upper voltage limit at the same time. At 6:02 am the charging mode changes again because both batteries have to be charged with constant voltage from then on. That is why the charger current decreases (lower plot). As soon as both batteries have approached the upper SoC limit set by the software, the EMS stops the charging process (6:10 am). Fig. 8 shows the result of a scenario with driving periods, normal and also time controlled charging. It starts with a 35 km long trip which discharges the previously fully charged battery system down to 80 % SoC. The upper plot shows the combined state of charge of both battery packs which is calculated by the EMS and presented to the driver in the dashboard. After the drive, the vehicle is connected to the grid and the driver chooses the “normal” charging mode. Thus, the EMS immediately initializes the charging
in the vehicle since the battery voltage is measured redundantly and can be extrapolated for a short time. The curves in Fig. 6 show that the EMS can handle such a dynamic process by assigning the complete power to the still available tunnel pack. In this scenario the driver would not even notice the outage of the rear pack as the full propulsion power can be delivered by the remaining pack. This may be different if the power of the packs is more limited (e.g. in case of lower SoC or significantly higher cell temperatures).
100
I
Charger
04:43
04:50
04:56
05:03
05:10
05:16
Fig. 7. Charging of the batteries with initially imbalanced states of charge (simulation) 925
distance (km)
speed (km/h)
Power (kW)
System SoC (%)
Development and Validation of an Energy Management System for an Electric Vehicle with a split Battery Storage System 100 System SoC
90 80 08:00 60 40 20 0 -20 08:00 150
08:34
09:08
09:42
10:17
10:51
11:25
12:00
12:34
13:08
13:43
14:17
14:51
15:25
16:00
13:43
14:17
14:51
15:25
16:00
13:43
14:17
14:51
15:25
16:00
13:43
14:17
14:51
15:25
16:00
16:34
P
Propulsion
P
Charger
08:34
09:08
09:42
10:17
10:51
11:25
12:00
12:34
100
13:08
Vehicle Speed
50 0 08:00
08:34
09:08
09:42
10:17
10:51
11:25
12:00
12:34
100
13:08
driven distance
50 0 08:00
08:34
09:08
09:42
10:17
10:51
11:25
12:00 12:34 System Time
13:08
SOC in %
Fig. 8. Simulation of a complete day with driving and charging
SOC tunnel pack SOC rear pack
70 60 50
Power in kW
305
310
315
40
Power tunnel pack Power rear pack
20 0 305
310
315
Current in A
200
320 Battery current tunnel pack Battery current rear pack
100 0 305
Power distrib. in %
320
310
315
320
100 Power distribution 50
0
305
310
315
320
time in s
Fig. 9. Test drive on a roller dynamometer with different SoCs in the two battery packs continued with a fully charged battery system.
process. Thirty minutes later the batteries are fully charged again and the EMS requests the VCU to shut the system down. At 11:00 am the vehicle is used for an overland journey. Afterwards connected back to the grid, the driver chooses the time controlled charging mode and sets the desired end of charge time to 4 pm. As can be seen from the second plot in Fig. 8 the EMS initiates the charging process at 3:15 pm which was negotiated with the two BMS in the time before. The batteries are then fully charged at 3:40 pm to leave a certain safety margin in case the charging time prediction is not accurate or the driver wants to leave earlier. Finally at 4 pm the journey is
5. Results and Experiences from the Vehicle At this juncture a few measurements from the real vehicle are available for comparison with the simulation and further analyzing. Fig. 9 shows a short excerpt from a measurement of the vehicle on a roller dynamometer to validate the power distribution in the real system. The dcdc converter connected to the rear pack is acting as master in this situation. A power distribution (bottom plot) of 0 %
926
Jan Becker, Christoph Schaeper, Susanne Rothgang and Dirk Uwe Sauer NEDC Vehicle Measurement
200
400
600
800
1000
20 0 200
400
600
800
1000
1200
50
200
400
600
800
1000
1200
Speed in km/h
150 100 50 0 0
200
400
600 time in s
800
1000
1200
SoC tunnel pack SoC rear pack 200
400
600
800
1000
1200
200
400
600
800
1000
1200
200
400
600
800
1000
1200
200
400
600 time in s
800
1000
1200
40 20 0 0
100
0 0
35
30 0
1200 Power in kW
Power in kW Power distrib. in %
SoC tunnel pack SoC rear pack
40
0
speed in km/h
SoC in %
35
30 0
NEDC simulation
40
Power distrib. in %
SoC in %
40
100 50
0 0 150 100 50 0 0
Fig. 10. Comparison of simulation result (right) to real vehicle measurement (left) in NEDC driving cycle the results from the vehicle on the roller dynamometer (SoC of the battery packs, total drivetrain power, EMS power distribution value and vehicle speed). The right column displays the according signals from the simulation. The battery starting conditions of the simulation (state of charge and temperature) were chosen according to the real world test to validate the simulation. The similarity between the simulation results and the measureme nt shows the accuracy of the simulation. An energy of 2.2 kWh is needed for the NEDC driving cycle in the simulation, whereas the real vehicle uses a total energy of 2.6 kWh. Nevertheless, in the simulation a higher peak power is needed for the driving cycle. This difference may be explained with a slightly different parameterized model, compared to the roller dynamometer (friction, front area, drag coefficient). Note that the SoC in the vehicle is output in 1 % resolution.
therefore means that the rear pack is not used, whereas 100 % means that the complete power is drawn (or loaded) from (into) the rear pack. Due to the testing procedures in advance on this day, the states of charge in the two battery packs differ significantly - the SoC of the tunnel pack is about 10 % higher than the SoC of the rear pack (uppermost plot). One can observe how the driver accelerates three times using a peak power of about 65 kW in the rear axle machines (sum of battery powers is 2nd plot from top). In these moments of high power consumption, the EMS tries to equalize the stress for the batteries by setting the power distribution (bottom plot) in such a way, that the battery currents are almost identical in both packs (3rd plot from top). During the remaining time periods of less power consumption, the EMS follows the SoC-equalizing strategy. As the tunnel pack has the higher state of charge, it is preferentially used, whenever the power is not too high to be provided by only one single pack (first and last section of the measurement). In those instances, when the power distribution is set to 100 %, a slightly negative propulsion power occurred meaning that the inverters feed power back into the batteries. Like explained above, the EMS tries to charge this recuperation energy completely into the pack with the lower state of charge (the rear pack in this situation). The noticeable high frequent current ripple (3rd plot) is caused by noise of the current sensor. A comparison between the simulation results and a measurement from the real vehicle, driving the same cycle is shown in Fig. 10. The left column of the figure shows
6. Conclusion and Outlook The implemented EMS described in this paper has been extensively validated in a vehicle model in many different scenarios. The power distribution in driving mode fulfills the requirements under all test conditions (different driving cycles, initial SoC difference, and battery cooling performance and temperatures). The requested propulsion power is always delivered and distributed in a way that the driver does not notice the allotted battery architecture and simultaneously the batteries are cycled in the gentlest way.
927
Development and Validation of an Energy Management System for an Electric Vehicle with a split Battery Storage System
This function has also been validated in the real vehicle. The first tests showed that the parameterization of the control parameters, which had been fine-tuned for the simulation model also fit well for the system in the real vehicle. In the simulations the charging algorithm has been proven to fulfill all the requirements. The batteries are charged as fast as possible with the deliverable power from the on-board charger. In time controlled charging the start of the charging process is postponed as long as possible, to preserve the cells from unnecessary aging at high states of charge. The obtained results are very promising and already show the advantages of the distributed battery architecture (e.g. lower risk of car breakdown because of complete redundancy). Through the control of the EMS, the two packs act as one integrated battery system that guarantees maximum power even down to the lowest state of charge but gives a significant higher redundancy in case of a battery or converter failure. They also prove that the challenges have been mastered: The driver is not stressed with any technical details about the individual battery packs and the distribution of the power. Future implementations may include features like vehicle-to-grid functions. By providing an interface to the user to set the time of the next journey, most constraints on vehicle side are already met by the current system and EMS. Another interesting research possibility is the usage of different battery cell types in the two battery packs. One unit equipped with high energy cells, whereas the other pack consists of high power cells may lead to a more powerful system.
[3]
[4]
[5] [6]
[7]
[8]
[9]
Acknowledgements [10] This work was kindly financed by the German Ministry of Education and Research (BMBF) within the project ‘e performance’. The vehicle measurements on the roller dynamometer were conducted at the Institute of Automotive Engineering at RWTH Aachen University (ika).
[11]
References [1]
[2]
L. Rosario, P. Luk, J. Economou, and B. White, “A modular power and energy management structure for dual-energy source electric vehicles,” in Vehicle Power and Propulsion Conference, 2006. VPPC ’06. IEEE, sept. 2006, pp. 1-6. D. Gao, Z. Jin, and Q. Lu, “Energy management strategy based on fuzzy logic for a fuel cell hybrid bus,” Journal of Power Sources, Vol. 185, No. 1, pp. 311-317, 2008. [Online]. Available: http://www. sciencedirect.com/science/article/pii/-
[12]
[13]
928
S0378775308013463 M. Millikin. (2008, May) The battery pack for mitsubishi’s i miev. http://www.greencarcongress. com/2008/05/the-battery-pac.html. [Online]. Available: http://www.greencarcongress.com/2008/05/thebattery-pac.html T. Kim, W. Qiao, and L. Qu, “A multicell battery system design for electric and plug-in hybrid electric vehicles,” in Electric Vehicle Conference (IEVC), 2012 IEEE International, march 2012, pp. 1 -7. A. Engstle, M. Deiml, M. Schlecker, and A. Angermaier, “Entwicklung eines heckgetriebenen 800-velektrofahrzeugs,” ATZ, No. 114, pp. 606-611, 07 2012. L. ECKSTEIN, S. GINSBERG, B. HARTMANN, M. FUNCKE, and P. JECK, “Development, design and build-up of a crash-deformable battery pack for electric vehicles,” VDI-Berichte, Vol. 2144, pp. 22946, 2011. T. Schoenen, M. Kunter, M. Hennen, and R. De Doncker, “Advantages of a variable dc-link voltage by using a dc-dc converter in hybrid-electric vehicles,” in Vehicle Power and Propulsion Conference (VPPC), 2010 IEEE, sept. 2010, pp. 1 -5. R. A. Leising, M. J. Palazzo, E. S. Takeuchi, and K. J. Takeuchi, “Abuse testing of lithium-ion batteries: Characterization of the overcharge reaction of licoo 2/graphite cells,” Journal of The Electrochemical Society, Vol. 148, No. 8, pp. A838-A844, 2001. [Online]. Available: http://jes.ecsdl.org/content/148/8/A838.abstract W. Waag, C. Fleischer, C. Schaeper, J. Berger, and D. Sauer, “Self-adapting on-board diagnostic algorithms for lithium-ion batteries,” in Advanced Battery Development for Automotive and Utility Applications and their Electric Power Grid Integration, 2011. A. Burke and M. Miller, “The power capability of ultracapacitors and lithium batteries for electric and hybrid vehicle applications,” Journal of Power Sources, Vol. 196, No. 1, pp. 514-522, 2011. [Online]. Available: http://www.sciencedirect.com/science/article/pii/S0378775310010797. W. Zhou, C. Schaeper, M. Ecker, T. Fischer, C. Bohmann, L. Hörth, and D. U. Sauer, “Thermisches und lebensdauerbatteriemodell für die konzeptuntersuchung eines lithium-ionen batteriesystems als wärmespeicher im elektrofahrzeug,” 2012. G. Plett, “High-performance battery-pack power estimation using a dynamic cell model,” IEEE Transactions on Vehicular Technology, Vol. 53, No. 5, pp. 1586-1593, sept. 2004. J. Vetter, P. Novák, M. Wagner, C. Veit, K.-C. Möller, J. Besenhard, M. Winter, M. Wohlfahrt-Mehrens, C. Vogler, and A. Hammouche, “Ageing mechanisms in lithium-ion batteries,” Journal of Power Sources, Vol. 147, No. 1-2, pp. 269-281, 2005. [Online]. Avail-able: http://www.sciencedirect.com/science/article/pii/-
Jan Becker, Christoph Schaeper, Susanne Rothgang and Dirk Uwe Sauer
Susanne Rothgang Received her diploma in Electrical Engineering from Friedrich-Alexander University ErlangenNuremberg in 2010. In June 2010 she joined ISEA as a research associate and is responsible for the section Storage System Technology and Vehicle Integration. Her areas of interest are HV batteries and the related vehicle integration with a special focus on safety aspects.
S0378775305000832 [14] W. Kempton, J. Tomic, S. Letendre, A. Brooks, and T. Lipman, “Vehicle-to-grid power: Battery, hybrid and fuel cell vehicles as resources for distributed electric power in california,” 2001. [Online]. Available: www.udel.edu/V2G [15] B. Lunz, H. Walz, and D. U. Sauer, “Optimizing vehicle-to-grid charging strategies using genetic algorithms under the consideration of battery aging,” IEEE, 2011. [16] M. ANDRÉ, “Real-world driving cycles for measuring cars pollutant emissions-part a: The artemis european driving cycles,” 2004.
Dirk Uwe Sauer Dirk Uwe Sauer received his diploma in Physics from University of Darmstadt in 1994 and the Ph.D. degree from Ulm University, Ulm, Germany, in 2003. From 1992 to 2003, he was a Scientist at Fraunhofer Institute for Solar Energy Systems, Freiburg, Germany. In October 2003, he became a Junior Professor, and since 2009 he is a full Professor at RWTH Aachen University, Aachen, Germany, for Electrochemical Energy Conversion and Storage Systems.
Jan Becker Jan Becker received his diploma in electrical engineering from RWTH Aachen University, Germany. He is a scientist at the Institute for Power Electronics and Electrical Drives of RWTH Aachen.
Christoph Schaeper Graduated in 2008 in Electrical Engineering at RWTH Aachen University, Germany and is now Team Leader of Battery System Design and Vehicle Integration at the Institute for Power Electronics and Electrical Drives.
929