Available online http://arthritis-research.com/content/11/4/R125
Research article Vol 11 No 4
Open Access
Development and validation of the self-administered Fibromyalgia Assessment Status: a disease-specific composite measure for evaluating treatment effect Fausto Salaffi1, Piercarlo Sarzi-Puttini2, Rita Girolimetti1, Stefania Gasparini1, Fabiola Atzeni2 and Walter Grassi1 1Department
of Rheumatology, Polytechnic University of the Marche Medical School, Via dei Colli 52, 60035 Jesi (Ancona), Italy Unit, L. Sacco University Hospital, Via G.B. Grassi 74, 20127 Milan, Italy
2Rheumatology
Corresponding author: Fausto Salaffi,
[email protected] Received: 22 Apr 2009 Revisions requested: 2 Jun 2009 Revisions received: 15 Jul 2009 Accepted: 18 Aug 2009 Published: 18 Aug 2009 Arthritis Research & Therapy 2009, 11:R125 (doi:10.1186/ar2792) This article is online at: http://arthritis-research.com/content/11/4/R125 © 2009 Salaffi et al.; licensee BioMed Central Ltd. This is an open access article distributed under the terms of the Creative Commons Attribution License (http://creativecommons.org/licenses/by/2.0), which permits unrestricted use, distribution, and reproduction in any medium, provided the original work is properly cited.
Abstract Introduction The Fibromyalgia Impact Questionnaire (FIQ) is a composite disease-specific measure validated for fibromyalgia (FM), but it is rarely used in clinical practice. The objective was to develop and analyse the psychometric properties of a new composite disease-specific index (Fibromyalgia Assessment Status, FAS), a simple self-administered index that combines a patient's assessment of fatigue, sleep disturbances and pain evaluated on the basis of the 16 non-articular sites listed on the Self-Assessment Pain Scale (SAPS) in a single measure (range 0 to 10). Methods The FAS index was constructed using a traditional development strategy, and its psychometric properties were tested in 226 FM patients (209 women, 17 men); whose disease-related characteristics were assessed by means of an 11-numbered circular numerical rating scale (NRS) for pain, fatigue, sleep disturbances and general health (GH), the tender point score (TPS), the SAPS, the FIQ, and the SF-36. A group of 226 rheumatoid arthritis (RA) patients was used for comparative purposes. Of the 179 FM patients who entered the follow-up study, 152 completed the three-month period and were included in the responsiveness analyses. One hundred and fifty-four patients repeated the FAS questionnaire after an interval of one week, and its test/re-test reliability was
calculated. Responsiveness was evaluated on the basis of effect size and the standardised response mean. Results The FAS index fulfilled the established criteria for validity, reliability and responsiveness. Factor analysis showed that SAPS and fatigue contributed most, and respectively explained 47.4% and 31.2% of the variance; sleep explained 21.3%. Testing for internal consistency showed that Cronbach's alpha was 0.781, thus indicating a high level of reliability. As expected, closer significant correlations were found when FAS was compared with total FIQ (rho = 0.347; P < 0.0001) and the FIQ subscales, particularly job ability, tiredness, fatigue and pain (all P < 0.0001), but the correlation between FAS and the mental component summary scale score (MCS) of the SF-36 (rho = -0.531; P < 0.0001) was particularly interesting. Test/re-test reliability was satisfactory. The FAS showed the greatest effect size. The magnitude of the responsiveness measures was statistically different between FAS (0.889) and the FIQ (0.781) (P = 0.038), and between the SF-36 MCS (0.434) and the SF-36 physical component summary scale score (PCS) (0.321) (P < 0.01). Conclusions The self-administered FAS is a reliable, valid and responsive disease-specific composite measure for assessing treatment effect in patients with FM.
ACR: American College of Rheumatology; AUC: area under the curve; CCC: concordance correlation coefficients; CI: confidence interval; CVI: content validity index; DAS: Disease Activity Score; ES: effect size; FAS: Fibromyalgia Assessment Status; FIQ: Fibromyalgia Impact Questionnaire; FM: Fibromyalgia; GH: general health; IMMPACT: Initiative on Methods, Measurement, and Pain Assessment in Clinical Trials; MCS: mental component summary scale score; NRS: numerical rating scale; OMERACT: Outcome Measures in Rheumatology; PRO: patient-reported outcome; PCS: component summary scale score; RA: rheumatoid arthritis; ROC: receiver operating characteristic; SAPS: Self-Assessment Pain Scale; SF-36: Short Form 36 Health Survey; SRMs: standardised response means; TPS: tender point score. Page 1 of 12 (page number not for citation purposes)
Arthritis Research & Therapy
Vol 11 No 4
Salaffi et al.
Introduction Fibromyalgia syndrome (FM) is a chronic multi-symptom disease [1-3], with pain as possibly its most important symptom. It affects approximately 2 to 3% of the general population, and more than 90% of the patients are female [4,5]. FM encompasses many symptoms, including fatigue, sleep disturbances, psychological and cognitive alterations, headache, migraine, variable bowel habits, diffuse abdominal pain, and urinary frequency [1-3], which is why studies have used a wide variety of outcome measures and assessment instruments. However, outcome measures borrowed from clinical research into pain, rheumatology, neurology, and psychiatry can only distinguish treatment responses in specific symptom domains, as has recently been highlighted by a systematic review of FM clinical trials [6]. When evaluating the effectiveness of FM therapy, it is important to be able to assess its impact on all of the domains considered important by clinicians and patients [7,8], and the OMERACT (Outcome Measures in Rheumatology) Fibromyalgia Syndrome Workshop has recently completed an attempt to include the patient perspective in identifying and prioritising such domains using focus groups and Delphi exercises [1,8,9]. Given the multifaceted nature of FM and the new therapies currently being tested [1-3], there is a need to refine these measures further to develop a reliable and valid composite patient-reported outcome (PRO) response measure that more accurately assesses treatment effects [1]. The validity and usefulness of PRO data in evaluating and monitoring patients with rheumatic conditions have been clearly documented [10,11]. PROs include physical function or disability, pain, general health status, side effects, medical costs and other factors, and instruments for measuring PROs are easier to administer and less expensive than physician-observed disease activity and process measures. A composite disease-specific measure has been validated for FM. The Fibromyalgia Impact Questionnaire (FIQ), which was developed by Burckhardt and colleagues [12], consists of questions and visual analogue scales regarding functional disability, ability to have a job, pain intensity, sleep function, stiffness, anxiety, depression, and the overall sense of well-being. It has been shown to have a credible construct validity and reliable test/retest characteristics, and is sensitive in identifying therapeutic changes [13]. However, it is rarely used in clinical practice for a number of reasons, including its apparent lack of relevance to clinicians and their unfamiliarity with it. However, the most important reason for its lack of use seems to be the perceived difficulty in administering and scoring it. Other problems have been noted with the FIQ, including that it may underestimate disease impact and inadequately measure treatment effect in patients with mild symptoms; furthermore, it has not been validated in men [13].
Page 2 of 12 (page number not for citation purposes)
The aim of this study was to develop and analyse the psychometric properties of a new composite disease-specific index for evaluating patients with FM, Fibromyalgia Assessment Status (FAS), which includes domains/items considered relevant by patients and doctors.
Materials and methods Development of FAS The development of a self-administered evaluation instrument usually follows a series of major steps: a) the identification of a specific patient population; b) the identification of important efficacy domains; c) item reduction; and d) a validation study to prove determination, reliability, validity, and responsiveness [14-16]. The process therefore begins with the development of an outcome domain pool and ends with one or more validation studies to establish test/retest reliability, construct validity, and responsiveness. Population identification The aim of this study was to evaluate the disease-specific symptoms of patients who satisfy the 1990 American College of Rheumatology (ACR) classification criteria for FM [17]. Subjects with a diagnosis of anything other than chronic musculoskeletal pain conditions were excluded, as were those with medical comorbidities that would prevent them from participating fully in the study procedures (e.g. terminal conditions such as end-stage renal disease, heart failure, or malignancy), alcohol abusers, or subjects with major cognitive deficits or psychiatric symptoms that would preclude them from completing the questionnaire.
The study was approved by the Ethics Committees of the Polytechnic University of the Marche Medical School, and the Sacco University Hospital, and all of the patients gave their informed consent. Identification of important efficacy domains This is considered the most important step in the development of a disease-specific evaluation instrument. The items were generated in two phases [14,18]. The first consisted of a review of the literature in order to identify the outcome measures adopted in FM clinical trials and the instruments used to assess them. The publications were retrieved by means of a comprehensive, computer-aided search of the Cochrane Central Register of Controlled Trials, MEDLINE, CINAHL, EMBASE, and PSYCINFO up to December 2008. A specific search strategy was developed for each database using the Cochrane methodological filter for randomised controlled trials and MESH keywords, and other relevant terms such as 'fibromyalgia', 'chronic pain syndrome', 'health status', 'multidisciplinary', 'patient care team', 'back pain', all of which were exploded when necessary. A manual search of the bibliographies of trials was also undertaken in order to check that all of the published trials had been identified. The search strategy led to the retrieval of 5431 articles, of which 409 were
Available online http://arthritis-research.com/content/11/4/R125
selected on the basis of their titles, abstracts and keywords. After reading all of these abstracts, 134 full-text versions of the articles were obtained, of which 41 were finally chosen. Domain reduction The need for domain reduction was driven by the impossible task of carrying a large number of redundant outcome domains through the subsequent validation study. It was therefore decided to retain the 10 to 12 outcome domains that were the most important to patients and representative of their health status. In a first step, 20 potentially assessable domains in FM were reviewed for relevance by a panel of 47 experts (21 rheumatologists, 5 orthopedic surgeons, 9 physiatricians, 3 algologists, 5 psychiatrists and 3 gynecologists) using Lynn's process for content validation [19].
The second and most important step involved interviewing 87 FM patients (77 females and 10 males) attending the Rheumatology Units of Ancona, which were selected in such a way as to ensure that a wide spectrum of patient characteristics, disease severity and treatments would be elicited. The predominance of female subjects in the item generation sample was comparable with the approximate 7 to 8:1 ratio in published clinical trials. After signing an informed consent form, the patients underwent a semi-structured interview conducted by a research assistant with expertise in developing assessment instruments. This quantitative phase measured the proportion of experts or patients who agreed that the items were relevant, as estab-
lished by a content validity index (CVI). Lynn [19] recommended using a relevance rating scale that provides ordinal level data by means of four Likert-like choices (4: extremely relevant, extremely important; 3: very relevant, very important; 2: somewhat relevant, somewhat important; 1: irrelevant, unimportant). Only the items rated 3 and 4 constitute the actual CVI; the others should be eliminated. The CVI formula is: CVI or percentage agreement = number of experts agreeing on items rated as 3 or 4/total number of experts. The items were considered as having adequate content validity if agreement was 88% or more; those for which agreement was 70 to 87% were considered questionable; and those with an agreement of 69% or less were rejected. Tables 1 and 2 show the CVI values for the individual items as expressed by the physicians and patients. A final three-item model (pain, fatigue, sleep disturbance) was judged to have adequate validity (93 to 100% agreement among the clinicians; 91 to 100% among the patients), and constituted the FAS index. Three items (physical function, depression, anxiety) rated at a level of questionable validity were closely examined by the panel of experts and then eliminated; the remaining four showed less than 69% agreement, and were eliminated without further consideration. Psychometric properties of FAS The psychometric properties of the FAS index were studied in an additional cohort of 226 patients aged 20 to 75 years, who met the 1990 ACR classification criteria for FM [17] and gave their informed consent. This validation study was divided into
Table 1 Content validity index values for the individual key domains identified by clinicians Frequency
Mean importance
Frequency × importance product
1. Pain
100
3.9
390.0
2. Fatigue
99
3.7
366.3
3. Sleep quality
93
3.5
325.5
4. Patient global assessment
86
3.4
292.4
5. Physical function
84
3.3
277.2
6. Depression
80
3.2
256.0
7. Anxiety
77
3.3
254.1
8. Clinician global assessment
68
3.3
224.4
9. Quality of life
67
3.2
214.4
10. Occupational dysfunction
64
3.2
204.8
11. Social dysfunction
62
3.2
198.4
12. Cognitive impairment
57
3.2
182.4
Clinician-identified domains
Page 3 of 12 (page number not for citation purposes)
Arthritis Research & Therapy
Vol 11 No 4
Salaffi et al.
Table 2 Content validity index values for the individual key domains identified by patients with fibromyalgia Frequency
Mean importance
Frequency × importance product
1. Pain
100
3.8
380.0
2. Fatigue
98
3.8
372.4
3. Sleep quality
91
3.7
336.7
4. Physical function
84
3.5
294.0
8. Morning stiffness
79
3.5
276.5
5. Anxiety
76
3.3
250.8
6. Depression
72
3.4
244.8
Patient-identified domains
8. Memory problems
64
3.6
230.4
9. Quality of life
62
3.5
217.0
10. Occupational dysfunction
59
3.4
200.6
11. Social dysfunction
57
3.2
182.4
12 Problems with attention or concentration
53
3.1
164.3
two parts. The first part consisted of a cross-sectional study in which all 226 patients were asked to answer several questionnaires and were examined by a physician who assessed pain and other symptoms; 163 of these patients repeated the evaluation after an interval of one week in order to test its reliability. For purposes of comparison, we also evaluated a sample of 226 patients meeting the ACR criteria for rheumatoid arthritis (RA) [20], who were randomly matched from 469 RA patients participating in an ongoing longitudinal outcome project and reflected the age/gender-related stratification/distribution of the FM sample, and underwent the same complete clinical assessment with the fibromyalgia tender points assessment but the FIQ was not administered [12,21]. They also completed the Medical Outcomes Study Short Form-36 Health Survey (SF-36) [22,23].
Clinical assessment The patients were administered a questionnaire including questions relating to sociodemographic data, disease-related variables and the quality of life. The sociodemographic variables were age, gender, education, marital status, and the duration of FM symptoms. Age and symptom duration were recorded in years; education was divided into three categories based on the Italian school system (1 = primary school, 2 = secondary school, and 3 = high school or university); and marital status was divided into two categories (1 = living with a partner; 0 = living alone). The assessment of comorbidities included nine specific conditions: hypertension, myocardial infarction, lower extremity arterial disease, major neurological problems, diabetes, gastrointestinal disease, chronic respiratory disease, kidney disease, and poor vision.
The second part consisted of a three-month follow-up period during which we assessed the sensitivity of the FAS to changes in the 179 FM patients who had started a new pharmacological treatment (muscle relaxants and antidepressants were the most frequently used medications) or significantly changed the dose of their existing treatment. One hundred and fifty-two completed this part of the study; the other 27 did not attend our outpatient clinic during this time and were excluded from the analysis although retrospective data checks revealed that they experienced the same disease course. The study was performed in accordance with the principles of the Declaration of Helsinki, and the protocols were approved by our Ethics Committees.
Measurements and instruments The disease-related characteristics included a patient 11numbered circular numerical rating scale (NRS) for pain [24], fatigue, sleep disturbances, and general health (GH), the tender point score (TPS), and the Self-assessment Pain Scale (SAPS).
Page 4 of 12 (page number not for citation purposes)
The NRS questions were: 'Please choose a number between 0 and 10 that best describes the average level of pain you have experienced in the past week (0 = no pain; 10 = pain as bad as it can be)'; 'What number between 0 and 10 best describes the average level of fatigue you have experienced in the past week (0 = no fatigue; 10 = fatigue as bad as it can
Available online http://arthritis-research.com/content/11/4/R125
be)?'; 'How much of a problem has sleep been in the past week (0 = no problem; 10 = severe problem)?'; and 'How would you describe your general health over the past week (0 = very good; 10 = very bad)?'. The tender point examination was carried out by applying the same manual finger pressure with a force of 4 kg (until blanching of the fingernail bed) to each of nine paired anatomical locations The 18 FM tender point sites were: bilateral occiput, low cervical, trapezius, supraspinatus, second rib, lateral epicondyle, gluteal, greater trochanter, and knee [1,17]. For a tender point to be considered 'positive', the patient had to state that the palpation was painful. Regular consensus meetings concerning tender point assessments are part of our routine quality control programme in order to avoid high between-physician variations, but no formal agreement analysis was made for the purpose of this study. The TPS was the total number of tender points. The SAPS considered the pain 'experienced during the past week' in 16 non-articular sites as follows: 'Please indicate below the amount of pain and/or tenderness you have experienced in the last seven days in each of the body areas listed
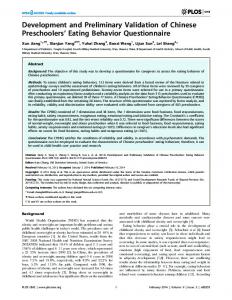
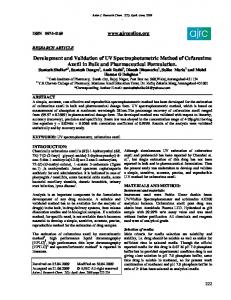
below by putting an X in the boxes (see Figure 1). Please be sure to mark both right and left sides separately'. Below these instructions, a series of site descriptions were followed by four boxes labelled 0 = none, 1 = mild, 2 = moderate, and 3 = severe. The scale scores range from 0 to 48 but, in order to integrate them into one scale they were transformed to a scale of 0 to 10. We then calculated the FAS index, which is a short and easy to complete self-administered index combining a set of questions relating to non-articular pain (SAPS range 0 to 10), fatigue (range 0 to 10), and the quality of sleep (range 0 to 10) that provides a single composite measure of disease activity ranging from 0 to 10. The final score is calculated by adding the three sub-scores and dividing the result by three. All three measures are printed on one side of one page for rapid review, and scored by a health professional without the need for a ruler, calculator, computer, or website (Figure 1). Two quality of life questionnaires were also administered: the specific self-administered FIQ [12] and the generic SF-36 [22]. The FIQ consists of 10 sub-items: the first includes 11 questions concern physical functioning, and each is rated using a four-point Likert scale; items 2 and 3 ask the patient to mark the number of days they felt well and the number of days
Figure 1
The self-administered Fibromyalgia Assessment Status (FAS) (FAS).
Page 5 of 12 (page number not for citation purposes)
Arthritis Research & Therapy
Vol 11 No 4
Salaffi et al.
they were unable to work (including housework) because of FM symptoms; and items 4 to 10 are horizontal linear 10-increment scales by means of which the patients rate the number of days on which they felt good, the number of working days missed, ability to do their job, pain, fatigue, morning tiredness, stiffness, anxiety, and depression [12]. Each item has a maximum score of 10, and so the highest possible score is 100 (the higher the score, the greater the impact of the syndrome on the person). The Italian version of the FIQ has been previously validated [21]. The SF-36 is a general health questionnaire divided into eight scales, each of which measures a different aspect of health [22]. The sub-scale scores are then transformed into a 0 to 100 scale using a scoring algorithm, with higher scores indicating a better quality of life. The SF-36 has been validated for use in Italy [23], and can be completed by most people within 15 minutes. The creators of the SF-36 have also developed algorithms to calculate two psychometrically based summary measures: the physical component summary scale score (PCS) and the mental component summary scale score (MCS) [25]. Statistical analysis Following standard guidelines for evaluating the properties of composite measures, we tested the construct validity, test/ retest reliability, and responsiveness of the FAS index. Construct validity was investigated in three ways. We first explored the underlying component structure of the items by means of exploratory factor analysis (principal component analysis) using principal axis extraction and the varimax rotation method, which maximises the independence of the factors. Principal component analysis was chosen in order to reveal the dimensionality of the score in the patient cohorts and investigate factor loading. An eigenvalue criterion of 1.0 was used to select the factors, and the results are given in terms of the percentage variance in the scale score explained by the principal factor. As an indicator of internal consistency reliability, we calculated Cronbach values (achievable values range from 0, indicating no internal consistency, to 1, indicating identical results), and Cronbach alpha values of more than 0.7 are commonly considered markers of a high degree of reliability. We then examined convergent validity by correlating the scores of the index with the other measures used in the study (the score of a given scale is expected to converge with those of other instruments targeting the same construct, and deviate from those of other instruments assessing a different construct) and quantifying these relationships using Spearman's rho correlation coefficients. Thirdly, in order to investigate the possible influence of patient characteristics such as age, marital status, education, and the number of comorbidities, the associations between these and the FAS index were quantified using Spearman's correlation coefficients, Wilcoxon's rank sum test and Kruskal-Wallis one-way analysis of variance, with the differences being considered significant when the P value
Page 6 of 12 (page number not for citation purposes)
was less than 0.05. Discriminant validity was assessed by means of receiver operating characteristic (ROC) curves and by comparing the ability of the FAS index to distinguish the FM and RA patients participating in the study. ROC curves were plotted for each model in order to determine its area under the curve (AUC), sensitivity and specificity, and then used to compute the optimal cut-off value corresponding to the maximum sum of sensitivity and specificity. Wilcoxon's signed rank test and Fisher's exact test were respectively used for the between-group comparisons of all continuous and categorical variables. Test/retest reliability embraces the concept that the repeated administration of a measurement instrument to stable subjects will yield the same results. After a one-week interval, the patients were asked by the same investigator to repeat all of the clinical measures without having access to any of the previous ratings. As it was possible for a patient's condition to change during this period, the subjects were concurrently administered a 'transitional' global rating of change questionnaire in which they were asked: 'How is your health now in comparison with when you completed the health status questionnaire one week ago?'. The possible response options were 'much better', 'slightly better', 'no change', 'slightly worse', or 'much worse'. The subjects who reported no change were considered stable and those who reported a change were removed from the analysis. Wilcoxon's signed rank test and concordance correlation coefficients (CCC) with 95% confidence intervals (CI) of the mean values were used to check for any significant systematic differences in test/retest administration [26]. The agreements between scores were also illustrated by Bland and Altman plots, with a level of statistical significance of P < 0.05 (twosided). Responsiveness was tested using effect size (ES) and standardised response means (SRMs) [27,28]. The change due to intervention was assessed using Wilcoxon's non-parametric signed rank test, which has the advantage of being robust to distributional assumptions. The chosen level of significance was α = 0.05. ES is calculated as the mean change in score from baseline divided by the standard deviation of the baseline scores, whereas SRM is the mean change in score between assessments divided by the standard deviation of these changes. The 'modified jack-knife test' was used to test whether the difference between two responsiveness measures was statistically significant. The data were processed and analysed using SPSS software (Windows release 11.0; SPSS Inc., Chicago, IL, USA), and MedCalc Software® (Windows release 11.0.0, Mariakerke, Belgium).
Results Study participants The study involved 226 FM patients (209 women and 17 men) with a mean age of 52.1 ± 10.8 years (range 20 to 75), a mean duration of symptoms of 10.5 ± 9.7 years (range 1 to 28), a mean TPS of 15.1 ± 2.4 (range 11 to 18), and a mean pain
Available online http://arthritis-research.com/content/11/4/R125
intensity of 6.8 ± 2.1 (range 2 to 10) as measured using an 11numbered circular NRS. Their educational level was generally low: 41.2% had only attended a primary school, and only 17.9% had attended a high school. Sixty-five percent were living with a partner. The most frequently reported comorbid conditions were cardiovascular disorders (20.1%), metabolic disorders (12.7%), chronic pulmonary disease (10.2%), and gastrointestinal diseases (7.3%): 29.1% of the patients reported one, and 19% two or more (range 2 to 5). The FM patients reported significantly greater levels of fatigue (7.4 ± 4.3; P < 0.001) and sleep disturbance (6.9 ± 4.2; P < 0.001) than the RA patients (206 women, 20 men), who were similar in terms of age (mean age 56.1 ± 11.4 years, range 34 to 87), education level and marital status. The arithmetic mean (standard deviation) of FAS was 6.34 (1.61) and the 95% CI of the mean was 6.09 to 6.49. Validity analysis The construct validity of the FAS index was examined in terms of convergence and discriminant validity. Factor analysis showed that the index constitutes a monocomponent measure in FM. SAPS and fatigue contributed most, and respectively explained 47.46% and 31.23% of the explained variance; sleep explained 21.29%. When testing internal consistency reliability, we found that Cronbach's alpha was 0.781, which indicates a high degree of reliability. As expected, the FAS index had more significant correlations with total FIQ (rho = 0.347; P < 0.0001) and the FIQ sub-scales, particularly job ability fatigue (rho = 0.534; P < 0.0001), fatigue (rho = 0.379; P < 0.0001), morning tiredness (rho = 0.309; P < 0.0001), and pain (rho = 0.303; P < 0.0001) (convergent construct validity; Table 3). There were negative correlations with the SF-36 as higher SF-36 scores indicate more and higher FAS scores less well-being: the correlation between FAS and SF36 MCS (rho = -0.531; P < 0.0001; Table 4) was particularly interesting, but the correlations with the SF-36 sub-scales and summary measures were not as close as those between FAS and the FIQ. The three component variables of FAS correlated with each other moderately to highly, with the closest correlation between NRS-fatigue and NRS-sleep (rho = 0.568; P < 0.0001). There were also close correlations between the TPS and FAS (rho = 0.391; P < 0.0001), between the SAPS and the SF-36 MCS (rho = -0.297; P < 0.0001), and between the TPS and the SF-36 MCS (rho = -0.373; P < 0.0001). Women tended to have higher FAS values than men (Wilcoxon's test: W = -2.19; P = 0.022), but there were no significant gender or age-related differences (four age-groups ranging from 20 to 34 years to 75 years). The respondents with a low educational level were more often classified as having high levels of disease activity, and stratification into three categories confirmed that increasing education was associated with lower FAS values: primary school = 7.2 ± 1.8; secondary school = 6.3 ± 1.5; high school/university = 5.5 ± 1.6; Kruskal-Wallis test: P < 0.002). Furthermore, the patients with comorbid conditions had worse disease activity scores (Kruskal-Wallis test: P