The paper proposed an intensity modulated bi-axial accelerometer made from ... axial accelerometer using plastic optical fiber (POF) for wind turbine SHM, ...
Development of a Bi-axial Accelerometer Based on Intensity Modulated Plastic Optical Fiber for Wind Turbine Monitoring Y. GE, S. T. QUEK and K. S. C. KUANG
ABSTRACT The paper proposed an intensity modulated bi-axial accelerometer made from plastic optical fiber. The comparing to traditional piezo-electric accelerometer, the proposed design is light-weight, low-cost and immune to electromagnetic interference. The bi-axial acceleration was measured by light intensity coupling between a cantilever fiber and two receiving fibers. With pre-calibration, the two light intensity output are used to compute x and y components of a 2D acceleration. The frequency response test showed stable performance of the accelerometer up to 80 Hz, which is sufficient for the purpose of wind turbine monitoring. INTRODUCTION The wind energy industry, buoyed by the global interest in renewable energy, has seen rapid growth in recent years. As modern wind turbines are becoming larger in size and are often located in remote areas, there is an increasing need for a structural health monitoring (SHM) system with various types of on-board sensors. The accelerometer is a commonly-used sensor to capture the vibration characteristics of a structure. However, the traditional piezoelectric accelerometer is prone to electrical magnetic field interference and lightning strikes, which are common problems facing by operational wind turbines. This paper proposes a biaxial accelerometer using plastic optical fiber (POF) for wind turbine SHM, which is low-cost, simple in instrumentation and immune to electromagnetic field interference. LITERATURE REVIEW Developments of fiber optics based accelerometers have been reported, where a number of studies focused on the wavelength modulated optical fibers, in particular, Fiber Bragg Gratings (FBG) based accelerometer. Due to the dual sensitivity of the Department of Civil Engineering, National University of Singapore, No.1 Engineering Drive 2, Singapore 117576
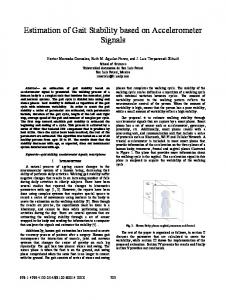
FBG, the accelerometer requires carefully-designed mechanisms to enforce temperature self-compensation. Zhou et al. [1] bonded FBG in a slant direction onto a cantilever beam with a mass attached to its free end. The design is strain-chirped and temperature insensitive. Teng Li et. al. [2] attached two FBG to the upper and lower side of a cantilever beam. Combination of the two responses removes the temperature effect. The FBG-based sensors offer the advantage of signal immunity to power fluctuation and noise. However, FBG fiber is very fragile and requires care in handling. The design generally consists of at least two FBG fibers or multiplexed gratings for temperature compensation. Thus, the vibrating structure is complex in design and difficult to miniaturize without precision machining techniques. Besides employing wavelength modulated optical fiber, an alternative is to use intensity modulated fiber. Owing to the simple manufacturing process, intensity modulated fiber is more cost-effective compared to FBG. Moreover, it requires only a low cost and lightweight detection system, such as LED (light-emitting diode) and photodetector, instead of tunable laser source and wavelength interrogator in the case of FBG. The intensity modulated system has potential to be made more compact and light A few researchers have worked on intensity modulated accelerometer. The designs generally used the cantilever beam configuration which requires no additional spring or mass. The acceleration is measured by the intensity coupling between a cantilever fiber and a fixed fiber. Lopez-Higuera [1] designed an accelerometer from multi-mode glass fiber. The natural frequency of the fiber is about 330Hz and able to detection of vibration frequency up to 140Hz. The sensor was tested for 1000 hours under its natural frequency with stable reliability. Barbosa et al. [2] employed single-mode glass fiber to achieve frequency bandwidth up to 2000Hz. Single-mode fiber has the advantage of being able to measure high frequency because of its thin diameters (8 to 10µm). However, singlemode fiber requires laser light source and etched silicon microbench for fiber mounting. As the wind turbine is a large structure with blade span as long as 100 meters, the modal frequencies are in the range of 10Hz [3, 4]. Hence multi-mode fibers are sufficient for the purpose of monitoring wind turbine. In this study, plastic optical fiber (POF) was employed instead of glass optical fiber (GOF) which was used in the past works. Compared to GOF, POF is not only lighter and cheaper but also easier to handle and has higher fatigue resistance, making it a better choice for signal transmission in a vibrating structure such as the wind turbine. SENSOR DESIGN AND WORKING PRINCIPLE Single-axial accelerometer Most accelerometers are designed based on the model of a simple oscillator which consists of a mass M, spring with constant K, and damper with constant C as shown in Figure 1. The structure is being excited by a ground excitation �� � ���, which is the acceleration of the vibrating structure.
M Accelerometer C
K
�� � ��� Vibrating Structure Figure 1. Schematics of simple oscillator model of an accelerometer
The governing equation is ��� ��� � � ��� � ����� ��� � ��� (1) ��� Assuming that the ground excitation can be expressed as �� � �sin �� ��� � is the excitation frequency, the solution to Eq. (1) is given by where � "# %�1 β( �sin�ω u�t� e���� �Asinω� t � Bcosω� t� � � t� 2ξβcos�ω � t�+D( (2) $ where the damping ratio - , natural angular frequency �, and other parameters involved are defined as 0
� 7
2
� /1 , - (√01 , ω� 41 - ( 5, 6 7 , 8
9
4�(:;�< =�9�; < �
? ���� 0 sin �� �� @� (3) (:;
where @ is the phase lag calculated by @ tan�9 9�;< .
� well below �, θ is negligible. Under such For a system with small ξ and � conditions, �� � ��� �sin �� ��� is proportional to the displacement of the oscillator
����
1>? 0
sin �� ���, that is,
0
�� � ��� B 1? ���� (4) Pre-calibration can be done to obtain the proportional constant and hence an accelerometer can be made to measure displacement and then factored to give the acceleration of the ground excitation. The development of signal-axial fiber optic accelerometer has been found in a few literatures [1, 5]. The configuration generally consists of a cantilever fiber and a fixed fiber as shown in Figure 2. The cantilever fiber is equivalent to a springmass system which displace under external acceleration. The displacement of the fiber tip can be measured by the light intensity coupled between the two fibers. Hence acceleration can be measured as it is directly related to displacement as shown in equation (4). The light intensity coupling between two fibers was studied in an experiment in which two multi-mode POF were positioned with varying lateral offset and a 1mm gap between the two fiber ends. The results are shown in Figure 3.
Optical fiber Integrated LED light source with photodetector
Acrylic base and casing
Gap between fiber tips
Figure 2. Schematics of a single-axial fiber optic accelerometer 2.5
Light intensity (V)
2
1.5 1
0.5
0 -0.5
0 Lateral offset (mm)
0.5
Figure 3. Transmitting light intensity vs. lateral offset for the coupling between two POF with 250µm diameter and 1mm gap in between
The dynamic characteristic of a cantilever fiber can be obtained from standard dynamics textbooks. If Hamilton’s principle is employed with an assumed mode shape C, the natural frequency and displacement amplitude can be found as 9
S
FG
D (E /HG , |�| |�� � |JG 8/L G
(5a, 5b)
S
where JG PT J � C( QR , L G PT UV�CWW�( QR . J � represents the mass per unit length, I is the second moment of area and E is the Young’s modulus of the material. For example, for a cantilever fiber with length 20mm and diameter of 250µm made from Polymethyl methacrylate (PMMA), the tip displacement for 10g acceleration is in the scale of 10µm. Since the fiber tip only displaces within a local intensity field, the relationship between fiber displacement and light intensity are approximately linear. Hence the light intensity can be calibrated with respect to acceleration using a linear regression model. In practice, considerable efforts are needed to constrain the motion of the cantilever fiber which has a circular cross-section to be uni-directional without affecting accuracy. Hence, no effort is made in this aspect but the accelerometer is designed to be bi-axial. Bi-axial accelerometer By using two fixed receiving fibers coupled with one cantilever fiber, the unidirectional accelerometer can be extended to function as a bi-axial accelerometer
(Figure 4). The POF is not constrained against motion in the lateral direction hence it can detect vibrations in two dimensions. POF
CH1
CH2
2 Channel photodetector
LED light source Acrylic base in casing
Figure 4. Schematics of the bi-axial accelerometer
Position of the two receiving fibers in the intensity field
Figure 5. Schematic of light intensity emitted by multi-mode fiber tip onto a 2D plane
The light intensity field from a POF projected to a 2D plane is shown in Figure 5, where the intensity distribution is axisymmetric and varies along the radial direction. The two receiving fibers indicated in the figure measures the local intensity at their respective locations. The entire intensity field will shift relative to the fixed fibers when the cantilever fiber displaces. The calibration needs to be conducted by attaching a reference accelerometer to obtain the x and y components of the acceleration, ax and ay. At the same time, the intensities of the two fixed fibers are recorded, denoted by I1 and I2. Then linear regression can be applied to obtain the linear field relationship, given by, [9\ [9] _\ V V X 9 Y Z[ ^ Z ^ � X T9 Y (6) V( VT( (\ [(] _] where the constants c1x, c1y, c2x, c2y, I01 and I02 are coefficients obtained from calibrated data. EXPERIMENTAL SETUP AND RESULTS The POF selected in the experiment is a multi-mode step index fiber made from PMMA. The core diameter and cladding diameter are 240µm and 250µm respectively. The cantilever fiber is 20mm long, with 1mm gap from the receiving fiber. The device is capsulated in an acrylic casing with dimension of 30mm×10mm×10mm. The natural frequency of the cantilever fiber was estimated to be 132Hz using equation (5a).
Integrated module of LED and photodetector
Fiber optic Accelerometer Reference Accelerometer
Accelerometer Preamplifier
Power Amplifier
Oscilloscope
Shaker
Figure 6. Experimental setup for testing of optical fiber accelerometer
The performance of the designed accelerometer is tested by the setup shown in Figure 6. The optical fiber accelerometer was attached together with a reference accelerometer on a platform excited by a shaker, first in one direction. The voltage outputs from the two accelerometers were captured by an oscilloscope. The response of POF accelerometer and reference accelerometer matched well for a pure sinusoidal signal and signals containing several frequencies. An example of the latter is shown in Figure 7, where the POF output in g (9.81m/s2) was converted from voltage values using a calibrated linear relationship between these quantities. Frequency response indicates the amplitude of fiber optics accelerometer output over a range of frequencies. It is an important factor to measure the bandwidth of the accelerometer. The frequency response was experimentally obtained as shown in Figure 8. The natural frequency of the accelerometer is 120Hz which agrees well with theoretical estimation of 132Hz. The response below 100Hz is flat, and rises sharply from 100 to 120Hz. The phase lag is below 5º for frequencies lower than 80Hz. Hence the performance of the accelerometer is more accurate when frequency range of interest is below 80 Hz. The linearity of the POF response was tested up to 0.45g and shown in Figure 9. Due to the limitation of the available shaker, a larger range of linearity cannot be tested.
0.3
0.1
0
-0.1
-0.2
Reference accelerometer POF accelerometer
10 Power Spectral Density
0.2 Acceleration (g)
12
Reference Accelerometer POF Accelerometer
8 6 4 2
0
0.2
0.4 0.6 Time (sec)
0.8
1
0
10
20
30 40 Frequency(Hz)
50
60
Figure 7. POF and reference accelerometer signal-axial test: (a) time history, and (b) frequency domain
100
(a)
(b) 80
3
Phase Lag (degree)
Amplitude (POF/acceleration)
4
2
1
60
40
20
0
0
50
100 Frequency (Hz)
0
150
0
40
80 120 Frequency (Hz)
160
200 240
Figure 8. The amplitude (a) and phase lag (b) vs. excitation frequency 0.2
POF amplitude (V)
0.18
POF = 0.37*acceleration + 0.011
0.16 0.14 0.12 0.1 0.08 0.2
0.25
0.3 0.35 0.4 Acceleration (g)
0.45
0.5
Figure 9. Linearity of POF optical fiber at 80 Hz
To test the performance of the accelerometer for its bi-axial measurements, the prototype was first calibrated under excitation along x direction. The outputs I1 and I2 were plotted with respect to acceleration along x direction (Figure 10). As shown in equation (6), the parameters c1x and c2x are the slopes of the two linear fit in Figure 10a and 10b respectively, and I01 and I02 are the intercepts. Averaged values of c1x, I01, c2x and I02 were obtained from 5 sets of experimental data (Table I). Calibration of y direction was done similarly to obtain values of c1y and c2y, which are -0.0168 and -0.00032 respectively. With the parameters obtained, equation (6) was used to calculate ax and ay based on I1 and I2. Figure 11 shows a comparison between reference accelerometer output and POF accelerometer output.
TABLE I. CALIBRATION OF I1 AND I2 WITH RESPECT TO X ACCELERATION Data set
Linear regression of I1 vs ax 2
Linear regression of I2 vs. ax
c1x
I01
R
c1y
I02
R2
1
-0.0098
0.068
0.993
0.00905
0.025
0.996
2
-0.00996
0.067
0.980
0.00873
0.025
0.992
3
-0.00988
0.068
0.991
0.00895
0.025
0.994
4
-0.00997
0.067
0.984
0.00924
0.026
0.989
5
-0.00987
0.067
0.993
0.00890
0.025
0.995
Average
-0.00990
0.067
0.989
0.00898
0.025
0.993
0.072 0.07
(a)
0.028
0.068
I2 (V)
I1 (V)
0.03
data linear
0.066
0.026 0.024
(b)
0.064
data linear
0.022
0.062 -0.4
-0.2
0 ax (g)
0.2
0.4
-0.4
-0.2
0 ax (g)
0.2
0.4
0.8
Y Accecleration (g)
X Accecleration (g)
Figure 10. Linear regression of I1 (a) and I2 (b) vs. x acceleration to obtain c1x, I01, c2x and I02 Reference POF
0.6 0.4 0.2 0 -0.2 -0.4
0
0.2
0.4 0.6 Time(sec)
0.8
1
Reference POF
0.5 0 -0.5
0
0.2
0.4 0.6 Time(sec)
0.8
1
Figure 11: Acceleration along x and y directions measured from POF accelerometer and reference accelerometer
The two responses shown in Figure 11 agree well in general except small discrepancies at some locations. Two reasons may account for the discrepancies, the phase lag and small linearity range. The POF signal is also observed to be noisier due to the fluctuation of the light source. To improve the performance of the accelerometer, other types of fiber with higher Young’s modulus and smaller diameter will be considered to improve the phase lag and linearity range. CONCLUSIONS AND FUTURE WORKS The paper proposed an intensity modulated bi-axial accelerometer based on POF. The performance of accelerometer was tested with good frequency response and linearity up to 80Hz and 0.45g. Some of the future works include packaging and miniaturize the accelerometer and improve the design to tri-axial accelerometer. REFERENCES 1.
2.
3. 4.
5.
Lopez-Hignera, J.M., M.A. Morante, and A. Cobo, "Simple low-frequency optical fiber accelerometer with large rotating machine monitoring applications". Journal of Lightwave Technology, 1997. 15(Copyright 1997, IEE): p. 1120-30. Barbosa, F.R., et al. "A novel optical accelerometer". in 2005 SBMO/IEEE MTT-S International Microwave and Optoelectronic Conference, July 25, 2005 - July 28, 2005. 2005. Brasilia, Brazil: Institute of Electrical and Electronics Engineers Inc. Hansen, M.O.L., et al., "State of the art in wind turbine aerodynamics and aeroelasticity". Progress in Aerospace Sciences, 2006. 42(Compendex): p. 285-330. Cui, Y., L. Shi, and F. Zhao. "Modal analysis of wind turbine blade made of composite laminated plates". in Asia-Pacific Power and Energy Engineering Conference, APPEEC 2010, March 28, 2010 - March 31, 2010. 2010. Chengdu, China: IEEE Computer Society. Rudge Barbosa, F., et al. "A novel optical accelerometer with wide operation range". in Sensors for Harsh Environments II, 23 Oct. 2005. 2005. USA: SPIE - The International Society for Optical Engineering.