10.2478/v10048-012-0029-2
MEASUREMENT SCIENCE REVIEW, Volume 12, No. 5, 2012
Design of MEMS Accelerometer based Acceleration Measurement System for Automobiles K. Arun Venkatesh, N. Mathivanan University Science Instrumentation Centre, Madurai Kamaraj University, Madurai, 625021, India. email:
[email protected],
[email protected]. Design of an acceleration measurement system using a MEMS accelerometer to measure acceleration of automobiles in all the three axes is presented. Electronic stability control and anti-lock breaking systems in automobiles use the acceleration measurements to offer safety in driving. The system uses an ARM microcontroller to quantize the outputs of accelerometer and save the measurement data on a microSD card. A LabVIEW program has been developed to analyze the longitudinal acceleration measurement data and test the measurement system. Random noises generated and added with measurement data during measurement are filtered by a Kalman filter implemented in LabVIEW. Longitudinal velocity of the vehicle is computed from the measurement data and displayed on a graphical chart. Typical measurement of velocity of a vehicle at different accelerations and decelerations is presented. Keywords: MEMS Accelerometer, acceleration measurement, ARM microcontroller, LabVIEW, Kalman filter
1. INTRODUCTION
E
LECTRONIC STABILITY CONTROL (ESC) systems are being implemented in automobiles to prevent potential understeer and oversteer [1]. The ESC system effectively reduces the number of accidents by 30-50 % for cars, 50-70 % for SUVs and 70-90 % in roll-overs [2]. The ESC systems measure wheel speed, longitudinal velocity, yaw rate and steering wheel angle and control the braking system in the vehicle [1]. MEMS accelerometers can be used in velocity, acceleration, and vibration measurements in a vehicle.
MEMS accelerometers have been used in vibration measurements by G. J. Stein et al [3], [4]. In the present study, a system has been designed to measure the acceleration of a vehicle in all the three axes using a MEMS accelerometer. A LabVIEW program has been developed to analyze the measurement. The LabVIEW program includes a Kalman filter to remove the quantization and process noises in the measurement. The design of the measurement system and the implementation of the Kalman filter algorithm on LabVIEW platform are described below.
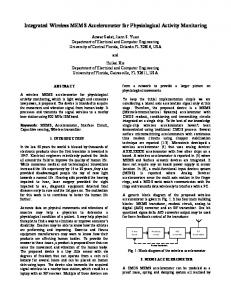
Fig.1. Circuit Diagram of the Measurement System
189
MEASUREMENT SCIENCE REVIEW, Volume 12, No. 5, 2012
minutes and saves data sampled during the period in the file.
2. SYSTEM DESIGN A. Hardware The measurement system is built around a 3-axis MEMS accelerometer (Freescale Semiconductor MMA7361L), an ARM7 microcontroller (LPC2129) and a mass storage device (2GB microSD card). The circuit diagram is shown in Fig.1. The sensitivity of the accelerometer sensor is kept at ±0.0204 V/ms-2 by applying logic low to the g-select pin. The operating range of the sensor is ±58.8 ms-2. The X, Y and Z outputs of the accelerometer are buffered and filtered with anti-aliasing filters. Since the bandwidth response of the sensor is given as 400 Hz for X and Y outputs and 300 Hz for Z output [5], the buffered X, Y and Z outputs are filtered with first-order anti-aliasing filters of respective cutoff frequencies before quantization to ensure prevention of aliasing. The buffers and anti-aliasing filters use LM324 opamps. The outputs of the filters are applied at the analog inputs of the microcontroller. The microcontroller has 4 analog input channels and a built-in 10-bit ADC [6]. Since the ADC operates with +3.3V reference, the resolution of the ADC is 3.23 mV. The input signals are digitized using the ADC. Hence, the resolution of the measurement system is 0.1581 ms-2. The resolution can be improved to 0.03951 ms-2 by applying logic high to the g-select pin which selects the sensitivity of the sensor to be +/-0.0816 V/ms-2. The low-cost and compact microSD card [7] is interfaced to the SPI port of the microcontroller. One of the GPIO lines of the microcontroller is used as a chip enable for the microSD card. The system requires 1.8 V and 3.3 V power supplies for operation and the required supply voltages are derived from a 9V battery using H1117 IC voltage regulators. The on-board battery supply of the automobile can also be used to power the measurement system for a prolonged period of operation.
Fig.2. Format of the 6-byte Data Packet
3. SOFTWARE FOR ANALYSIS A LabVIEW program has been developed to read the sampled data from a file and to analyze it. The acceleration in the direction of X-axis, aX(t), is given by ⎛ ⎛ 3.3 ⎞ g ⎞ × Q X (t )⎟ − offset ⎟⎟ × a X (t ) = ⎜⎜ ⎜ ⎠ ⎝ ⎝ 1023 ⎠ 0.2
Where, g = 9.8 ms-2 acceleration due to gravity QX(t) - quantized data of X output at time t offset - output voltage of the accelerometer at rest in V In discrete time sampled data system the measurements include additive random noises [8]. A Kalman filter is commonly used to reduce random noises. A brief introduction to the Kalman filter is given below. A. Kalman Filter The Kalman filter is extensively used in the area of autonomous or assisted navigation. It is used for combining inexact forecast of a system’s state with an inexact measurement of the state [9]. Let us assume the unknown state of the system as x[t] and the measurement as z[t], then the prediction equations are given as,
B. Data Acquisition The data acquisition firmware has been developed on IAR Embedded Workbench IDE and downloaded into the microcontroller. The program performs the following tasks in sequence. 1. Initializes the on-chip PLL of ARM microcontroller to generate a core clock (CCLK) frequency of 60MHz from a 12MHz crystal. 2. Initializes the on-chip real-time-clock and SPI port of the ARM microcontroller. 3. Initializes the microSD card for Microsoft’s FAT32 file format with 512 bytes per sector and 8 sectors per cluster. 4. Samples the X, Y and Z inputs at 1kHz sampling rate. (The internal free-running timer which is triggered by the CCLK provides the required timing signal for sampling.). 5. Stores the quantized data as 6-byte data packet in a circular buffer of size 4kB created in the internal RAM. The format of the data packet is shown in Fig.2. 6. Creates a file and saves the data packets in the file. The sampling instant of the first data is given as the filename in the format of YDDDHHMM.txt (Y-Year, DDDday of the year, HH-Hour, MM-Minute). Data sampled during a period of 5 minutes are saved in one file. Hence, the program creates a new file for every 5
(1)
xˆ − [t ] = xˆ − [t − 1]
(2)
P − [t ] = P [t − 1] + Q
(3)
The Kalman gain is given by
K [t ] =
P − [t ]
(4)
P − [t ] + R
The state update is given by
(
xˆ [t ] = xˆ − [t ] + K [t ] z [t ] − xˆ − [t ]
)
(5)
The covariance update is given by
P [t ] = P − [t ] (1 − K [t ]) Where,
190
xˆ − [t ] - predicted state estimate at t
P − [t ] - predicted covariance estimate at t
(6)
MEASUREMENT SCIENCE REVIEW, Volume 12, No. 5, 2012
Q
The velocity in the direction of X-axis, vX(t) in ms-1, is obtained by integrating the acceleration in X direction [10] and assuming initial velocity v0 as zero, and is given by
- process noise covariance
K [t ] - Kalman gain at t R - measurement noise variance z [t ] - measurement value at t
t
v X (t ) = ∫ a X (t ) dt + v0
xˆ [t ] - posteriori state estimate at t
0
P [t ] - posteriori covariance estimate at t
Fig.3. Front Panel of the LabVIEW program
Fig.4. Block diagram of the LabVIEW program
191
(7)
MEASUREMENT SCIENCE REVIEW, Volume 12, No. 5, 2012
Fig.5. Block diagram of the Kalman filter SubVI
4. RESULTS AND DISCUSSION
B. LabVIEW Program The LabVIEW program performs the following functions. Fig.3 and Fig.4 show the front panel and block diagram of the program. 1. Reads measurement data from a file and computes accelerations along the three axes. 2. Displays acceleration vs. time on a graphical chart. 3. Applies the Kalman filter algorithm to filter the random noises from the measurement data. The Kalman filter algorithm is implemented as a subVI and is shown in Fig.5. 4. Computes velocity from acceleration and displays velocity vs. time on a graphical chart. C. Testing Kalman Filter The Kalman filter subVI is tested with a noisy sine wave simulated by mixing a Gaussian white noise with variance 0.04 to a sine wave of frequency 2Hz and amplitude 1.5. The output of the Kalman filter and the noisy sine wave are shown in Fig.6.
Fig. 6. Kalman Filter’s Output for a Simulated Noisy Sine wave
The dotted line shows the simulated data. The continuous line shows the output of the Kalman filter. The Kalman filter is able to filter the random noise while keeping track of the signal.
The measurement system is mounted on a vehicle. In ground transportation, low frequency vibrations in the range of 1 Hz to 80 Hz exist [3]. Hence, the measurement data includes vibratory acceleration too. The digital integration algorithm (7) which uses trapezoidal rule for numerical integration, serves as a low pass filter tuned to a cut-off frequency of 0.225 Hz. The integration algorithm removes the vibratory acceleration and computes longitudinal velocity from the measurement data. Suitable ‘Stop and Go maneuver’ [11] is performed on the vehicle. ‘Stop and Go maneuver’ is similar to driving maneuver in city streets where congested traffic exists. Tests are conducted to evaluate the measurement system. The results of the tests are shown in Fig.7. Test 1: The test is carried out to study the response of the measurement system for normal braking and hard braking as given below. 1. The vehicle is accelerated from rest to 35 kmhr-1 and then the velocity of the vehicle is reduced to 30 kmhr-1 by normal braking. 2. The vehicle is accelerated to 40 kmhr-1 and maintained at the same velocity for about 12 seconds. Then the vehicle is decelerated by hard braking and brought to a halt. 3. After 4 seconds the vehicle is again accelerated to 40 kmhr-1 and the vehicle is rapidly decelerated by hard braking. Result of Test 1 shown in Fig.7(a) clearly depicts the difference in response to hard braking and normal braking. Test 2: The test is carried out to study the response of the system to successive braking. 1. The vehicle is accelerated from rest to 27 kmhr-1. 2. The vehicle is accelerated and decelerated successively by normal braking. 3. The average velocity of the vehicle is maintained at 15 kmhr-1. Result of Test 2 is shown in Fig.7(b). It shows the response to successive braking.
192
MEASUREMENT SCIENCE REVIEW, Volume 12, No. 5, 2012
Fig. 7. Results of (a) Test 1 and (b) Test 2.
5. CONCLUSION The accelerometers in combination with gyroscopes are used to construct inertial measurement units. Also a GPS receiver along with the measurement system and extended Kalman filter algorithm can be used to measure the position of the automobile. The measurement system can be used to find the deceleration rate of the vehicle. The deceleration rate measured by the accelerometer is used in anti-lock
braking systems. The deceleration rate is also used for brightness control of brake lamps in automobiles [12]. The measurement system can also be used to monitor the vehicle health parameters like engine temperature, engine rpm, fuel level, etc., by adding suitable sensors to the measurement system. The ARM microcontroller in the measurement system has a built-in CAN interface to facilitate the networking of sensors for remote data acquisition.
193
MEASUREMENT SCIENCE REVIEW, Volume 12, No. 5, 2012
[7]
REFERENCES [1]
[2]
[3]
[4]
[5]
[6]
Tseng, H.E., Ashrafi, B., Madau, D., Allen Brown, T., Recker, D. (1999). The development of vehicle stability control at Ford. IEEE/ASME Transactions on Mechatronics, 4 (3), 223-234. Ferguson, S.A. (2007). The effectiveness of electronic stability control in reducing real-world crashes: A literature review. Traffic Injury Prevention, 8, 329-338. Stein, G.J., Chmúrny, R., Rosík, V. (2011). Compact vibration measuring system for in-vehicle applications. Measurement Science Review, 11 (5), 154-159. Stein, G.J., Chmúrny, R., Rosík, V. (2007). Measurement and analysis of low frequency vibration. Measurement Science Review, 7 (3), 47-50. Freescale Semiconductors, Inc. (2008). ±1.5g, ±6g Three Axis Low-g Micromachined Accelerometer – Technical Data. Document Number MMA7361L, Rev 0, 04/2008. NXP B.V. (founded by Philips) (2008). UM10114 – LPC21xx and LPC22xx User Manual. Rev. 03 – 2 April 2008.
Coopmans, C., Yang Quan Chen (2008). A generalpurpose low-cost compact spatial-temporal data logger and its applications. In IEEE AUTOTESTCON 2008, 8-11 September 2008. IEEE, 64-68. [8] Welch, G., Bishop, G. (2002). An Introduction to the Kalman Filter. TR-95-041. Department of Computer Science, University of North Carolina at Chapell Hill. [9] Rojas, R. (2003). The Kalman Filter. Technical Report, Freie University of Berlin. [10] Liu, H.H.S., Pang, G.K.H. (2001). Accelerometer for mobile robot positioning. IEEE Transactions on Industry Applications, 37 (3), 812-819. [11] Naranjo, J.E., Gonzales, C., Garcia, R., de Pedro, T. (2006). ACC+Stop&go maneuvers with throttle and brake fuzzy control. IEEE Transactions on Intelligent Transportation Systems, 7 (2), 213-225. [12] Neurauter, M.L., Llaneras, R.E., Wierwille, W.W. (2009). The design and assessment of attention-getting rear brake light signals. In Proceedings of the Fifth International Driving Symposium on Human Factors in Driver Assessment, Training and Vehicle Design, 22-25 June 2009. Received February 10, 2012. Accepted September 12, 2012.
194