Proceedings of the Twenty-fifth (2015) International Ocean and Polar Engineering Conference Kona, Big Island, Hawaii, USA, June 21-26, 2015 Copyright © 2015 by the International Society of Offshore and Polar Engineers (ISOPE) ISBN 978-1-880653-89-0; ISSN 1098-6189
www.isope.org
Development of a Gap-Filling Algorithm Applicable to a Tsunami Warning System Jun-Whan Lee and Sun-Cheon Park Global Environment System Research Division, National Institute of Meteorological Research Seogwipo-si, Jeju, Korea
Recently, several soft computing techniques for the gap-filling problem, such as Chaos theory, Genetic Programming, Artificial Neural Network, have been studied (Elshorbagy, Simonovic and Panu, 2002; Ustoorikar and Deo, 2008; Nitsure, Londhe and Khare, 2014). Although soft computing techniques have an advantage in accuracy, these applications require a huge computing time.
ABSTRACT Most of tsunami detection algorithms require continuous water level data. However, due to several reasons such as the failure of the recording or transmission equipment, some data are lost, which make the tsunami detection algorithm to stop for a while even after restarting the recording. In this study, we developed a gap-filling algorithm inside the tsunami warning system which could automatically perform in real time so that the tsunami detection algorithm could run immediately after restarting the recording. An overview of the algorithm and a case study using an Ulleungdo tide gauge are presented.
In this study, we developed a simple gap-filling algorithm which could automatically perform in real time so that the tsunami detection algorithm could run immediately after restarting the recording. The following section outlines the algorithm, and a case study using an Ulleungdo tide gauge in Korea is presented.
KEY WORDS: Tsunami; detection; gap-filling; tide station. METHOD INTRODUCTION The gap-filling algorithm proposed uses the hypothesis that the missing data will follow the trend of the past water level movement. Fig. 1 shows a flow diagram of the gap-filling algorithm. When the gap appears, the target window consisting of target data, two end-points (EP1 and EP2) and gap is defined. The search window set of the same length as the target window is defined from the data just before the gap, and it moves toward the last point of msearch. In this study, we used the gap length plus two end-points for the length of both target data and search data, and 100 times the size of the target window for the msearch. For each search window, after calculating a mean absolute error (mae) between the target data and the search data, these were sorted in an ascending order. In order to remove a chance to choose the search window which contains an unusual event such as tsunami, we selected the search window that shows the minimum mae after neglecting the maes that come under the event periods. The SW data (in Fig. 1), the rest part of the selected search window concealed in the search data, were rebalanced by the end-point fixing method (EPFM) newly devised to keep the continuity of time series (see Fig. 2). With the first and the last points of SW data fixed to the EP1 and EP2, the intermediate data are linearly balanced using Eq. 1:
A tsunami is a devastating natural hazard mainly caused by a large submarine earthquake. In order to detect a tsunami, several tsunami detection algorithms have been developed. The pacific marine environmental laboratory has developed a real-time tsunami monitoring system using DART (Deep-ocean Assessment and Reporting of Tsunamis) buoys (Mofjeld, 1997; Meinig, Stalin, Nakamura and Milburn, 2005). The DART algorithm uses a cubic polynomial fit to the data over the preceding three hours. If the DART index, the absolute value of the difference between the observed data and the predicted data using the DART algorithm, exceeds a pre-defined threshold, the warning alarm alerts. Bressan and Tinti (2011) have developed a realtime algorithm called TEDA (Tsunami Early Detection Algorithm) to detect a tsunami using a slope of signal. The TEDA requires a few hours of the past data which depend on parameters to run the algorithm. Therefore, it is important to record the sea level continuously. However, due to several reasons, such as the failure of the recording or transmission equipment, aging equipment, and mistakes by field staff, sometimes the data are not recorded (Ustoorikar and Deo, 2008). This gap makes the tsunami detection algorithm to stop for a while even after restarting the recording. If the gap is short, we may use a linear interpolation. However, if the gap is long so that it should include a nonlinear pattern, the linear interpolation is not available anymore.
HEP (t)=Hori (t)+(b-a)/d (t-c)+a for ctc+d
860
(1)
Fig. 1. Flow diagram of the gap-filling algorithm. The sequence of the colored rectangles represents the time series of tide station while the white rectangles represent the gap. where HEP (t) is the water level after applying the EPFM, Hori (t) is the water level before applying the EPFM, a is h1-h2, b is h4-h3, c is t1, and d is t2-t1. And finally, the SWEP data (in Fig. 1), not only selected but also rebalanced, are used to replace the gap.
Institute of Meteorological Research (NIMR) is developing a tsunami warning system applicable to the East Sea based on a moving average filter using 11min for a subset size. However, the filter could distort the tsunami data which makes the tsunami detection algorithm to miss the alarming point. Thus, when a large submarine earthquake is detected, the event mode which stops the moving average filter and uses the original water level data until the difference between the filtered data and the original data is less than the threshold (3cm) is applied to the developing tsunami detection algorithm. The gap-filling algorithm also uses the same filtered data to perform in real time automatically with the tsunami detection algorithm.
RESULTS We applied the gap-filling algorithm to the water level data of the Ulleungdo tide station located in the East Sea (see Fig. 3). The data from January 1, 2010 to December 31, 2011 were downloaded from the website operated by the Korea Ocean Observing and Forecasting System (KOOFS). Because the East Sea is strongly influenced by the wind wave, the data contain high-frequency noise that affects the sensitivity of the tsunami detection algorithm. Fortunately, Lee, Cho and Woo (2005) reported that the eastern part of the Korean peninsula has two hours of time span to prepare the tsunamis generated along the active fault zone in the East Sea. For these reasons, the National
Fig. 3. Location of the Ulleungdo tide station (37.491 N, 130.914 E).
Fig. 2. Schematic sketch of the end-point fixing method (EPFM).
861
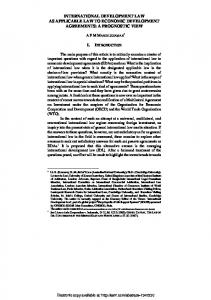
Fig. 4. Scatter plot of measured water levels and calculated water levels when the gap sizes are (a) 3hr, (b) 6hr, (c) 12hr, and (d) 24hr. The colored point represents the frequency of how many data are plotted inside the circle with a radius of 1cm. In order to test the performance of the gap-filling algorithm, we intentionally made a gap and predicted the water levels of the gap. Fig. 4 shows a scatter plot of the measured water levels and calculated water levels for 200 cases that start from August 9, 2011 00:00 with 1,000min intervals. As the gap size increases from 3hr to 6hr and to 12hr, not only the root mean square error (rmse) and the mean absolute error (mae) increase but also the correlation coefficient (r) decreases. Exceptionally, when the gap size increases from 12hr to 24hr, comparatively higher accuracy is obtained. However, the results show that the overall accuracy is reasonable for filling the gap within 24hr in less than about 6cm of rmse.
conducting the EPFM, the predicted data show the statistical parameters of 3.55cm for the rmse, 2.99cm for the mae, and 0.93 for the r. Fig. 5(c) shows the similar case with Fig. 5(b). However, because the end-point of the search window data is similar to the end-point of the measured data, even after applying the EPFM, the difference between the predicted data and the measured data remained. Fig. 5(d) shows the case where the initial parts of the search data slightly differ from the target data but the predicted data show a good agreement with the measured data. We should note that even though some predicted data overestimate the water level, every predicted data follows the trend of measured data so that it does not contain any phase shift problem.
DISCUSSION
Fig. 6 shows the time series of the Ulleungdo tide station from March 9, 2011 to March 12, 2011. In this period, both the gap (from March 9, 2011 15:23 to March 10) and the Tohoku tsunami event (starts from March 11, 2011 14:46) are included. Because the Japan Meteorological Agency (JMA) has issued the earthquake within one minute, we assumed the event mode started from March 11, 2011 14:47 (Hoshiba, Iwakiri, Hayashimoto, Shimoyama, Hirano, Yamada, Ishigaki, and Kikuta, 2011). The event mode ended on March 11, 2011 18:12, at which time when the water level met the threshold and the tsunami has well passed the Ulluengdo tide station (Bae, Cho, Kwon, and Yoon, 2012). As shown in the yellow box, we should note that when the gap is
Fig. 5 shows the comparisons of water levels between the predicted data and the measured data for four cases. Fig. 5(a) shows the case where the time of the selected search window is very similar to the time of the target window. Even though the predicted data slightly overestimated the water level, the statistical parameters of 1.46cm for the rmse, 1.28cm for the mae, and 0.96 for the r confirm a good prediction. Fig. 5(b) shows the case where the water levels of the target data and the search data are similar but the rest of the water levels of the search window data differ from the measured data. However, after
862
Fig. 5. Comparison of water levels between the predicted data and the measured data of 4 cases. The left panel shows the time series with the start time of both the target window and the search window. The right panel shows the scatter plot with the statistical parameters.
863
Fig. 6. Time series of Ulleungdo tide station. The gray line represents the original data, and the black line represents the filtered data. The blue line represents the predicted data using the gap-filling algorithm, and the red line represents the predicted data using DART algorithm. The upper time series are water level and the lower time series are the DART index, the absolute value of the difference between the observed data and the predicted data using DART algorithm. sea-level records analysis” Nat Hazards Earth Syst Sci, 11(5), 14991521. Elshorbagy, A, Simonovic, SP, and Panu, US (2002). “Estimation of missing streamflow data using principles of chaos theory”, J Hydrol, 255(1), 123-133. Hoshiba, M, Iwakiri, K, Hayashimoto, N, Shimoyama, T, Hirano, K, Yamada, Y, Ishigaki Y, and Kikuta, H (2011). “Outline of the 2011 off the Pacific coast of Tohoku Earthquake (Mw 9.0)-Earthquake Early Warning and observed seismic intensity”, Earth, planets space, 63(7), 547-551. Lee, HJ, Cho, YS, and Woo, SB, (2005). Quick tsunami forecasting based on database, Tsunamis, 231-240. Meinig, C, Stalin, SE, Nakamura, AI, and Milburn, HB (2005). “Realtime deep-ocean tsunami measuring, monitoring, and reporting system: The noaa dart ii description and disclosure”, NOAA Pacific Marine Environmental Laboratory (PMEL), Tech Rep, 1-15. Mofjeld, HO (1997). “Tsunami detection algorithm”
filled, the DART algorithm could be applied right after restarting the recording while when the gap is not filled, a time delay of about 3hr appears which makes the DART algorithm to stop for a while.
CONCLUSIONS A gap-filling algorithm based on the end-point fixing method was developed. The algorithm was applied to the Ulleungdo tide station located in Korea. Although lengthening the gap sizes increased the error, the overall prediction of the gap-filling algorithm was accurate.
ACKNOWLEDGMENTS This study was supported by the “Research for the Meteorological and Earthquake Observation Technology and its Application” project of the National Institute of Meteorological Research.
http://nctr.pmel.noaa.gov/tda_documentation.html.
REFERENCES
Nitsure, SP, Londhe, SN, and Khare, KC (2014). “Prediction of sea water levels using wind information and soft computing techniques”, Appli Ocean Res, 47, 344-351. Ustoorikar, K, and Deo, MC (2008). “Filling up gaps in wave data with genetic programming” Mar Struct, 21(2), 177-195.
Bae, JS, Cho, YJ, Kwon, SJ, and Yoon, SB (2012). “Numerical Analyses of 2011 East Japan Tsunami Propagation towards Korean Peninsula”, J Korean Soc Coastal Ocean Eng, 24(1), 66-76 (in Korean). Bressan, L, and Tinti, S (2011). “Structure and performance of a real-time algorithm to detect tsunami or tsunami-like alert conditions based on
864
Development of a Gap-Filling Algorithm Applicable to a Tsunami Warning System
Jun-Whan Lee and Sun-Cheon Park National Institute of Meteorological Research
iSOPE-2015 Kona Conference, Hawaii Big Island The 25th International Ocean and Polar Engineering Conference Kona, Big Island, Hawaii, USA, June 21−26, 2015: www.isope.org;
Contents
01 02 03 04 05
Introduction Gap-filling algorithm Validation Application Conclusion
1. Introduction Earthquake detection
• Predicting a tsunami that has occurred around the Korean Peninsula
Magnitude >3.5(inland) or >4.0(sea)
Tsunami Scenario DB System
Issue the earthquake
• Predicting a tsunami that has occurred far from the Korean Peninsula
Global Tsunami Prediction System
Predicted tsunami height (magnitude >7.0 ) 0.5m - 1.0m
>1.0m
Tsunami advisory
Tsunami warning
• Detecting a tsunami that has occurred around the Korean Peninsula
Tsunami detection
Tsunami Detection System (KTDA)
Yes
Tsunami watch
Tsunami alarm cancellation
No
-
Despike Gap-fill Detect Detide
1. Introduction DART tsunami detection algorithm
10 min
10 min
1 hour
10 min
1 hour
10 min
t
1 hour
IF DART INDEX(abs(measured-predicted wave height)) > THRESHOLD THEN
TSUNAMI DETECTED.
LIMITATION If some data are lost, the tsunami detection algorithm stops for a while even after restarting the recording. NO DATA
SOLUTION Filling the gap so that the tsunami detection algorithm could run right after restarting the recording.
2. Gap-filling algorithm SHORT GAP
LONG GAP Data Selection
Linear Interpolation
Gap-filling algorithm
End-Point Fixing
Gap Filling
If the missing data do not contain unusual events such as tsunami, it will follow the trend of the past water level movement.
2. Gap-filling algorithm Data Selection
End-point Fixing
Gap Filling
1. Define the target window from the resampled moving-averaged data. ···
··· target window
EP1
EP2
target data
2. Find the most similar search data with target data. msearch search window
search data
MIN
mae(1)
mae(2)
mae(3)
mae(4)
···
mae(mevent)
··· mae(msearch-2)
mae(msearch-1)
mae(msearch)
2. Gap-filling algorithm Data Selection
End-point Fixing
Gap Filling
3. Rebalance the data with EPFM. selected search window
target window
search data
SW data
EP1
EP2
End-point fixing method(EPFM)
HEP (t) is the water level after applying the EPFM Hori (t) is the water level before applying the EPFM a is h1-h2, b is h4-h3, c is t1, d is t2-t1
2. Gap-filling algorithm Data Selection
End-point Fixing
Gap Filling
4. Fill the gap with the end-point fixed data.
end-point fixed data
5. Interpolate the end-point fixed data to the initial sampling interval.
Linear interpolation ···
···
Computing time: about 10 sec to fill 1440 points [Intel i7(2.93GHz) 64bit + 8GB RAM]
3. Validation Ulleungdo tide station
Korea
Ulleungdo
Excerpt from KOOFS website
Excerpt from Google earth
Parameters
location : 37.491 N, 130.914 E
target data : gap+EP1+EP2
data interval : 1 min
msearch : 100∙target window
dataset : 2010/01/01 ~2011/12/31
event : 2011/03/11 14:46 ~ 18:12
3. Validation
target window
search window
rmse
mae
r
Aug. 21, 2011 20:50
Aug. 20, 2011 20:20
1.46cm
1.28cm
0.96
3. Validation
target window
search window
rmse
mae
r
Oct. 16, 2011 10:10
Jun. 26, 2011 17:10
3.55cm
2.99cm
0.93
3. Validation
target window
search window
rmse
mae
r
Dec. 14, 2011 22:50
Oct. 13, 2011 21:00
5.85cm
5.30cm
0.97
3. Validation
target window
search window
rmse
mae
r
Oct. 06, 2011 00:10
Jun. 20, 2011 07:10
1.23cm
0.98cm
0.99
3. Validation
4. Application 2011 East Japan Tsunami
gap start: 2011-03-09 15:23
gap end: 2011-03-10 08:59
Before gap-filling: Time delay appears which makes the DART algorithm to stop for a while. After gap-filling: DART algorithm could run immediately after restarting the recording.
5. Conclusion ●A gap-filling algorithm applicable to the tsunami warning system
was developed. - The algorithm was applied to the Ulleungdo tide station located in Korea. - Although lengthening the gap sizes increased the error, the overall prediction of the gap-filling algorithm was accurate.
Future plans ●Calibrate the parameters (window size, msearch) by testing the tide
stations data for a long period of time. ●Combine the gap-filling algorithm to KTDA (Korea Tsunami
Detection Algorithm) which is under development.
THANK YOU
[email protected]