WRAP states are identified by their Federal Information Processing Standards identification. Additional codes are assigned for Mexico, Canada, and non-WRAP states. Axes are in kilometers. ...... OTAGWIND.html). Kemball-Cook, S., Y. Jia, ...
JOURNAL OF GEOPHYSICAL RESEARCH, VOL. 114, D21206, doi:10.1029/2008JD010846, 2009
Development of a tagged species source apportionment algorithm to characterize three-dimensional transport and transformation of precursors and secondary pollutants Zion S. Wang,1 Chao-Jung Chien,1 and Gail S. Tonnesen1 Received 25 July 2008; revised 14 May 2009; accepted 23 July 2009; published 10 November 2009.
[1] We developed a new tagged species source apportionment (TSSA) algorithm for
tracking the direct mass contributions of selected emissions sources to the formation of particulates such as aerosol sulfate, nitrate, ammonium, elemental carbon, and secondary organic aerosols in the U.S. EPA Community Multiscale Air Quality Model (CMAQ). The focus of this paper is on sulfate, nitrate, and elemental carbon. The objective of the TSSA algorithm is to provide useful results in modeling studies for identifying important emissions categories and identifying possible emissions reduction strategies to attain particulate matter (PM) air quality goals. TSSA differs from model sensitivity approaches because it tracks direct mass contributions from specific emissions sources to the total PM concentration at selected receptor sites, while results from sensitivity approaches are affected by nonlinear chemistry that can change the concentration of sulfate, nitrate, and organic carbon secondary particulates. We evaluated the algorithm by comparing CMAQ/TSSA results with results from zero-out CMAQ sensitivity simulations. As expected, TSSA results were almost identical to the CMAQ sensitivity results for chemical species that do not undergo nonlinear chemical reactions. For chemical species with nonlinear chemical reaction, the TSSA results are expected to differ from model sensitivity results, but for small emissions changes the results are similar in the two approaches. We also compared CMAQ/TSSA to CAMx/PSAT. Because there are significant differences in the CMAQ and CAMx model predicted concentrations, the source attribution results differed for TSSA and PSAT; however, the rank order of emissions sources were similar for the two approaches at most receptor sites. Citation: Wang, Z. S., C.-J. Chien, and G. S. Tonnesen (2009), Development of a tagged species source apportionment algorithm to characterize three-dimensional transport and transformation of precursors and secondary pollutants, J. Geophys. Res., 114, D21206, doi:10.1029/2008JD010846.
1. Introduction [2] Transport of secondary pollutants and their precursors has been an issue of serious concern for over 20 years. The Regional Acid Deposition Model [Chang et al., 1987, 1990] was used to evaluate transport of pollutants both within the United States and between the United States and Canada. The Ozone Transport Assessment Group (OTAG) [Parker and Blodgett, 1999] was a multiyear study designed to evaluate the effects of the transport of ozone and its precursors on ozone nonattainment in the eastern United States. There is also continuing concern regarding the transport of pollutants and their precursors among air basins in southern California, from California to Nevada, and between Mexico and the United States. More recently, there has been increased concern regarding transport of fine particulate matter (PM) both for health effects and for its contribution to regional 1 Center for Environmental Research and Technology, Bourns College of Engineering, University of California, Riverside, California, USA.
Copyright 2009 by the American Geophysical Union. 0148-0227/09/2008JD010846
haze. Despite the great interest and considerable past efforts devoted to the transport problem, there is still no definitive method for quantifying the importance of precursors and pollutants that are transported between air basins or across political borders. [3] Previous approaches to evaluating transport have included statistical analyses, data analysis methods, back trajectory modeling, and sensitivity studies using chemical transport models (CTM). While each of these approaches has value, they also have important limitations. Statistical correlation analyses of the regional ozone pattern [Guinnup and Collum, 1997; Schichtel et al., 1998; Husar and Renard, 1997] do not adequately distinguish the effects of transport versus meteorological correlation. For example, Husar and Renard [1997] concluded that their analysis was ‘‘too tentative to warrant conclusions at this time.’’ Data analysis methods, such as chemical mass balance (CMB) and positive matrix factorization (PMF), are limited by the availability of ambient monitoring data and can only be used to evaluate historical episodes. Back trajectory analyses cannot adequately treat the complex chemistry of secondary PM formation.
D21206
1 of 17
WANG ET AL.: DEVELOPMENT OF CMAQ TSSA FOR POLLUTANTS
D21206
[4] CTM sensitivity methods such as the brute-force method, the decoupled direct method (DDM) [Dunker, 1981; Yang et al., 1997], and the adjoint method [Dunker, 1984; Hakami et al., 2006] evaluate the sensitivity of ambient pollutant concentrations to changes in precursor emissions. The brute-force method (or zero-out method) requires the CTM to be run once for the base case and again for a number of sensitivity scenarios. This approach is computationally expensive when applied to evaluate many individual sources and, because of nonlinearity in chemical transformations, results of sensitivity studies will vary depending on both the magnitude of the emissions change used in the sensitivity simulation and on the chemical and meteorology conditions in the base case model scenario. The decoupled direct method (DDM) is an efficient and accurate way of performing sensitivity analysis to model inputs [Napelenok et al., 2006, 2008; Koo et al., 2007]. DDM predicts the pollutant response to emissions controls for a large number of emissions source categories and source regions and is useful in developing emissions reductions scenarios for attaining air quality goals. However, like other sensitivity methods, DDM results can be affected by nonlinear chemical reactions, and the results may not be accurate for large emissions changes [Dunker et al., 2002]. [5] Our objective in this work was to develop and test a new tagged species source apportionment (TSSA) algorithm in the Models-3 Community Multiscale Air Quality (CMAQ) model using reactive tracers to quantify the chemical transformation and transport of emissions from selected emissions source categories or regions. The motivation for this approach is the desire to determine emissions sources responsible for producing the mass of pollutants at various receptor sites in the model domain. The results from this approach differ from sensitivity methods because TSSA does not predict how pollutant concentrations change when precursor emissions are changed. Instead, TSSA can be used to estimate the rank order of emissions sources and source regions that contribute to the model simulated pollutant concentration. While sensitivity methods are useful for developing emissions control scenarios for attaining air quality goals, the TSSA results are expected to be useful in cases where nonlinearity in chemical reactions cause the sensitivity results to under or over estimate the mass contribution from individual emissions sources. [6] Several other mass tracking source apportionment methods have been developed in recent years. The CMAQ TSSA approach is very similar to the particulate matter source apportionment algorithm developed in the PMCAMx model [Wagstrom et al., 2008; ENVIRON International Corporation, 2008]. Another related method is the sourceoriented external mixture (SOEM) method described by Ying and Kleeman [2006]. Although SOME is the most
D21206
increasing number of stiff, coupled differential equation for each time step in the gas and aerosol chemistry modules as well as an increase in the number of species in the aerosol calculation [Wagstrom et al., 2008]. Bhave et al. [2007] implemented carbon tracking into the Models-3 Community Multiscale Air Quality (CMAQ) model [U.S. Environmental Protection Agency (U.S. EPA), 1999; Novak et al., 1998] to track primary organic and elemental carbon contributions from 15 source categories. However, this approach does not address a number of other gases and aerosol species in CMAQ. [7] The TSSA algorithm includes approximately 20 new tracers or ‘‘tagged species’’ for each emissions source to be evaluated. The TSSA has been implemented for CMAQ particulates including aerosol sulfate (ASO4), aerosol nitrate (ANO3), ammonium (ANH4), elemental carbon (AEC), secondary organic species (AORGA, AORGPA, AORGB), and other aerosol species (ASOIL, A25, etc.). The results of the tagged species source apportionment (TSSA) algorithm are three-dimensional concentration fields showing the transport of mass of both primary emissions and secondary products from the selected emissions sources. A single CTM simulation includes sufficient tagged species tracers to evaluate the contributions of as many different emissions sources as the underlying hardware (computer memory) will allow. The algorithm is designed to track the emissions either of a single source or of selected classes of sources, grouped either by source category and/or by geographical region. Contrary to a zero-out run (or a sensitivity simulation) where the model simulation can be affected by nonlinearity in chemical reactions so they are not definitive in characterizing source contributions, the TSSA approach tracks mass contributions to PM formation and identifies source contributions in a way that accounts for chemical nonlinearity. By using TSSA to identify the extent to which mass from particular emissions sources contribute to particulate concentrations at downwind receptor sites, traditional control simulations can be designed to reduce the high computation costs of performing runs that may have little policy benefits. Visualization tools were developed to show results of the source apportionment algorithm as the contribution of each source categories to speciated PM mass at selected receptor locations, and as three-dimensional animations of transport from the selected emissions sources.
2. Methodology [8] CMAQ version 4.5 was used as the platform to develop an algorithm that provides a detailed accounting of the transport and fate of precursors and secondary pollutants. The algorithm uses a full set of tagged-species analogs to a key set of model species for each precursor source region to be represented. The TSSA algorithm can be described as follows:
BulkCi ðt þ Dt Þ ¼ BulkCi ðt Þ þ BulkFi ðtransport; diffusion; depo; emis; chemistry; cloud; aerosolÞ source source regions groups
¼
XX�
� TracerCj;k ðtÞ þ TracerFj;k ðtransport; diffusion; depo; emis; chemistry; cloud; aerosolÞ :
j¼1 k¼1
accurate approach for tracking source contributions, this method is computationally demanding as it solves an
[9] The CMAQ model simulated species concentration for species ‘‘i’’ (also referred to as the ‘‘BulkCi’’) in each grid cell at time step ‘‘t + Dt’’ is equal to the ‘‘BulkCi’’
2 of 17
D21206
WANG ET AL.: DEVELOPMENT OF CMAQ TSSA FOR POLLUTANTS
D21206
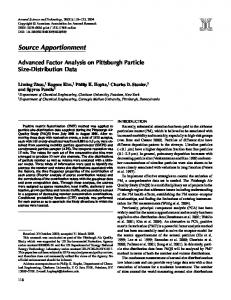
Figure 1. Source area mapping file: the purpose of this file is to predefine source regions in the modeling domain for TSSA. In this example, each source region (state) is distinguished by a unique number. WRAP states are identified by their Federal Information Processing Standards identification. Additional codes are assigned for Mexico, Canada, and non-WRAP states. Axes are in kilometers. concentration at time step ‘‘t’’ plus the change of concentration (BulkFi) during a time step (‘‘Dt’’) through horizontal and vertical transport and diffusion, dry and wet deposition, emissions, chemistry, cloud, and aerosol processes. A new vector is added to represent the contribution of the tagged sources to the bulk concentration within that grid cell. Therefore, the sum of TSSA tracer concentration (TracerCj,k) from ‘‘j’’ source regions and ‘‘k’’ source groups plus the change in TSSA tracer concentration (TracerFj,k) through transport, diffusion, dry and wet deposition, emissions, chemistry, cloud, and aerosol processes is equal to the CMAQ (bulk) species concentration for species ‘‘i.’’ [10] Transport of the tagged species is solved using CMAQ model’s advection and dispersion solvers. The chemical transformation of the tagged species is updated using integrated reaction rates calculated using the process analysis code in the chemical solver. The effects of chemistry, transport and deposition on the tagged-species analogs are assumed to be proportional the effects of these processes on the ‘‘bulk’’ concentration of a model species (i.e., the model simulated concentration within a given grid cell at each model time step). Thus, the TSSA algorithm achieves computational efficiency by applying the bulk species transformations to update the tagged species, thereby avoiding solving the chemistry individually for each tagged species. Initial testing by comparison to ‘‘brute force’’
sensitivity simulations showed that the TSSA algorithm gave generally similar results to the sensitivity results; however, there were significant differences that can be attributed to the effects of nonlinear chemical transformations and numerical noise in the sensitivity simulations. The approach used in the development and important proposed improvements are described next. 2.1. TSSA Tracer Setup [11] Tracer species are used to represent key model species and for predefined source categories and regions in the modeling domain. A user interface is provided to easily select certain preconfigured combinations of emissions source categories and source regions. Figure 1 illustrates the source regions treated in the current version of the code, and Table 1 lists an example of the possible combinations of source categories (including emissions sources and initial/boundary inputs) that can be treated. The tracers are updated at each time step for the entire model simulation period and are output at the same hourly interval as regular CMAQ output files. The tracer output files provide threedimensional fields showing transport and transformation of secondary species. 2.1.1. Definition of Source Region [12] In setting up the predefined region to perform TSSA, a unique numerical code is assigned to each grid cell to
3 of 17
WANG ET AL.: DEVELOPMENT OF CMAQ TSSA FOR POLLUTANTS
D21206
Table 1. An Example of the Emissions Categories That Can Be Tracked in TSSA Source Categoriesa
Description
ICON BCON
ICON BCON
Emissions
MV_
Contributions from the initial condition Contributions from the boundary condition On-road and off-road mobile source from each state Biogenic sources from each state Road dust from each state Non-road dust from each state Point sources without SO2 from each state Point sources with SO2 from each state Area sources from each state Wild fire from each state Agricultural fire from each state Rx burning from each state Mexico emissions Canada emissions Total emissions of any state Offshore emissions Any sources other than all the above
Types
BD_ RD_ NR_ PN_
Others
PS_ AR_ WF_ AG_ RX_ MX_ CA_ ET_ OF_ others
a Underscoring represents a wildcard, where it can be replaced by state names to form combinations of emissions source category and geographic region.
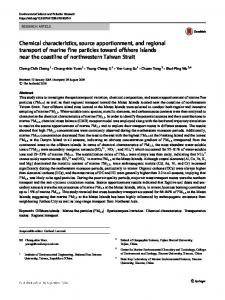
identify the source regions. The source region can range from a single grid cell to a large group of grid cells for a state or larger region. Figure 1 illustrates how source regions are defined for the modeling test cases used in this study. In Figure 1, states within the Western Region Air Partnership (WRAP) are identified by their FIPS ID and regions of Canada, Mexico, the eastern United States and oceans are identified with unique IDs. The source regions are also tabulated in Table 2. 2.1.2. Definition of Source Categories [13] The source categories, also called source groups, include initial and boundary conditions, individual types of emissions sources such as motor vehicles, point sources, area sources, fires, etc., and ‘‘other’’ sources which include everything other than all of the above explicit sources. The emissions files are processed separately to account for each source category. Table 1 illustrates the types of sources that can be used in CMAQ TSSA simulations. [14] By combining the source region and source categories, it is possible to assess pollutant exposure at a particular receptor site from individual emissions source categories in a specific region. 2.2. TSSA Science [15] The CMAQ Chemical Transport Model (CCTM) is a three-dimensional regional-scale nonhydrostatic air quality model based on the mass conservation equation to simulate transport, transformation, dry and wet deposition, and aerosol formation of pollutants. The governing equation can be rewritten in the generalized coordinates where the turbulent flux terms are expressed with the eddy diffusion theory [U.S. EPA, 1999]. Through operator splitting, or fractional time step, modularity is achieved in CCTM and computationally efficient algorithms were applied to solve each science process (e.g., advection, chemistry). The TSSA algorithm is implemented into each science process to account for the change in species concentration and update
D21206
the tagged species accordingly. Figure 2 is the schematic diagram of the TSSA implementation in CCTM science processors. The TSSA routine checks for mass conservation at each advection time step and adjusts the mass (renormalize), if needed, to prevent growth of numerical noise. The program will halt if large errors (currently defined as >0.01%) are detected during the mass conservation check. [16] The TSSA initialization stage takes place at the beginning of the model simulation. All tracers are initially set to zero, except for the tracers for initial concentrations which are set equal to the model initial concentrations (IC) for each species. Thus, the TSSA algorithm requires a spinup period of several days during which the IC tracers approach zero, and mass accumulates in the remaining tracers. The TSSA algorithm includes tracers for contribution from boundary conditions that are updated when there is mass influx to the model domain. Outflux at the boundaries is treated as simple removal process that applies proportionally to all tracers. 2.2.1. Emissions [17] Emissions are treated as a simple source that increments the bulk species concentration and the emissions tracer for each source category. Typically, tracers are not used to treat all emissions source categories. The computational costs are significantly reduced by excluding minor source categories that have small contributions to total emissions, however, all source categories that are not selected for the TSSA are added to a tagged species identified as ‘‘other.’’ This approach allows for all emissions to be included in the TSSA algorithm so that the total mass of the sum of the tagged species (including ‘‘other’’) equals the total concentration of the bulk species for each individual grid cell. The TSSA routine updates the tagged-species concentration at each model time step with the release of emissions. The tagged-species NOX is incremented by emissions of all reactive N species, i.e., NO, NO2 and HONO emissions. 2.2.2. Advection, Diffusion, and Deposition [18] In the CMAQ CTM, operator splitting is used to divide the advection and diffusion in the horizontal and vertical directions. Deposition is coupled with vertical diffusion in the CMAQ CTM. The TSSA algorithm follows
Table 2. CMAQ-TSSA Source Regions Used in the Evaluation Simulations State Names
Source Code
State Federal Information Processing Standards
California Nevada Oregon Washington Idaho Utah Arizona New Mexico Colorado Wyoming Montana North Dakota South Dakota Mexico Canada Non-WRAP states
CA NV OR WA ID UT AZ NM CO WY MT ND SD MX CN EA
6 32 41 53 16 49 4 35 8 56 30 38 46 92 91 66
4 of 17
D21206
WANG ET AL.: DEVELOPMENT OF CMAQ TSSA FOR POLLUTANTS
D21206
Figure 2. Flowchart of the TSSA implementation in CCTM. the standard CMAQ algorithm to update the tracer species. We have implemented TSSA to both ppm [Colella and Woodward, 1984] and Yamartino (yamo) advection solvers. For dry deposition, TSSA tracers use the same deposition velocities as their CCTM counterparts. 2.2.3. Cloud and Wet Deposition [19 ] The cloud routines in CMAQ computes cloud quantities, gets in-cloud pollutant concentrations, performs gas and aerosol scavenging and wet deposition, and aqueous chemistry if the liquid water content exceeds a predetermined threshold. The current version of CMAQ/ TSSA updates the TSSA tracer species proportional to the change in the CMAQ bulk species. The wet deposition is also updated according to the change in wet deposition of the CMAQ bulk species. 2.2.4. Chemistry [20] Treatment of dispersion and transport processes is relatively straightforward because it simply involves the redistribution of the tagged species analogously to that of the bulk species, with the tagged species concentration conserved at each step. Chemical transformations, by contrast, require that mass be transferred between tagged species. The integrated rates of chemical reactions are used to determine the mass transfer from one bulk species to another and to update the tracer species at each chemistry time step. In the simplest case for a species with chemical loss but no chemical production, we simply reduce the tagged species proportionally to the reduction in the bulk species. For example, given an initial bulk SO2 concentration of 100 ppb and a SO2 concentration of 10 ppb from Colorado point sources, the chemical loss of 5 ppb SO2 during a chemistry time step, the loss frequency of 5%, would apply proportionally to the bulk and tagged species so that their concentrations would be 95 ppb and 9.5 ppb, respectively, at the end of the time step.
[21] In the more complex case in which there is both chemical production and loss of species Cj, the rate of removal of the bulk species j and each tagged component i is calculated by solving a simple ordinary differential equation, dCj;i ¼ Pj;i � LCj ; dt
ð1Þ
where Pj,i represent chemical production of species j from each source i, and Lj is the loss frequency of Cj. The analytical solution for equation (1) during the time interval Dt = (tn+1 � tn) is tnþ1 Cj;i ¼
� Pj;i � tn �LDt 1 � e�LDt þ Cj;i e ; Lj
ð2Þ
where the first term on the right-hand side of equation (2) is the amount of new production of j remaining at tn+1, and the second term is the amount of Ctn remaining at tn+1. We can account for differing rates of production of the bulk and tagged components by substituting the individual tagged components of Cj into equation (2), Cj;bulk ¼ Cj;initial þ Cj;bondary þ Cj;S1 þ Cj;S2 þ . . . þ Cj;Sm ;
ð3Þ
where Cj,initial represents the amount of the initial distribution still remaining, Cj,bondary represents the amount transported in from boundaries, and Cj,S1 and Cj,Sm represent the amount remaining of chemical production prior to tn from sources S1 and Sm, respectively. In addition, there is some new chemical production during Dt,
5 of 17
Pj;Total ¼ Pj;S1 þ Pj;S2 þ . . . þ Pj;Sm :
ð4Þ
WANG ET AL.: DEVELOPMENT OF CMAQ TSSA FOR POLLUTANTS
D21206
[22] We can then write equation (2) for each tagged component to determine the amount remaining at tn+1,
tnþ1 ¼ Cj;boundary
tnþ1 tn �LDt Cj;initial ¼ Cj;initial ; *e
ð5Þ
� Pj;BC � tn �LDt 1 � e�LDt þ Cj;boundary ; *e Lj
ð6Þ
D21206
with the change being proportional to the change in the bulk species concentration. The methodology applies to all CMAQ particulate species including ASO 4 , ANO 3 , ANH4, AEC, AORGA, AORGB, etc. However, the current TSSA algorithm does not account for the reverse process for secondary organic aerosol (SOA). We plan to revamp TSSA SOA and nitrate algorithms for CMAQ 4.7 and CB05.
3. TSSA Modeling Simulations tnþ1 Cj;S ¼ 1
� Pj;S1 � tn 1 � e�LDt þ Cj;S e�LDt ; 1 * Lj
ð7Þ
tnþ1 Cj;S ¼ m
� Pj;Sm � tn 1 � e�LDt þ Cj;S e�LDt : m * Lj
ð8Þ
By solving equations (5) through (8) for each tagged species at each time step, it is possible to track the temporal evolution of the contribution to a species concentration due to initial mass, transport from boundaries, and chemical formation. The production and loss terms needed to solve these equations can be obtained by integrating the rates of chemical reactions. Therefore, TSSA was implemented for the SMVGEAR and QSSA chemistry solvers where the integrated reaction rates could be obtained. The TSSA numerical method is also consistent with the CMAQ chemistry solver used. [23] To reduce the number of tracers used for chemical transformations of N species, we use a single tracer (big NOX) to represent NOx (the sum of NO and NO2) and other reactive odd nitrogen species, NOX ¼ NOx þ NO3 þ 2*N2 O5 þ HONO þ PAN;
while separate tracers are used for the more slowly reactive species HNO3, RNO3, ANO3I (aerosol nitrate in the Aitken mode), and ANO3J (aerosol nitrate in the accumulation model). The family group of NOX was previously used by Crutzen [1983] to represent the family of all rapidly reactive N species. This approach reduces the number of tracers required for oxidized N species from 10 to 6 and also reduces computational costs and potential numerical error that would be encountered while updating those NOX species that have very low concentrations and rapid reaction rates. 2.2.5. Aerosol Chemistry [24] The CMAQ CCTM treats aerosols using a modal approach where primary particles are divided into 2 fine modes and 1 coarse mode, where each mode is represented by a lognormal size distribution. The key processes for aerosol formation and removal include nucleation, secondary organic aerosol formation, particle coagulation and condensation growth, aerosol-cloud droplet interaction, and removal by dry deposition and precipitation. The TSSA algorithm applies the equilibrium approach where the aerosol species are updated. At each time step, assume that PM and gas species are in equilibrium and the total mass of each tagged species contribution is calculated. TSSA algorithm then calculates the tagged-species values for the sum of gas and PM species. Finally, the tagged species are also updated
[25] The Western Regional Air Partnership (WRAP) modeling domain, shown in Figure 1, [Tonnesen et al., 2006] was used in this study. The modeling domain consists of 36 km grid cells covering the contiguous 48 U.S. states, contiguous lands and waters of southern Canada and northern Mexico, portions of the Pacific and Atlantic Ocean, most of Gulf of Mexico, all of the gulf of California, and the southern Hudson Bay region. The Regional Planning Organization (RPO) unified domain grid projection used is defined on a Lambert conformal projection, with true latitudes at 33°N and 45°N, and the central latitude and longitude at 40°N and 97°W, respectively. The CMAQ TSSA 36-km grid includes 148 cells in the east – west dimension, 112 cells in the north – south dimension, and 19 layers in the vertical dimensions. [26] The primary modeling tools used to create the input files include the Fifth-Generation Pennsylvania State University/National Center for Atmospheric Research (PSU/NCAR) Mesoscale Model (MM5) meteorological modeling system [Grell et al., 1994], the Sparse Matrix Operator Kernel Emissions (SMOKE) emissions modeling system [Houyoux et al., 2000], and the CMAQ air quality modeling system. [27] The 2002 emissions data for the United States, Mexico, and Canada was used as a starting point to create a base 2002 annual emissions database for use in the CMAQ TSSA simulations. Sources for emissions inventory and ancillary modeling data included WRAP emissions inventory contractors, other Regional Planning Organizations (RPOs), and U.S. EPA. Building from the WRAP preliminary 2002 modeling cases completed earlier [Tonnesen et al., 2006], we integrated several updates to the inventories and ancillary data to create final 2002 emissions input files; this simulation is referred to as 2002 base case version A (Base02a) in WRAP nomenclature. The SMOKE version 2.1 [Carolina Environmental Program, 2004] was used to prepare the inventories for input to the air quality modeling systems. [28] The meteorological data used in this study came from the WRAP 2002 MM5 modeling study to support visibility modeling for western United States [KemballCook et al., 2005]. The MM5 36-km grid has 164 cells in the east – west dimension 128 cells in the north – south dimension, and 34 layers in the vertical. To eliminate any errors in the meteorology from these boundary effects, we chose the MM5 domain to be larger than the CMAQ 36-km air quality domain. Since CMAQ cannot use MM5 outputs directly, we used the Meteorological-Chemistry Interface Process (MCIP) (version 2.3) to process the MM5 outputs files into formats consistent with the requirements of CMAQ air quality model. In the MCIP processing, we
6 of 17
D21206
WANG ET AL.: DEVELOPMENT OF CMAQ TSSA FOR POLLUTANTS
selected the pass-through options for PBL and radiation fields, and the Wesely deposition scheme. [29] Initial conditions (ICs) are specified by the user for the first day of a model simulation. For continental-scale modeling using the RPO Unified 36-km domain, the ICs can affect model results for as many as 15 days, although the effect typically becomes very small after about 7 days. We included a 15-day model spin-up period in the TSSA simulations to eliminate any effects from the ICs. The boundary conditions (BCs) for CMAQ-TSSA were extracted from an annual simulation of the global-scale GEOS-Chem model for calendar year 2002. The photolysis rates were generated by the CMAQ JPROC preprocessor. We also used day-specific Total Ozone Mapping Spectrometer (TOMS, http://toms.gsfc.nasa.gov/) ozone profiles to calculate the photolysis rates.
4. Results and Discussions [30] After implementing the TSSA code into CMAQ version 4.5, we performed a number of model simulations to evaluate the TSSA algorithms. In this paper, we present results from a base case run and five CMAQ/TSSA sensitivity simulations that are summarized in Table 1 and discussed below. The base case simulation provides the benchmark for comparisons with the CMAQ/TSSA sensitivity cases. The five CMAQ/TSSA sensitivity runs tracers are compared to equivalent results from zero-out simulations to assess the accuracy of the source apportionment (TSSA) methodology. [31] In these runs, identical meteorology and ancillary (initial, boundary, and photolysis rates) input files [Tonnesen et al., 2006] were used for the months of January and July 2002. The emissions inputs used in the base case run includes area sources, point sources, on-road and off-road mobile sources, biogenic emissions; road dust; offshore emissions; and fire emissions [Tonnesen et al., 2006]. Five source categories were used in evaluating the TSSA algorithm. These sources included the following: initial conditions, boundary conditions, mobile source emissions, point sources, and all other emissions sources. The source regions for each of the evaluation runs are shown in Figure 1. Thirteen states in the western United States were tagged as a separate source regions. In addition, the central U.S. states, the eastern U.S. states, Canada, Mexico and oceans were each tagged as separate source regions, for a total of 17 source regions. 4.1. TSSA Simulations [32] The purpose of these two QA tests is to verify the addition of the TSSA code did not inadvertently alter the original EPA CMAQ standard release to create superfluous results. In implementing the TSSA code into CMAQ v.4.5, we imbedded a true/false flag to allow the source apportionment tracking to be either turned on or off. We first performed a CMAQ/TSSA run with the flag set to ‘‘false’’ and verified that the instantaneous (CONC) and average concentrations (ACONC) are identical to the standard EPA CMAQ release. After having full confidence that the CMAQ/TSSA code did not inadvertently alter the outputs, we set the CMAQ/TSSA flag to ‘‘true’’ and ran the model with same input files as the base case. We then plotted out
D21206
the differences of the instantaneous and average concentrations from the two simulations (CMAQ/TSSA – Base Case) for aerosol sulfate (ASO4J) and aerosol nitrate (ANO3J), ozone (O3), and CO (plots not shown). The differences between the two runs are zero for all four species suggesting that the implementation of TSSA code did not alter the original code. 4.2. Zero-Out Sensitivity Runs [33] We proceed to perform CMAQ/TSSA simulations where the base case emissions are divided into three emissions source categories. We also performed three CMAQ zero-out runs by removing each the three emissions source groups. The CMAQ/TSSA results for source apportionment are compared to the results of equivalent zero-out CMAQ simulations. [34] The Package for Analysis and Visualization of Environmental data (PAVE) software was used for spatial analysis of the simulation results. We produced PAVE spatial plots of the difference of the base case and the zero-out sensitivity run. We purposely plot ‘‘base case’’ minus ‘‘sensitivity case’’ to show positive difference, and we use identical scales for used for both TSSA tracers and the difference plots. This allows the spatial plots from CMAQ/TSSA to be compared directly to spatial plots from the differences in the zero-out sensitivity results. [35] First, we visualize the model simulated tracers to show the spatial evolution of each tracer over time. When viewed as animations these results appear as plumes of tracers emanating from each source group region. An animation is produced for each emissions source group and for each tracer species that is represented in the CMAQ/TSSA simulations. Animations or static plots of each tracer were compared with results from model sensitivity simulations in which we removed the same emissions source groups. [36] In addition to the spatial plots, for aerosol sulfate, nitrate, and elemental carbon, we performed hour-by-hour cell-to-cell comparisons for the entire modeling domain for the simulation period of 15 June to 31 July 2002. The statistics that are generated include r2 (coefficient of determination), the normalized mean bias (NMB), and the normalized mean error (NME). We also generated scatterplots for the hour-by-hour cell-to-cell comparisons. The cells selected for the comparisons are where IMPROVE sites are located to provide a nice ‘‘random’’ spatial distribution to evaluate how well the TSSA algorithm performs against the zero-out run over the entire model domain. A total of 197,400 data points were used in the comparison. 4.2.1. Zero-Out Comparison of Nonreactive Species: Elemental Carbon [37] For chemical species for which there are no chemical reactions (such as elemental carbon) we would expect the TSSA results and the zero-out sensitivity results to be identical or to have only very small differences arising from errors in the numerical algorithms. Large differences in the results would indicate an error either in the TSSA algorithm or in mass conservation in the model. Sensitivity simulations for nonreactive elemental carbon were used as a reference test, since the TSSA and sensitivity methods should provide identical results for nonreactive species.
7 of 17
D21206
WANG ET AL.: DEVELOPMENT OF CMAQ TSSA FOR POLLUTANTS
D21206
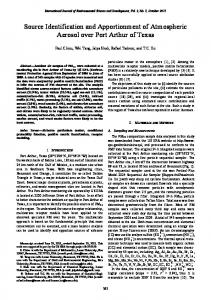
Figure 3. Comparison of elemental carbon (AEC) from CMAQ TSSA run with the California motor vehicle and point sources emissions zeroed out. (top) The TSSA tracer (AEC_CA) and (bottom) the difference (base_case minus zero-out run) plot for AEC. The plots are for 0000 GMT on 22 June 2002. [38] Figure 3 shows the comparison of the CMAQ/TSSA run with the CA motor vehicle (MV) and point sources (PT) zeroed out run. The sum of aerosol elemental carbon tracers (AEC_CA) from CA motor vehicle emissions (AEC_MV_CA) and CA point sources (AEC_PT_CA) for 0000 GMT on 22 June (7 days into the run) is shown at the top. The difference (base_case minus zero-out run) plot for elemental carbon zero out run is shown at the bottom. Comparisons of the spatial patterns for elemental carbon (Figure 3) show good agreement between the TSSA tracer runs and the CA motor vehicle emissions zero-out run. The percentage difference of maximum concentration (0.5009 versus 0.5006 mg/m3) between the two simulations after 7 days of continuous simulation is less than 0.06 percent. In addition to the spatial plots, a scatterplot and statistics were
generated for the CMAQ/TSSA run versus zero-out run for AEC (Figure 4) for a total of 47 days from 15 June to 31 July 2002 (Julian day 166 to day 212). The comparisons result in a total of more than one hundred thousand data points (197,400 points). As shown in the plot, the r2 value for the comparison is 0.96, the normalized mean bias (NMB) is 7.30, and the normalized mean error (NME) is 17.06. These statistics suggest very good agreement between the TSSA run and the zero-out run for elemental carbon over multiple (47) days. 4.2.2. Zero-Out Comparison of Reactive Species: Aerosol Sulfate and Nitrate [39] For chemical species that have nonlinear chemical reactions (e.g., nitrate and sulfate) we do not expect the CMAQ/TSSA results to be identical to zero-out sensitivity
8 of 17
D21206
WANG ET AL.: DEVELOPMENT OF CMAQ TSSA FOR POLLUTANTS
D21206
Figure 4. Scatterplot for aerosol elemental carbon hour-to-hour comparison for CMAQ/TSSA versus CMAQ California point source zero-out run at Interagency Monitoring of Protected Visual Environments locations throughout the United States. Statistics including r2, normalized mean bias, and normalized mean error are also shown. results, however, we do expect that there should be strong similarities in these two results. The similarities would be greatest for those species for which the chemistry has only small nonlinearity, such as sulfate. Differences between CMAQ/TSSA and zero-out sensitivity results would be largest for those species such as nitrate which are subject to large nonlinearity in the chemical reactions. The comparisons are intended to test whether the CMAQ TSSA results are identical to zero-out results for species without chemistry and if they are generally similar for species with nonlinear chemistry. Figure 5 shows the comparison of the CMAQ/TSSA run with the CA point source SOx zeroed out run for 29 June 2002, 0000 GMT. The aerosol sulfate tracers (ASO4_PT_CA) from CA point source emissions are shown at the top. The differences (base_case minus zero-out run) for aerosol sulfate are shown at the bottom. Although there are spatial similarities between the two plots, the differences are slightly more pronounced than the AEC comparisons. Similar to the AEC hour-by-hour cell-by-cell comparisons, we compared the CMAQ/TSSA aerosol sulfate from California point sources to the CMAQ zero-out results (plot not shown). The r2 value for the comparison is 0.84, the normalized mean bias (NMB) is �21.99, and the normalized mean error (NME) is 46.69. [40] The most complex CMAQ/TSSA chemistry algorithm is for nitrate. The concern regarding nonlinearity
primarily affects NOx, O3, and nitrate, with a smaller effect on organic aerosols and sulfate. Nonlinearity is not a concern for nonreactive or slowly reacting species. Figure 6 shows the comparison of the CMAQ TSSA run with the CA mobile source NOx zero-out run for 1 January 2002, 0000 GMT. The aerosol nitrate tracers (ANO3_MV_CA) from CA mobile source emissions are shown at the top. The differences (base_case minus zero-out run) for aerosol nitrate are shown at the bottom. Overall, the spatial patterns are similar in California and the western parts of United States. The r2, NMB, and NME values from CMAQ/TSSA versus CMAQ zero-out comparison for aerosol nitrate within the entire modeling domain are 0.96, �31.31, and 34.34, respectively. 4.2.3. Zero-Out Comparison of Boundary Conditions: Carbon Monoxide [41] Figure 7 compares the TSSA carbon monoxide tracer (CO_BCON) to the boundary condition (BC) zeroed out run for 0000 GMT on 17 June 2002 (3 days into the simulation). The percentage differences (results not shown) between the TSSA run and the zero-out run decreases as CO is transported into the model domain. The r2, NMB, and NME values from CMAQ/TSSA versus CMAQ CO boundary condition zero-out comparison for the entire modeling domain for the first 7 days (a total of 27,687 data points) are 0.94, 15.61, and 19.73, respectively. This suggests that
9 of 17
D21206
WANG ET AL.: DEVELOPMENT OF CMAQ TSSA FOR POLLUTANTS
D21206
Figure 5. Comparison of the CMAQ TSSA run with the CA point source SOx zeroed out run. (top) The aerosol sulfate tracers (ASO4_PT_CA) from CA point source emissions. (bottom) The differences (base_case minus zero-out run) for aerosol sulfate. The plots are for 0000 GMT on 29 June 2002.
TSSA is capable of performing source apportionment from boundary conditions. 4.3. CMAQ TSSA Receptor Bar Plots [42] Besides the spatial plots shown above, a second approach for visualizing CMAQ/TSSA results is the use of a receptor bar plot that shows the ranked contributions of each emissions source group that contributes to each component of PM at a given receptor site. This display is more directly relevant to determining source apportionment at a receptor site. We have postprocessing software that reads the CMAQ/TSSA output files, extracts data for a list of receptor sites, and creates bar plots and ASCII files showing the ranked largest emissions source group contributors to
the individual components of PM (e.g., SO4 and NO3) at each receptor site. [43] Because of the interest in source apportionment for regional haze, we evaluate the results by using receptor sites defined by model grid cells containing IMPROVE sites at Class I areas. The source apportionments were calculated as the apportionment averaged over a 24-h period (to match the temporal resolution specified in the IMPROVE monitoring protocol). To create the receptor bar plots, we used postprocessing software that sorts and identifies for each receptor site the average source apportionment for individual days as well as the 20% best (B20%) and 20% worst (W20%) visibility days, where ‘‘worst’’ and ‘‘best’’ can be defined using either ambient IMPROVE data or model predictions.
10 of 17
D21206
WANG ET AL.: DEVELOPMENT OF CMAQ TSSA FOR POLLUTANTS
D21206
Figure 6. Comparison of the CMAQ TSSA run with the CA mobile source NOx zeroed out run. (top) The aerosol nitrate tracers (ANO3_MV_CA) from CA mobile source emissions. (bottom) The differences (base_case minus zero-out run) for aerosol nitrate. The plots are for 0000 GMT on 7 January 2002. [44] Figure 8 shows a source apportionment receptor bar plot for aerosol sulfate (ASO4) at a receptor site (Hance Camp at Grand Canyon NP, Arizona) for a monthly average (July 2002). The top five contributors are now point sources from Nevada, point sources from Pacific offshore and Sea of Cortez, boundary conditions, point sources from Arizona, and motor vehicle emissions from Arizona. Bar plots for different receptor sites could also be generated to show the annual 20% best and worst daily average values for beta extinction coefficient. 4.4. CMAQ TSSA Receptor Allotment Plots [45] A third approach to visualize the CMAQ/TSSA source apportionment contributions is the receptor allotment
plots in which we combine several types of plots together to show source apportionment for a particular receptor site. [46] In a CMAQ/TSSA receptor allotment plot, the map projection used is identical to the CMAQ/TSSA simulation domain. The yellow-colored diamond identifies the location of the receptor. The ‘‘hatch map’’ (background map in gray scale) represents the total contribution (mg/m3) from each state to the receptor site. The darker gray indicates more contribution to the receptor site while the lighter gray suggests less contribution. We overlay a pie chart for each state over the hatch map. The pie chart represents the percentage contribution from the source categories within each state. The pie charts are also scaled in proportion to the data values represented for each state. Finally, for complete-
11 of 17
D21206
WANG ET AL.: DEVELOPMENT OF CMAQ TSSA FOR POLLUTANTS
D21206
Figure 7. Comparison of the CMAQ TSSA run with the boundary condition CO zeroed out run. (top) The CO tracers (CO_BCON) from boundary conditions. (bottom) The differences (base_case minus zeroout run) for CO. The plots are for 0000 GMT on 17 June 2002. ness, we tabulate at the top of the receptor allotment plot total contributions from the source categories not shown in the pie chart (example: ‘‘Eastern US,’’ ‘‘Mexico,’’ ‘‘Canada,’’ ‘‘BCON,’’ ‘‘ICON,’’ and ‘‘not tagged’’). [47] Figure 9 shows an example CMAQ/TSSA receptor allotment plot for the IMPROVE GRCA2 (Hance Camp at Grand Canyon NP, AZ) site on 15 January 2002. The gray scales show the top three contributing states are, in descending order, Arizona Nevada and New Mexico. The pie chart in each state shows the percentage (relative) contribution of the three emissions sources categories (pt: point source; mv: motor vehicle; fw: all other sources). The point and mobile emissions sources are the top two contributors in Arizona. For the majority of the WRAP states, the point source emissions are the main contributor in each state. As for the
remaining source categories not plotted in the pie charts, the contributions from eastern United States, Mexico, boundary conditions, and sources not tagged are 0.02, 0.14, 0.06, and 0.05 mg/m3, respectively. 4.5. CMAQ TSSA Benchmarks [48] The TSSA algorithm was carefully implemented into the CMAQ model to utilized the message passing interface (MPI). Therefore, the model is capable of running in parallel mode on inexpensive Linux cluster with Gigabit network and network storage. The performance of the TSSA in terms of efficiency (runtime required) will depend on the source definition, a combination of source categories and source regions, as well as the number of TSSA tracers used. Table 3 tabulates results from two benchmark runs.
12 of 17
D21206
WANG ET AL.: DEVELOPMENT OF CMAQ TSSA FOR POLLUTANTS
D21206
Figure 8. TSSA receptor bar plots for aerosol sulfate for Hance Camp at Grand Canyon National Park, Arizona, for the month of July 2002. For the first benchmark run, a total of six AMD Opteron CPUs were used to tracks three TSSA tracers with six source categories/regions. The runtime for one model day is approximately 2 h 48 min on a Linux cluster with Gigabit network. A CMAQ base case run (no TSSA) using same CPUs and network setup, identical CMAQ science configuration and inputs files took approximately 2 h 31 min to complete. The difference in runtime is about 9%. Total disk usage for the TSSA run is �0.54 Gb while the run with no TSSA is �0.40 Gb. [49] For the second benchmark run, with the exception of using eight CPUs, the domain configuration, model science, input files, and network setup is identical to the first benchmark case. For the TSSA run, a total of eight TSSA tracers and 50 source categories/regions requires 8 h 35 min to complete one model day. In contrast, the no TSSA run took only 1 h 53 min. Although the TSSA runtime was more than 4.5 times than the no-TSSA run, we believe the information that was available (such as in Figures 7 and 8) was well worth the increase in runtime. Overall, it is an efficient method to provide source receptor relationship for regulators to understand and identify key control strategy runs to perform. 4.6. CMAQ/TSSA Versus CAMx/PSAT [50] We also compared the CMAQ/TSSA to CAMx with its source apportionment method, PSAT, for the months of January and July 2002. Similar to CMAQ/TSSA, CAMx/
PSAT uses reactive tracers to track the chemical transport and transformation of emissions from selected emissions source categories or regions. The algorithm includes a number of new tracers, or ‘‘tagged species,’’ for each emissions source to be evaluated. The result of both source apportionment methods are 3-D concentration fields showing the transport of mass of both primary emissions and secondary products from the selected emissions sources. [51] We performed the CMAQ/TSSA versus CAMx/ PSAT model simulations with identical MM5 meteorology and emissions data sets so that we could more accurately evaluate the consistency of modeling results between the two models. We also used identical source regions and emissions groups for both simulations. A model spin-up period was used in both the TSSA and PSAT simulations to eliminate any effects from the ICs. The BCs data, similar to CAMx/PSAT boundary conditions, were generated from the global-scale GEOS-Chem model and were postprocessed to be used in CMAQ modeling [Moon and Byun, 2004]. The photolysis rates were generated by the CMAQ JPROC preprocessor. We also used day-specific TOMS ozone profiles to calculate the photolysis rates. We also used consistent science algorithms in both models, for example, we used the piecewise parabolic method (PPM) to treat horizontal advection in both CMAQ and CAMx. [52] CMAQ/TSSA and CAMx/PSAT source apportionment spatial plots for aerosol sulfate and nitrate from California and Colorado mobile sources and point sources
13 of 17
WANG ET AL.: DEVELOPMENT OF CMAQ TSSA FOR POLLUTANTS
D21206
D21206
Figure 9. CMAQ/TSSA receptor allotment plot for the IMPROVE GRCA2 (Hance Camp at Grand Canyon NP, Arizona) site on 15 January 2002. The gray scale shows the total contributions (in mg/m3) from each state to the receptor site. The pie chart in each state shows the percentage (relative) contribution of the three emissions sources categories (pt, point source; mv, motor vehicle; fw, all other sources) from each state. The size of each pie chart is also indicative of the total contribution from each state. for 1 to 15 January 2002 exhibit similar spatial patterns. The maximum values for each tagged species frequently occurs at same grid cell for both models but with somewhat different concentrations. [53] Figure 10 compares CMAQ/TSSA and CAMx/PSAT receptor bar plots for Hance Camp at Grand Canyon National Park, Arizona, for the month of July 2002. The top five contributors to aerosol sulfate from the CMAQ/ TSSA run (top plot) are point sources from Nevada and Pacific offshore, boundary conditions, and point and mobile sources from Arizona. The top five contributors from the CAMx/PSAT run are boundary conditions, point sources from Mexico, area sources from Pacific offshore, and point sources from Nevada and the eastern United States. Although the spatial patterns from both methodologies are
similar, the receptor bar plots show differences between the two sets of top-five contributors. [54] We also note there are differences between CMAQ and CAMx not only in the individual tracers but also in the model simulated species concentrations. Because the models use identical input data, the differences in model simulated concentrations can be attributed to differences in model formulation and in the implementation of the science algorithms. While the science processes are similar in the two models there are differences in the implementation and in the numerical methods used. For example, the vertical advection step is solved by the fully implicit approach in CAMx; while the PPM method is used for vertical advection in CMAQ. The treatment of horizontal dispersion also differs in CMAQ and CAMx. Both models use a
Table 3. Benchmarks of CMAQ-TSSA Versus CMAQ for Both Runtime and Disk Space With Different Numbers of CPUs, Source Regions, and Source Categories Scenario
Description
Number of CPUs
Source Definition (Categories by Regions)
Number of TSSA Tracers
Runtime (h:min)
Benchmark 1
TSSA Base Case TSSA Base Case
6 6 8 8
6 N/A 50 N/A
3 N/A 8 N/A
2:48 2:31 8:35 1:53
Benchmark 2
14 of 17
Disk Space �0.54 �0.40 �2.50 �0.40
Gb Gb Gb Gb
D21206
WANG ET AL.: DEVELOPMENT OF CMAQ TSSA FOR POLLUTANTS
D21206
Figure 10. (top) CMAQ/TSSA versus (bottom) CAMx/PSAT receptor bar plots for aerosol sulfate for Hance Camp at Grand Canyon National Park, Arizona, for the month of July 2002. spatially varying eddy diffusivity dispersion coefficient, but scaling of the dispersion coefficient with grid resolution differs between the two models such that CMAQ is much less dispersive than CAMx for the 36-km grid resolution used in our test case. We performed additional test simulations with CMAQ and CAMx using emissions of a nonreactive tracer and confirmed that the CAMx simulation had greater dispersion of the tracer with lower peak concentrations near the emissions source and higher con-
centrations in grid cells farther away from the source. For boundary conditions at the top of the model, the CAMx model specifies top concentrations for a subset of species and ‘‘lower bound’’ values for other species, while CMAQ uses a zero-flux boundary condition. Although both models use the same set of MM5 meteorology, the different meteorological preprocessors (MCIP for CMAQ; mm5camx for CAMx) produce different vertical eddy diffusivity values. For our test case, these differences caused CAMx
15 of 17
D21206
WANG ET AL.: DEVELOPMENT OF CMAQ TSSA FOR POLLUTANTS
to be more dispersive than CMAQ, and we believe this is why the boundary condition was the top contributor to nitrate and sulfate at many receptor sites in CAMx but not in CMAQ. A much more comprehensive comparison of the two models would be required to quantify these differences, and that is beyond the scope of this study.
5. Summary [55] We have developed and tested new source apportionment algorithms in the CMAQ Chemical-Transport Model (CCTM) using reactive tracers to track the chemical transformation and transport of emissions from selected emissions source categories or regions. The tagged species source apportionment (TSSA) algorithm includes more than enough tagged species tracers to evaluate the contributions of different emissions sources. The algorithm was designed to track the emissions either from a single source or from selected classes of sources, grouped by source category and/ or by region. The particulate species TSSA has been implemented for include aerosol sulfate, aerosol nitrate, ammonium, elemental carbon, secondary organic species, and other fine particulate species. The results of the tagged species source apportionment (TSSA) algorithm are threedimensional concentration fields showing the transport of mass of both primary emissions and secondary products from the selected emissions sources. We have also developed visualization tools to show results of the source apportionment algorithm as the contribution of each source categories to speciated PM mass at selected receptor locations, and as three-dimensional animations of transport from the selected emissions sources. [56] We performed a comprehensive model performance evaluation for the CMAQ/TSSA model versus EPA CMAQ standard release for calendar year 2002 for the 36-km domain. The results show that the CMAQ/TSSA code did not inadvertently alter the results when TSSA is turned off. In order to evaluate the CMAQ/TSSA algorithm, we used the 2002 WRAP 36 km CMAQ input files created under the funding and direction of WGA/WRAP [Tonnesen et al., 2006]. We have carried out two sets of activities to evaluate the CMAQ/TSSA algorithm. First, we perform CMAQ/ TSSA sensitivity simulations in which selected emissions source categories are zeroed out. Sensitivity simulations for nonreactive elemental carbon are also included as a reference test, since the TSSA and sensitivity methods should provide identical results for nonreactive species. The comparisons to assess the degree of consistency between the two methods show that the source apportionment results compared comparably to the results of model sensitivity simulations. Second, we compared CMAQ/TSSA to CMAQ zero-out model simulations with identical meteorology, emissions data sets, source regions and categories, and spinup days to better (more accurately) evaluate the consistency of modeling results between the two models. Because of nonlinearity in NOx and SOx reactions, the CMAQ zeroout sensitivity runs are useful for evaluating the CMAQ TSSA results only for nonreactive species. We present results for the comparison of the zero-out sensitivity to TSSA for sulfate and nitrate only to show the differences in the results. Because we expect the results to be different for the two methods, it is not possible to judge the accuracy of
D21206
the TSSA results from this comparison. We know that there are errors in the CMAQ TSSA results caused by problems with mass conservation and numerical instability in ISSOROPIA in CMAQ, However, we are not able to quantify those errors by comparing TSSA results to sensitivity simulations for reactive species because of nonlinear effects in chemical reactions. We can quantify mass conservation errors for reactive species, and this is a good indication of the effect that mass conservation errors might have on sulfate and nitrate results. But we are not able to develop a rigorous approach for quantifying errors in ISSOROPIA. [57] We compared the CMAQ/TSSA algorithm to CAMx with its source apportionment method, PSAT, for the months of January and July 2002. Similar to CMAQ/TSSA, CAMx/PSAT uses reactive tracers to track the chemical transport and transformation of emissions from selected emissions source categories or regions. We performed the CAMx/PSAT and CMAQ/TSSA model simulations with identical MM5 meteorology, emissions data sets, source regions and categories, and spinup days to better (more accurately) evaluate the consistency of modeling results between the two models. The two models produced similar results in the relative order of contributors to haze. Boundary conditions were ranked slightly lower as a contributor in CMAQ than in CAMx, but they were a major source in both cases. We believe the differences in the results between CMAQ/TSSA and CAMx/PSAT are mostly from model formulation and not from source apportionment methodologies. [58] Finally, we believe the results of this study are useful to air quality managers and scientists both at regulatory agencies and at the regulated industries for evaluating the contribution and importance of individual emissions sources. The TSSA is a computationally efficient approach to track mass contributions to PM formation and identifies source contributions in a way that accounts for chemical nonlinearity. The methodology is different from a zero-out (or a sensitivity run) where the results are affected by nonlinearity in chemical reactions so they are not definitive in characterizing source contributions. The results from TSSA identify the extent to which mass from particular emissions sources contribute to particulate concentrations at downwind receptor sites. These results can be initially used to identify important emissions sources, followed by traditional control (zero-out) simulations to test various emissions reduction strategies. Therefore, reducing the high computation costs of performing runs that may have little policy benefits. In addition, the TSSA algorithm specifically tracks mass from particular sources, it is useful for evaluating the contribution of an individual source with relatively small emissions; that is a source, which cannot be evaluated in ‘‘brute force’’ sensitivity simulations as the source is small compared to other contributors. This research will benefit the public by assisting in the development of more effective strategies for reducing concentrations of ambient air pollutants, leading to more rapid and economical attainments of air quality goals for PM and haze. [59] For future work, we will incorporate the TSSA algorithm into the latest CMAQ version 4.7 and completely revamp how secondary organic aerosol is tracked. We will also update the TSSA emissions algorithms to account for the new CMAQ inline options that include the BEIS model,
16 of 17
D21206
WANG ET AL.: DEVELOPMENT OF CMAQ TSSA FOR POLLUTANTS
plume rise, and bidirectional ammonia and mercury surface flux. The TSSA chemistry will also be updated to the CB5 mechanism with chlorine chemistry. [60] Acknowledgments. The authors would like to thank the Western Governors Association/Western Regional Air Partnership (WGA/WRAP) and U.S. Environmental Protection Agency for supporting this work. We also wish to thank Bo Wang and Yinqun Wang for their contributions to this work. We would also like to thank the reviewers whose comments led to substantial improvements of the manuscript.
References Bhave, P. V., G. Pouliot, and M. Zhang (2007), Diagnostic model evaluation for carbonaceous PM2.5 using organic markers measured in the southern U.S., Environ. Sci. Technol., 41, 1577 – 1583, doi:10.1021/ es061785x. Carolina Environmental Program (2004), The Sparse Matrix Operator Kernel Emissions model version 2.1 user’s guide, report, Univ. of N. C. at Chapel Hill, Chapel Hill. Chang, J. S., R. A. Brost, I. S. A. Isaksen, P. Middleton, W. R. Stockwell, and C. J. Walcek (1987), A three-dimensional Eulerian acid deposition model: Physical concepts and formulation, J. Geophys. Res., 92(D12), 14,681 – 14,700, doi:10.1029/JD092iD12p14681. Chang, J. S., P. B. Middleton, W. R. Stockwell, C. J. Walcek, J. E. Pleim, H. H. Lansford, S. Madronich, F. S. Binkowski, N. L. Seaman, and D. R. Stauffer (1990), The Regional Acid Deposition Model and Engineering Model, SOS/T Rep. 4, Natl. Acid Precip. Assess. Program, Washington, D. C. Colella, P., and P. L. Woodward (1984), The Piecewise Parabolic Method (PPM) for gas-dynamical simulations, J. Comput. Phys., 54, 174 – 201, doi:10.1016/0021-9991(84)90143-8. Crutzen, P. J. (1983), Atmospheric interactions—Homogeneous gas reactions of C, N, and S containing compounds, in The Major Biochemical Cycles and Their Interactions, edited by B. Bolin and R. B. Cook, pp. 67 – 114, John Wiley, Chichester, U. K. Dunker, A. M. (1981), Efficient calculation of sensitivity coefficients for complex atmospheric models, Atmos. Environ., 15, 1155, doi:10.1016/ 0004-6981(81)90305-X. Dunker, A. M. (1984), The decoupled direct method for calculating sensitivity coefficients in chemical kinetics, J. Chem. Phys., 81, 2385, doi:10.1063/1.447938. Dunker, A. M., G. Yarwood, J. P. Ortmann, and G. M. Wilson (2002), Comparison of source apportionment and source sensitivity of ozone in a three-dimensional air quality model, Environ. Sci. Technol., 36, 2953 – 2964, doi:10.1021/es011418f. ENVIRON International Corporation (2008), User’s Guide Comprehensive Air Quality Model with Extensions (CAMx4) Version 4.50, report, Novato, Calif. (Available at http://www.camx.com) Grell, G. A., J. Dudhia, and D. R. Stauffer (1994), A description of the fifthgeneration Penn State/NCAR Mesoscale Model (MM5), NCAR Tech Note, NCAR/TN-398_STR, 138 pp., Natl. Cent. for Atmos. Res., Boulder, Colo. Guinnup, D., and B. Collum (1997), Final Report, vol. I, Executive Summary, OTAG Air Qual. Anal. Workgroup, St. Louis, Mo. Hakami, A., J. H. Seinfeld, T. F. Chai, Y. H. Tang, G. Carmichael, and A. Sandu (2006), Adjoint sensitivity analysis of ozone nonattainment over the continental United States, Environ. Sci. Technol., 40, 3855 – 3864, doi:10.1021/es052135g.
D21206
Houyoux, M. R., J. M. Vukovich, C. J. Coats Jr., N. M. Wheeler, and P. S. Kasibhatla (2000), Emission inventory development and processing for the Seasonal Model for Regional Air Quality (SMRAQ) project, J. Geophys. Res., 105(D7), 9079 – 9090, doi:10.1029/1999JD900975. Husar, R. B., and W. P. Renard (1997), Ozone as a function of local wind direction and wind speed: Evidence of local and regional transport, report, Cent. for Air Pollut. Impact and Trend Anal., Washington Univ., St. Louis, Mo. (Available at http://capita.wustl.edu/otag/Reports/OTAGWIND/ OTAGWIND.html) Kemball-Cook, S., Y. Jia, C. Emery, R. Morris, Z. S. Wang, and G. S. Tonnesen (2005), Annual 2002 MM5 meteorological modeling to support regional haze modeling of the western United States, draft final report, Western Reg. Air Partnership, Denver, Colo. Koo, B., A. M. Dunker, and G. Yarwood (2007), Implementing the decoupled direct method for sensitivity analysis in a particulate matter air quality model, Environ. Sci. Technol., 41, 2847 – 2854, doi:10.1021/ es0619962. Moon, N., and D. W. Byun (2004), Simple user’s guide for ‘‘geos2cmaq’’ code: Linking CMAQ with GEOS-CHEM, version 1.0: August 22, 2004, report, Inst. for Multidimensional Air Qual. Stud., Univ. of Houston, Houston, Texas. Napelenok, S. L., D. S. Cohan, Y. T. Hu, and G. Russell (2006), Decoupled direct 3D sensitivity analysis for particulate matter (DDM-3D/PM), Atmos. Environ., 40, 6112 – 6121, doi:10.1016/j.atmosenv.2006.05.039. Napelenok, S. L., D. S. Cohan, M. T. Odman, and S. Tonse (2008), Extension and evaluation of sensitivity analysis capabilities in a photochemical model, Environ. Model. Software, 23, 994 – 999, doi:10.1016/ j.envsoft.2007.11.004. Novak, J. H., et al. (1998), Model-3: A unifying framework for environmental modeling and assessment, paper presented at 10th Joint Conference on Applications of Air Pollution Meteorology, Am. Meteorol. Soc., Boston, Mass. Parker, L., and J. Blodgett (1999), Air quality: EPA’s Ozone Transport Rule, OTAG, and Section 126 petitions—A hazy situation?, CRS Rep. 98-236, Congr. Res. Serv., Washington, D. C. Schichtel, B., R. Husar, and R. Poirot (1998), Climatology of ozone synoptic scale transport in the eastern U.S., paper presented at 78th Annual Meeting, Am. Meteorol. Soc., Phoenix Ariz. Tonnesen, G., et al. (2006), Final report for the WRAP 2002 visibility model performance evaluation, final report, WRAP RMC, Riverside, Calif. U.S. Environmental Protection Agency (U.S. EPA) (1999), Science algorithms of the EPA Models-3 Community Multiscale Air Quality (CMAQ) modeling system, Rep. EPA-600/R-99/030, 727 pp., U.S. Environ. Prot. Agency, Washington, D. C. Wagstrom, K. M., S. N. Pandis, G. Yarwood, G. M. Wilson, and R. Morris (2008), Development and application of a computationally efficient particulate matter apportionment algorithm in a three-dimensional chemical transport model, Atmos. Environ., 42, 5650 – 5659, doi:10.1016/ j.atmosenv.2008.03.012. Yang, Y.-J., J. Wilkinson, and A. G. Russell (1997), Fast, direct sensitivity analysis of multidimensional photochemical models, Environ. Sci. Technol., 31, 2859 – 2868, doi:10.1021/es970117w. Ying, Q., and M. J. Kleeman (2006), Source contributions to the regional distribution of secondary particulate matter in California, Atmos. Environ., 40, 736 – 752, doi:10.1016/j.atmosenv.2005.10.007. ����������������������
C.-J. Chien, G. S. Tonnesen, and Z. S. Wang, Center for Environmental Research and Technology, Bourns College of Engineering, University of California, 1084 Columbia Avenue, Riverside, CA 92507, USA. (tonnesen@ cert.ucr.edu)
17 of 17