Journal of Chromatography A, 1217 (2010) 6394–6404
Contents lists available at ScienceDirect
Journal of Chromatography A journal homepage: www.elsevier.com/locate/chroma
Development of a multi-class method for the quantification of veterinary drug residues in feedingstuffs by liquid chromatography-tandem mass spectrometry Aurore Boscher, Cédric Guignard, Terence Pellet, Lucien Hoffmann, Torsten Bohn ∗ Public Research Center - Gabriel Lippmann, Department Environment and Agro-Biotechnologies, 41 rue du Brill, L-4422 Belvaux, Luxembourg
a r t i c l e
i n f o
Article history: Received 22 April 2010 Received in revised form 2 August 2010 Accepted 9 August 2010 Available online 14 August 2010 Keywords: Antibiotics Coccidiostats LC–MS/MS Feed Standard addition method Matrix effects
a b s t r a c t A simple multi-residue method was developed for detecting and quantifying 33 analytes from 13 classes of antibiotics (tetracyclines (3), quinolones (7), penicillins (3), ionophore coccidiostats (7), macrolides (3), sulfonamides (1), quinoxalines (2), phenicols (2), lincosamides (1), diaminopyrimidines (1), polypeptides (1), streptogramins (1) and pleuromutilins (1)) in animal feeds. Extraction and clean-up procedures were optimized with spiked piglet feed. Samples were extracted by ultrasonic-assisted extraction with a mixture of methanol/acetonitrile/McIlvaine buffer at pH 4.6 (37.5/37.5/25, v/v/v) containing 0.3% of EDTA-Na2 , followed by a clean up using a dispersive solid-phase extraction (d-SPE) with PSA (primary secondary amine). Detection of antibiotics was achieved by liquid chromatography-electrospray tandem mass spectrometry (LC–ESI-MS/MS) within 28 min using both positive and negative ESI mode. Average recoveries ranged from 51% (oxytetracycline) to 116% (tilmicosin) with associated relative standard deviations of 7.3% and 9.0% and an overall mean of 87%. Limits of quantification ranged from 3.8 ng g−1 (lincomycin) to 65.0 ng g−1 (bacitracin). Following optimization, the method was further verified for bovine and lamb feedingstuffs; negative matrix effects were evaluated and overcome by a standard addition method. © 2010 Elsevier B.V. All rights reserved.
1. Introduction Since the 1950s, a large number of veterinary drugs have been used in order to improve animal health, but also as growth promoters for intensive animal production. However, the abuse and overuse of antibiotics in food-producing animals resulted in the presence of these compounds in final products for human consumption, including meat, fish, milk and eggs [1–5]. The public health hazards related to antimicrobial use in agriculture and aquaculture involves several problems such as the increased risk of developing allergies in individuals with hyper-sensitivity and the development of antibiotic-resistant bacteria [6–8]. Since 2006, antibiotic and anticoccidial compounds acting as growth promoters have been banned by the European Commission [9] to ensure human and animal safety, and antibiotics are now strictly reserved for the prevention or treatment of diseases. However, antibiotics might still make their way into animal based food products, either by illegal usage through antibiotic containing feedingstuffs, or unintentional crosscontamination. Therefore, monitoring of antibiotic residues in feed is of importance for controlling contamination within the foodprocessing chain, potentially resulting in deleterious health effects
∗ Corresponding author. Tel.: +352 470 261 480; fax: +352 470 264. E-mail addresses:
[email protected],
[email protected] (T. Bohn). 0021-9673/$ – see front matter © 2010 Elsevier B.V. All rights reserved. doi:10.1016/j.chroma.2010.08.024
in animals and consumers, and violating good manufacturing guidelines. Regarding residues of veterinary drugs in foodstuffs of animal origin, maximum residue limits (MRLs) were set by the European Commission [10], and monitoring plans were set up for ensuring MRLs and preventing the presence of prohibited substances in food. These MRLs are generally in the area of 25–300 ppb, but go up to 1500 ppb for florfenicol in fish (muscle and skin) and 400 ppb for flumequine in chicken (muscle). Microbiological assays are among the most commonly used techniques for the detection of the majority of antibiotic classes. However, due to the risk of false positive samples, results from microbiological assays typically require confirmation by a confirmatory method, allowing for selective, sensitive, accurate and rapid detection and quantification of antibiotics for an effective surveillance. Commission Decision 2002/657/EC [11] has introduced the concept of identification points (IPs) for confirmatory methods of samples from animal origin, suggesting antibiotic detection should be based on more than a single characteristic. These suggestions were followed in the present manuscript, with LC–MS/MS operating in multiple reaction monitoring (MRM) mode (one precursor and two product ions selected) satisfying this requirement (producing 4 IPs), whereas LC coupled with a diode array detector or a fluorescence detector could have only yielded one IP [11]. A limited number of papers exist describing quantitative multiresidue methods covering more than three classes of veterinary
A. Boscher et al. / J. Chromatogr. A 1217 (2010) 6394–6404
drug residues in complex matrices. The majority of these methods focused on animal tissues [12–18], but to our knowledge, only one analytical method has been developed and validated for the detection of several antibacterial compounds (spiramycin, bacitracin, tylosin, virginiamycin and olaquindox) in various classes of feedingstuffs [19]. Furthermore, according to our knowledge, no method has been developed combining the simultaneous detection of weakly polar (such as ionophore coccidiostats) and polar compounds (e.g. -lactams) from food or feeds, due to challenges during the extraction steps. In general, coccidiostats have been extracted employing a high percentage of organic solvent (>90%) [20–25], whereas for -lactams a higher content of water for extraction is needed [21,26–30]. However, under these conditions, interfering proteins and other undesirable compounds were coextracted, resulting in a high signal suppression for coccidiostats during LC–MS/MS analysis [24,31,32]. The development of a multiclass method for detecting a large variety of residual antibiotics in feed therefore appears as a considerable challenge. The different chemical groups, the amphoteric properties of many compounds, and the large polarity range pose difficulties for extraction, clean up, and analytical separation. Sample extraction has previously been carried out predominantly based on solvent extraction by shaking and ultrasonicassisted extraction (UAE). However, pressurized liquid extraction (PLE) was also used [2,4,26,33,34]. In some studies, the extract was simply diluted before analysis [35,36], whereas in other studies, a clean-up step was added, such as liquid–liquid extraction (LLE), e.g. by using hexane to remove lipids [37,38], solid-phase extraction (SPE) using various solid phases (Oasis® HLB, ion-exchange, silica, etc.) [19,24,39,40], and tandem-SPE [33], but also matrix solid-phase dispersion extraction (MSPDE) employing C18 material. More recently, QuEChERS (QUick, Easy, CHeap, Effective, Rugged and Safe) methodology [41] was developed for the extraction and clean up of pesticide residues from fruits and vegetables, and has further been adapted for the clean up of feedstuff extracts [42–44]. This paper describes the development of a reliable and simple multi-class method for the determination and quantification of 33 antibiotics from 13 different classes: tetracyclines, quinolones, penicillins, ionophore coccidiostats, macrolides, sulfonamides, quinoxalines, phenicols, lincosamides, diaminopyrimidines, polypeptides, streptogramins and pleuromutilins. Techniques of extraction, clean-up procedure, solvent mixtures, and LC–MS/MS conditions were optimized for improved sensitivity and selectivity. Finally, we obtained a method allowing for the extraction of these compounds by a single extraction step, followed by a dispersive clean up with primary and secondary amine exchange material (PSA) and LC–MS/MS analysis, using both positive and negative modes. The method was optimized for porcine feed and further evaluated using additional matrices (bovine and lamb feeds) to evaluate specific matrix effects on signal suppression and recoveries. 2. Experimental 2.1. Chemicals and reagents Penicillin G procaine, penicillin V potassium salt, amoxicillin trihydrate, lasalocid A sodium salt solution (100 g mL−1 in acetonitrile), monensin sodium salt, maduramycin ammonium, narasin, salinomycin monosodium salt hydrate, robenidine HCl, nalidixic acid sodium salt, oxolonic acid, flumequine, ciprofloxacin, enrofloxacin, marbofloxacin, danofloxacin, florfenicol, chloramphenicol, trimethoprim, tilmicosin, spiramycin, tylosin tartrate; virginiamycin M1, valnemulin, bacitracine zinc salt, carbadox, olaquindox, tetracycline hydrochloride, oxytetracycline hydrochloride, doxycycline hyclate, sulfadiazine, lincomycin
6395
Table 1 Main constituents of the feedingstuffs used. Components (%)
Piglet feed (powder)
Bovine feed (pellets)
Lamb feed (pellets)
Proteins Cellulose Lipid
17.0 4.8 3.8
17.8 7.5 3.6
15.2 10.7 2.0
Rape meal Bran wheat Palm meal Rye Corn gluten Wheat Triticale Barley Corn Soybean meal Molasses Soybean Malt Pea Beet pulp Luzerne
3 8 – – – 34 – 25 5 6 – 6 – 5 3 –
18 13 11 10 10 10 5 3 8 4 3 – 2 – – –
5 4 – – – – – 35 – 10 5 – – – 18 20
hydrochloride monohydrate and d5 -chloramphenicol were purchased from Sigma–Aldrich (Seelze, Germany). Flavophospholipol was obtained from Biovet/Huvepharma (Anvers, Belgium). 13 C3 flumequine, d4 -sulfadiazine, 13 C6 -amoxicillin and d6 -tetracycline (TC d6 ) were purchased from LGC Standards (Molsheim, France). Citric acid and silica gel were purchased from VWR prolabo (Leuven, Belgium). Anhydrous disodium hydrogenophosphate was provided by UCB (Leuven, Belgium). Formic acid 99%, ammonium acetate, methanol, and acetonitrile (ULC/MS grade) were provided by Biosolve (Valkenswaard, The Netherlands). PSA bonded silica was obtained from Supelco (Bellefonte, PA, USA). Florisil was provided by Merck (Darmstadt, Germany). Oasis® HLB SPE cartridges (6 mL, 200 mg) were purchased from Waters (Milford, PA, USA) and Chromabond® C-18ec (6 mL, 500 mg) from Macherey-Nagel (Düren, Germany). Ultra-pure water was obtained with a Milli-Q water purification system (Millipore, Brussels, Belgium). 2.2. Samples and sample preparation Piglet, bovine and lamb feed were obtained from Versis (Mersch, Luxembourg), and their composition is presented in Table 1. Pellets were ground prior to usage. The absence of the target antibiotics was checked by LC–MS/MS analysis. The development of the method was performed on 4 ± 0.1 g of the blank piglet feed samples (consisting of 17.0% of proteins, 4.8% of cellulose, and 3.8% of lipids according to the label information). For verifying recovery of veterinary residues, feed samples were weighed into 30 mL glass tubes, and spiked at three different concentrations (level 1: 2× LOQ of the analytes; level 2: 160 ng g−1 for bacitracin and flavophospholipol, 80 ng g−1 for amoxicillin, 13 C6 -amoxicillin and lasalocid, and 40 ng g−1 for the others; level 3: 300 ng g−1 for bacitracin and flavophospholipol, 150 ng g−1 for amoxicillin, 13 C6 -amoxicillin and lasalocid, and 75 ng g−1 for the others). Following spiking, samples were left to equilibrate for 1 h with the feed matrix. TC d6 and Amox 13 C were investigated for their later use as internal standards in 3 routine analysis. Additionally, blank samples (i.e. without spiking of antibiotics) were processed. 2.3. Procedures Two procedures for residue extraction and two for following clean up (using different sorbents) were evaluated in order to compare their efficiency.
6396
A. Boscher et al. / J. Chromatogr. A 1217 (2010) 6394–6404
2.3.1. Extraction procedure 1: ultrasonic-assisted extraction (UAE) Each sample was extracted with 15 mL of CH3 OH/CH3 CN/McIlvaine buffer, pH 4.6 (37.5/37.5/25, v/v/v) containing 0.3% of EDTA-Na2 (0.5 M). The solvent mixture was added to 4 g of each sample, shaken for 30 s, and then placed in an ultrasonic bath for 15 min (37 kHz, 300 W). Supernatant (6 mL) was then transferred to a propylene tube (15 mL) for centrifugation at 4500 × g at 15 ◦ C for 10 min, and 5 mL of supernatant were transferred into another propylene tube (15 mL) for further clean up. 2.3.2. Extraction procedure 2: pressurized solvent extraction (PLE) Sample extractions were performed by PLE, using an ASE 100 (Dionex, Sunnivale, CA, USA) and 10 mL extraction cells. A cellulose filter (Dionex, Belgium) was placed at the bottom of each cell, followed by the sample containing 40 L aqueous EDTA-Na2 solution (0.5 M), and pre-washed quartz sand was added to fill the entire remaining space of the cell. A second cellulose filter was then placed on top of the cell. The samples were extracted using the same mixture as described under Section 2.3.1 using 60 ◦ C as extraction temperature (optimized between 50, 60 and 70 ◦ C), 7 min as static time, two extraction cycles, a flush volume of 60%, a purge time of 60 s, and an extraction pressure between 1500 and 1700 psi. The final extraction volume was approximately 15 mL. The total extract was transferred to a polypropylene tube (50 mL), and was adjusted to a final volume of 20 mL with water prior to centrifugation at 4500 × g at 15 ◦ C for 10 min. An aliquot of 7 mL was then transferred for the following clean up. 2.3.3. Clean-up procedures The supernatant resulting from the extraction procedure was either passed through a conditioned SPE C-18ec or HLB (hydrophilic-lipophilic balanced) cartridge for solid-phase extraction (SPE) or was transferred to a polypropylene tube containing one of the three tested sorbents, florisil, silica or PSA, for the dispersive solid-phase extraction (d-SPE). For SPE clean up, 5 mL of supernatant were evaporated to below 1 mL and 5 mL of pure water were added. Cartridges were successively conditioned with 6 mL of methanol and 6 mL of water. After sample loading onto the SPE cartridge, the latter was rinsed with 3 mL of water and the elution was performed using 6 mL of methanol. The eluate was evaporated to about 500 L. For the d-SPE, 5 mL of supernatant were vortexed with 250 mg of a sorbent for 1 min, and centrifuged at 4500 × g for 10 min at 15 ◦ C. Three mL of supernatant were then evaporated below of 800 L. 2.3.4. Procedure of the final selected method Extraction was finally performed by UAE (Section 2.3.1) followed by the d-SPE (Section 2.3.3), employing 250 mg of PSA, with exactly 3 mL of supernatant being collected in a glass tube for evaporation (final volume below 0.8 mL) under a stream of nitrogen at 40 ◦ C. The exact volume was then measured with a 1 mL syringe and transferred to a 2.5 mL Eppendorf tube. Pure water was added in order to obtain a final volume of 1.5 mL, and the extracted sample was stored at −20 ◦ C until analysis (less than 1 week). Immediately prior to LC–MS/MS analysis, the sample was centrifuged at 5000 × g at 10 ◦ C and a 300 L aliquot was diluted with 900 L of water to further reduce matrix effects. 2.4. LC–MS/MS conditions The chromatographic system consisted of an Ultimate 3000 Intelligent LC system (Dionex, Sunnyvale, CA, USA) equipped with a
HPG-3200 binary high pressure gradient pump, a WPS-3000 automatic injector and a TCC-3100 column oven. The veterinary drugs were detected by an API 3200 triple quadrupole mass spectrometer (Applied Biosystem/MDS Sciex, Rotterdam, The Netherlands) with an electrospray (ESI) interface, using the Analyst 1.4.1 (Applied Biosystems) software. The capillary voltage was 5.5 kV in positive mode and −4.5 kV in negative mode. N2 was used as nebuliser gas (GS1 = 45 psi and GS2 = 45 and 30 psi for ESI+ and ESI−, respectively), curtain gas at 15 and 10 psi for ESI+ and ESI−, respectively, collision gas at 5 psi, and the desolvation temperature was fixed at 550 ◦ C. Each target compound was detected by using two selected reaction monitoring (SRM) channels. The complete MS parameters, including declustering potentials, SRM transitions, and collision energies are given in Table 2. A reconstructed chromatogram of blank injections and spiked piglet matrix is shown in Fig. 1. The chromatographic separation was achieved on a Zorbax XDB plus (2.1 mm × 150 mm, particle size 3.5 m; Agilent, Germany), with a guard column (2.1 mm × 12.5 mm, particle size 5 m; Agilent, Germany), at a flow rate of 0.25 mL min−1 and the column temperature was 40 ◦ C. The injection volume was 25 L. In positive mode (ESI+), the mobile phase A consisted of water with 0.1% formic acid, and mobile phase B was a mixture of acetonitrile/methanol (70/30, v/v) with 0.1% formic acid. The gradient was 15% B for 3 min, increased to 50% within the following 11 min, to 100% the following 4 min, held at 100% for 7 min and returned to 15% during 3 min. 13 C3 -flumequine and d4 -sulfadiazine were used as internal chromatographic standards. In negative mode (ESI−), mobile phase A was water containing 5 mM ammonium acetate and mobile phase B was a mixture of acetonitrile/methanol (70/30, v/v). The gradient was 10% B for 2 min, increased to 100% within the next 10 min, held at 100% for 7 min and returned to 10% during 2 min. d5 -Chloramphenicol was used as an internal chromatographic standard. 2.5. Validation of the method The calibration curves for the quantification were obtained by spiking the extracted blank samples with the working standard mixture of veterinary drugs. The linearity was tested according to the AFNOR XP T90-210 protocol [45]. The instrument limits of detection and quantification (ng mL−1 ) were estimated by following procedures outlined earlier [45,46] based on the calibration curves (n = 5, levels = 9) and by the injection of blank samples (n = 10). The limit of quantification of the sample (expressed as ng g−1 ) was determined from the LOQ of the instrument measurements (expressed in ng mL−1 ). Recoveries were determined based on the ratio between six blank feed samples spiked at the beginning of the extraction procedure and three blank feed samples spiked to the expected concentration in the resulting 1.5 mL final extract. The within-day and between-day recoveries and associated repeatability (RSD%) and reproducibility (RSD%) were evaluated by spiking six blank samples at each of the three spiking concentrations (see Section 2.2), and the determination of reproducibility was carried out on three different days. 2.6. Standard addition method Four blank samples were spiked at 40 ng g−1 (80 L of the standard mixture) for all compounds, except for lasalocid and amoxicillin which were spiked at 80 ng g−1 , and flavophospholipol and bacitracin which were spiked at 160 ng g−1 . The final procedure (Section 2.3.4) was then used for extraction and clean up. For the standard addition performed prior to the extraction step, 80, 160, and 240 L of the standard mixture (used for the initial spiking) were added directly to the sample. For the standard addition per-
A. Boscher et al. / J. Chromatogr. A 1217 (2010) 6394–6404
6397
Table 2 SRM conditions for the LC–MS/MS analyses of various antibiotics. Antibiotic
ESI
Retention time (min)
Parent ion (m/z)
DPa (V)
Transition 1 (CEb , in V)
Transition 2 (CEb , in V)
Olaquindox Lincomycin Sulfadiazin d4 -Sulfadiazin (IS) Marbofloxacin Trimethoprim Oxytetracycline Ciprofloxacin Carbadox Tetracycline d6 -Tetracycline Danofloxacin Enrofloxacin Spiramycin I Doxycycline Oxolinic acid Tilmocosin Bacitracin Nalidixic acid Tylosin A Flumequine 13 C3 -flumequine (IS) Valnemulin Robenidine Virginiamycin M1 Lasalocid A Monensin Salinomycin Narasin Amoxicillin 13 C6 -amoxicillin Penicillin G Penicillin V Florfenicol Chloramphenicol d5 -Chloramphenicol (IS) Flavophospholipol Maduramycin
+ + + + + + + + + + + + + + + + + + + + + + + + + + + + + − − − − − − − − −
2.4 3.6 3.8 3.8 4.7 4.7 6.0 6.3 6.5 6.8 6.8 6.9 7.2 9.5 10.4 11.1 11.3 11.3 13.9 14.2 14.5 14.5 16.1 16.6 16.7 21.0 21.5 21.8 22.4 3.1 3.1 6.8 7.1 7.4 7.9 7.9 9.8 15.9
264.3 407.3 251.2 255.1 363.2 291.3 461.2 332.3 263.1 445.2 451.1 358.2 360.3 422.4 445.2 262.1 869.7 475.2 233.1 916.6 262.2 265.1 565.5 334.2 526.4 613.5 693.5 773.6 787.6 364 370.1 333 349 356 321 326 790.2 915.6
40 58 45 41 53 58 49 54 49 43.5 36 53 55 30 43 35 124 44 29 101 27 36 43 50 42 85 108 103 107 −20 −25 −20 −20 −29 −48 −35 −64 −66
143.1 (43) 126.2 (42) 156.1 (20) 96 (39) 72.1 (46) 230.2 (31) 426.2 (25) 231.2 (49) 231.2 (17) 410.3 (26) 416.2 (25) 340.3 (30) 316.3 (28) 174.2 (29) 428.2 (24) 244.2 (26) 88.2 (111) 199.3 (37) 215.2 (19) 174.2 (51) 244.2 (23) 247.1 (21) 263.3 (25) 138.1 (34) 355.2 (27) 377.4 (48) 461.4 (68) 265.2 (70) 431.3 (69) 223.1 (−12) 228.9 (−14) 191.9 (−14) 93.2 (−44) 184.9 (−26) 152 (−23) 156.8 (−26) 112.1 (−129) 112 (−82)
212.2 (29) 359.2 (25) 108 (35) 160 (21) 320.2 (21) 261.2 (33) 283.2 (47) 288.2 (22) 229 (23) 154.2 (37) 160.1 (35) 82.2 (70) 245.2 (38) 101.1 (26) 410.2 (36) 216.2 (36) 174.2 (62) 86.1 (47) 187.2 (32) 101.1 (75) 202.2 (41) 205.2 (43) 164.2 (42) 155.2 (29) 508.4 (19) 577.4 (48) 479.4 (73) 431.3 (67) 279.3 (74) 129 (−28) 212.0 (−24) 74.1 (−36) 114 (−28) 119 (−48) 257 (−17) 125.9 (−50) 79 (−120) 127.1 (−55)
IS, internal standard. a DP, declustering potential. b CE, collision energy.
formed after extraction, 3, 6 and 9 L of the standard mixture were added respectively into the resulting 1.5 mL extract, immediately prior to the last centrifugation. Area ratios between the internal standard and the analyte were finally plotted vs. the added concentrations, and the intercept of this regression line with the x-axis provided the initial analyte concentration in the sample. 2.7. Statistical analysis The recoveries obtained for the different conditions of extraction were analyzed by analysis of variance (ANOVA) or by Kruskal–Wallis tests for non-normal distributed data, which was verified by box-plots and normality plots. Given significant findings, these tests were followed by post hoc tests (Tukey’s), using the SigmaStat 2.03 (SAS Inc., Chicago IL, USA) software. Differences were considered significant for P < 0.05 (two-tailed). Unless otherwise stated, all values represent mean ± standard deviation. 3. Results and discussion 3.1. Optimization of extraction In a first step, the extraction procedure for the antibiotics from the matrix was optimized, using the following solvent mixtures: H2 O/CH3 OH, H2 O/CH3 CN prepared with varying volume ratios (100:0; 75:25; 50:50; 25:75; and 0:100) and 25% of acetone in water. First results (not presented) showed that for ionophores, the
best yields were obtained with 100% of organic solvent (CH3 CN or CH3 OH), whereas under the same conditions tetracycline, penicillin and macrolide families resulted in the lowest yields. For the majority of compounds the best recoveries were obtained with a mixture containing 75% or 50% of methanol or acetonitrile. In order to maximize the extraction yield of ionophore coccidiostats while keeping the other recoveries within an acceptable range, a composition of 75% of organic solvent was chosen as a compromise. Furthermore, as tetracyclines form a chelate complex with divalent metal cations and bind with proteins [47], the use of a stronger chelating agent of cations such as EDTA, or/and a strong acid, such as formic acid, or an acidic deproteinizing agent to eliminate proteins may greatly improve tetracycline extraction. It has been suggested previously that the McIlvaine/EDTA extraction combination may be successfully applied for a matrix containing metal ions and/or proteins [48]. Thus, in a second step, the following matrix extraction mixtures were tested: M1 = CH3 OH/H2 O (75/25, v/v). M2 = CH3 OH/H2 O (75/25, v/v) with formic acid 1%. M3 = CH3 OH/McIlvaine buffer, pH = 4.6 (75/25, v/v). M4 = CH3 OH/McIlvaine buffer, pH = 4.6 (75/25, v/v) with 0.3% of EDTA-Na2 (0.5 M). - M5 = CH3 CN/McIlvaine buffer, pH = 4.6 (75/25, v/v) with 0.3% of EDTA-Na2 (0.5 M). - M6 = CH3 OH/CH3 CN/McIlvaine buffer, pH = 4.6 (37.35/37.5/25, v/v/v) with 0.3% of EDTA-Na2 (0.5 M). -
6398
A. Boscher et al. / J. Chromatogr. A 1217 (2010) 6394–6404
Fig. 1. Reconstituted HPLC-ESI-MS-MS chromatograms of n = 33 antibiotics from 13 classes of antibiotics, with n = 26 detected in positive and n = 7 in negative mode. a and c showing blank (unspiked matrices), b and d showing spiked piglet feed matrix at concentrations of approx 20 ng mL−1 , with exception of flavophospholipol and bacitracin (80 ng mL−1 ) and lasalocid and amoxicillin (40 ng mL−1 ). Retention times for antibiotics and mass spectrometry parameters are listed in Table 2. IS = internal standard.
The mean recoveries of each antibiotic family using the above extraction solvents are presented in Fig. 2. Good recovery yields and small differences were observed between extraction conditions for macrolides, phenicols and the lincosamide. Similar good
recoveries had already been obtained during previous extraction trials with 25–75% of organic solvents in water, and similar results have been reported in the literature [49–51]. However, the best results for quinolones and streptogramin were obtained with the
Fig. 2. Influence of the solvent extraction composition on the recoveries of drug families (number of analytes by family; n = 3 for each individual analyte). Error bars represent standard deviation of the individual compounds from the family. M1: CH3 OH/H2 O (75/25, v/v), M2: CH3 OH/H2 O (75/25, v/v) with formic acid 1%, M3: CH3 OH/McIlvaine buffer, pH 4.6 (75/25, v/v), M4: CH3 OH/McIlvaine buffer, pH 4.6 (75/25, v/v) with 40 L of EDTA-Na2 (0.5 M), M5: CH3 CN/McIlvaine buffer, pH 4.6 (75/25, v/v) with 40 L of EDTA-Na2 (0.5 M), M6: CH3 OH/CH3 CN/McIlvaine buffer, pH4.6 (37.5/37.5/25, v/v/v) with 40 L of EDTA-Na2 (0.5 M). *P < 0.05; **P = 0.05.
A. Boscher et al. / J. Chromatogr. A 1217 (2010) 6394–6404
6399
Fig. 3. Ultrasonic-assisted extraction (UAE) and pressurized liquid extraction (PLE) recoveries using different temperatures (50, 60, and 70 ◦ C) for each antibiotic and coccidiostat family (number of analytes by family; n = 3 for each individual analyte). *P < 0.05.
mixtures M4, M5 and M6. For penicillins and sulfonamide, the best yields were obtained with M3, M4 and M6. Procedures with M1, M3, M4, M5 and M6 resulted in similar and good recoveries for quinoxalines, diaminopyrimidine, ionophore coccidiostats and pleuromutilin, whereas with M2 the yields decreased, probably due to the presence of formic acid, which could degrade these compounds or could inhibit the PSA efficiency due to adsorption of endogenous compounds, resulting in a high suppression effect. On the contrary, the presence of formic acid improved the extraction of tetracyclines by up to 40% in comparison with the same mixture without formic acid (M1 vs. M2, P < 0.001). Nevertheless, the presence of McIlvaine buffer (pH 4.6) with EDTA (M4) resulted in similar results compared to using formic acid (P > 0.05). However, it appears that the yields decreased if acetonitrile replaced methanol (P < 0.001). On the other hand, extraction with acetonitrile provided better recoveries compared with methanol for robenidine, with a mean increase of 25%. Thus, a good compromise was obtained with the mixture of CH3 OH/CH3 CN/H2 O (37.5/37.5/25; v/v/v), and McIlvaine buffer with EDTA should be used instead of formic acid. Finally, M6 was used as the best mixture for the extraction step, as this was overall the mixture yielding the highest mean recovery (83%) for all antibiotics investigated (range: 47–118%). In a third step, the extraction techniques UAE and PLE were compared. Temperature and extraction solvent are generally the most important parameters for ASE optimization. However, other parameters such us the static time, the number of extraction cycles, the flush volume and the cell size may have an influence on the recoveries. Carretero et al. [4] have optimized all the above mentioned parameters for the analysis of 31 antimicrobials in meat, with five different static times (2, 5, 10, 15 and 20); four temperatures (50, 70, 90 and 100 ◦ C), three cycle numbers (1, 2 and 3), four cell sizes (5, 11, 22 and 33) and four pressures being tested. These authors reported that recoveries increased until a static time of 10 min and until a cell size of 22 mL, but above these values, no influence on the extraction efficiency was noted. The best
yields were observed with a temperature of 70 ◦ C. However, no improvement on the yields was shown with different pressures ˜ et al. [26] optimized ASE and the number of cycles. Benito-Pena parameters for the quantification of penicillin V and amoxicillin in feed. The authors tested two temperatures (25 and 50 ◦ C), two cycle numbers (1 and 2), two flush volumes (60% and 120%) and two cell sizes (11 and 22 mL). The optimal conditions were found to be a temperature of 50 ◦ C, a static time of 5 min, a flush volume of 60%, a cell of 11 mL and only one cycle. Nevertheless, the described method has the disadvantage of requiring two different solvents, depending on the compound, adding substantially to time requirements. In another paper [52], five antibiotics in feed were successfully extracted at 80 ◦ C with two cycles and a static time of 5 min. In our study, the extraction solvent had been already optimized for ultrasonic extraction, the cell size and flush volume were fixed to 10 mL and 60%, respectively, in order to obtain a final volume of about 15 mL, allowing for a more accurate comparison with the UAE procedure. According to literature, the static time was fixed at 7 min, and 2 cycles were performed. As temperature was the final parameter to be optimized, three different temperatures (50, 60 and 70 ◦ C) were investigated and the mean recovery for each family is presented in Fig. 3. The recoveries of ionophore coccidiostats, penicillins, phenicols and especially sulfonamide decreased at 70 ◦ C, indicating their sensitivity to temperature. Moreover, no improvement was noted for the other families at 70 ◦ C. Therefore, 60 ◦ C was retained as the most suited temperature for the ASE technique. Finally, no significant difference (P > 0.05) was noticed between PLE at 60 ◦ C and UAE techniques (Fig. 3), albeit for tetracyclines, PLE at 60 ◦ C provided somewhat better recoveries than UAE, by approximately 10%, but failed to be statistically significant (P = 0.054). Due to the more rapid processing on the UAE and the capacity to allow for parallel sample extraction compared to the PLE (15 min for 20 samples vs. 20 min for a single sample, respectively), the UAE procedure was retained for subsequent extractions.
6400
A. Boscher et al. / J. Chromatogr. A 1217 (2010) 6394–6404
We further observed that a final centrifugation of the extract is preferred to filtration. In fact, the filtration of extracts through PVDF (0.2 m) and GHP (0.2 m) filters resulted in losses varying from 30% to 70% for ionophore coccidiostats, 30% for spiramycin, and 60% for tilmicosin for PVDF filters, and about 20% for valnemulin, robenidine and tilmicosin for the GHP filters. For all other analytes, losses remained below 10%. 3.3. Method validation for piglet feed
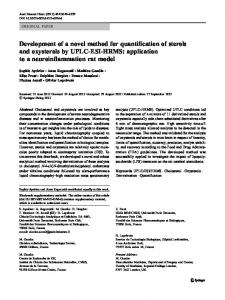
Fig. 4. Influence of the amount of primary secondary amine (PSA) on the peak areas of ionophore coccidiostats and valnemulin from extracted blanks of piglet feed (spiking at 20 ng mL−1 with a standard mixture).
3.2. Optimization of clean-up conditions Originally, SPE cartridges (C-18ec and HLB) were tested to improve clean-up conditions of extracts; however, recoveries were not as good as expected (data not shown). The mean recovery of the clean up (for 29 antibiotics) was 61% for both cartridges, with a minimum of 0% (monensin and narasin) for C-18 and HLB, and a maximum of 112% (penicillin V) and 119% (florfenicol) for C-18 and HLB, respectively. The tested C-18ec material retains the lipophilic molecules and HLB retains neutral polar and non-polar compounds, whereas SiO2 and florisil retain rather highly hydrophilic compounds (i.e. undesirable components from the matrix). The use of PSA (pKa1 = 10.1; pKa2 = 10.9) was inspired by the QUEChERS method, for removing sugars and fatty acids from fruits, vegetables, and cereals [53,54]. The principle of the QUEChERS’s method relies on a sample clean up using various d-SPE sorbents, including PSA, GCB (Graphitized Carbon Black), or C18 , as well as MgSO4 for the elimination of residual water prior to GC/MS analysis. To reduce matrix interferences, we have chosen to adapt the QuEChERS method for our extracts. Using this approach, the extract was directly transferred into a polypropylene tube containing 300 mg of sorbent (silica, florisil, or PSA). Among the sorbents tested in the present investigation, only PSA provided acceptable results (data not shown) with a mean recovery of 68% (21–85%, min–max) for all analytes, whereas a mean recovery of 47% (0–100%, min–max) and 67% (0–101%, min–max) was found for florisil and silica, respectively. For the latter sorbents, recovery was 0% for the ionophore coccidiostats due to a high matrix effect. Ionophores disappeared from the chromatograms when all sorbents were used, except for PSA. Fig. 4 clearly shows the high increase of the peak areas for valnemulin and ionophores with increasing amounts of PSA (0, 125, 250 and 500 mg), whereas the area of the other compounds remained nearly the same. An exception was observed for the tetracyline and penicillin yields, which decreased with increasing amounts of PSA material, possibly due to high ionic interactions, a behaviour that has already been reported for -lactams [30]. According to these results, a compromise was achieved with 250 mg of PSA for 5 mL of extract. However, it was noticed that ionophores were still inhibited when formic acid (1%) was added to the solvent extraction, even when applying the PSA clean up, indicating that for a pH close to 2, the undesirable compounds were present in neutral or cationic form, whereas at pH close to 4.5, these molecules can be expected to be present in anionic form and therefore able to bind to PSA.
The specificity was determined by analyzing 10 individual blank samples of the same piglet feed. Interfering substances which could interact with the quantification of antibiotics were not detected. In order to assess linearity of matrix-matched calibration (i.e. spiked matrices), linear regression coefficients (r2 ) values were calculated (Table 3). The function was found to be linear with r2 higher than 0.98 in the tested ranges. As can be seen in Table 3, the detection method was relatively sensitive, and our limits of quantification were well in the area compared to those reported for feedingstuffs and in accordance with the MRLs required by European regulations [10]. Vincent et al. [24] reported LOQs for ionophore coccidiostats of 9, 46, 10, 7 and 23 ng g−1 in poultry feed, and 26, 17, 4, 16 and 19 ng g−1 in cattle feed for lasalocid, maduramycin, monensin, narasin and salinomycin, respectively, and these values were close to the ones obtained in the present investigation for piglet feed: 10.0, 18.0, 5.0, 4.3 and 4.2 ng g−1 . In comparison, Pecorelli et al. [34] have reported higher LOD values of 13 quinolones from feedingstuffs ranging from 400 to 1500 ng g−1 by LC–UV/Vis diode array detector and LC-fluorescence, which could be explained by the much lower sensitivity of the optical detectors used compared to MS/MS. A LOQ of 125 g g−1 for amoxicillin in a commercial medical feed product was reported using LC–MS/MS [27], being about five times higher than in the present study. Results summarized in Table 3 show that recoveries for most of the compounds tested in the present investigation were generally above 70%, and RSDs were below 16%, with the exception of bacitracin (RSD of 18.6%) at highest spiking level of 300 ng g−1 . Recoveries for ciprofloxacin and amoxicillin were slightly lower (varying between 64% and 83%), whereas recoveries of tetracyclines and robenidine were considerably lower and varied from 45% to 63%. The low yields of robenidine may be explained by the high water content (25%) of the extraction solvent, reducing the extraction capacity of this relatively apolar compound. In general, high recoveries for anticoccidials have been reported after extraction with organic solvents, e.g. robenidine recovery from eggs and feed were around 100% following extraction with 100% acetonitrile or methanol [55,56]. Wilga et al. [25] have reported a good yield of 85% for robenidine from poultry feed using MeOH containing 1% acetic acid. The loss of tetracyclines could be explained by ionic or dipole interactions of two ketone groups with the residual silanol groups. However, in total, 75% of the target compounds presented recoveries between 80% and 110%, which is in compliance with the Commission Decision 2002/657/EC [11]. 3.4. Method application for bovine and lamb feedingstuffs Three blanks, i.e. unspiked extracts of bovine and lamb feedingstuffs were analyzed to confirm the specificity of the method. No interference was detected around the specific retention times of all analytes. Blank extracts of these feeds were spiked with the same standard mixture of antibiotics; however, the peak areas of the majority of analytes were found to be strongly different between the three feeds (bovine, lamb and piglet feeds), indicating a high matrix effect resulting either in signal suppression (1, Table 4).
A. Boscher et al. / J. Chromatogr. A 1217 (2010) 6394–6404
6401
Table 3 Evaluation of quantification limits, recoveries, and relative standard deviations (RSDs) of veterinary drugs in piglet feed at three levels of spiking carried out on three different days. Family
Antibiotic
Linear range (ng mL−1 )
r2 (n = 5)
LOQ (ng g−1 )
Spiking level (ng g−1 )
Within-day recovery (%)a
Within-day repeatability (RSD%)
Between-day recovery (%)b
Reproducibility (RSD%)
Diaminopyrimidines
Trimethoprim
0–40
0.996
6.7
Ionophores coccidiostats
Flavophospholipol
0–120
0.996
63.3
Lasalocid
0–80
0.998
10.0
Maduramycin
0–40
0.990
18.0
Monensin
0–40
0.998
5.0
Narasin
0–40
0.998
4.3
Robenidine
0–40
0.999
3.8
Salinomycin
0–40
0.997
4.2
Lincosamides
Lincomycin
0–40
0.997
3.8
Macrolides
Spiramycin
0–40
0.997
4.9
Tilmocosin
0–40
0.995
6.5
Tylosin
0–40
0.998
5.1
Amoxicillin
0–40
0.997
23.2
Penicillin G
0–40
0.996
12.3
Penicillin V
0–40
0.997
13.7
Chloramphenicol
0–40
0.997
15.0
Florfenicol
0–40
0.993
21.8
Pleurotumilins
Valnemulin
0–40
0.999
5.9
Polypeptides
Bacitracin
0–160
0.996
65.0
Quinolones
Nalidixic acid
0–40
0.997
6.1
Oxolinic acid
0–40
0.998
7.4
Ciprofloxacin
0–40
0.996
14.8
Danofloxacin
0–40
0.994
9.0
14 40 75 120 160 300 20 80 150 36 40 75 10 40 75 9 40 75 8 40 75 9 40 75 8 40 75 10 40 75 13 40 75 10 40 75 47 80 150 80 25 40 75 28 40 75 30 40 75 30 40 75 12 40 75 80 160 300 13 40 75 15 40 75 30 40 75 18 40 75
86 91.0 87.1 76 84 61 70 100.8 99 83 93 92 80 106 97.1 79 110 95 58.4 55.0 51.5 84.5 106.2 98.1 97 100.3 100.0 97.4 104.1 96 95 116 103 97 106 102 80.6 75.2 64 82 98 90.1 83 97 93.9 81 95 111 91.1. 114 93 89 87 103 89.7 64 87 69 95 97.6 90.3 88 101.1 87.7 72.7 68.8 66.5 92 101 79.6
8.6 1.5 3.7 12.3 7.4 11.3 9.2 4.5 9.0 6.6 5.1 8.4 10.4 5.4 4.0 7.6 5.3 5.4 4.1 3.6 4.8 2.8 3.3 4.9 7.1 1.8 4.5 5.0 4.2 5.9 7.4 7.3 6.6 7.9 5.6 5.9 11.3 4.4 7.1 9.6 8.4 3.2 11.8 15.1 4.6 13.4 7.5 5.7 4.6 13.8 13.9 5.3 6.2 6.0 4.9 8.0 13.2 10.9 7.4 3.2 4.4 8.6 4.4 4.0 4.4 3.6 2.3 11.2 7.1 1.9
87.9 91.7 95 68 72 73 nd 91 100 90 96.4 100 92 101 97.0 89 100 95.6 62 51.9 57 91 99 98.0 93 97.5 98 97 102.4 96.3 98 109 103 88 99 97.6 82 81 70 83 100.7 94.7 89 80 96 87 98.1 105 102 99 90.8 95 88.8 94 93.9 79 78 89 100.2 93.6 93.4 95 96 92.0 70.2 66.7 75 85 83 86
3.4 2.4 9.5 11.8 11.4 12.5 nd 8.9 5.2 11.5 3.7 8.1 12.8 6.0 1.6 12.0 8.5 2.5 12.7 3.7 11.7 11.8 6.2 3.2 7.8 2.8 6.8 8.6 3.9 3.2 9.9 7.4 5.7 8.1 6.8 4.6 13.1 6.0 9.4 12.2 2.4 4.0 9.7 14.5 5.9 12.2 3.9 8.6 9.7 14.5 3.8 11.0 2.0 7.8 4.6 14.5 7.9 18.6 5.0 3.5 2.8 6.8 6.6 3.7 3.1 2.0 7.0 13.9 14.9 6.1
Penicillins
Amoxicillin 13 C3
Phenicols
6402
A. Boscher et al. / J. Chromatogr. A 1217 (2010) 6394–6404
Table 3 (Continued) Antibiotic
Linear range (ng mL−1 )
r2 (n = 5)
LOQ (ng g−1 )
Spiking level (ng g−1 )
Within-day recovery (%)a
Within-day repeatability (RSD%)
Between-day recovery (%)b
Reproducibility (RSD%)
Enrofloxacin
0–40
0.996
4.4
Flumequine
0–40
0.998
7.5
Marbofloxacin
0–40
0.997
4.8
Carbadox
0–40
0.995
6.6
Olaquindox
0–40
0.994
8.3
Streptogramins
Virginiamycin
0–40
0.998
20.6
Sulfonamides
Sulfadiazin
0–40
0.998
5.3
Tetracycline
Doxycycline
0–40
0.994
8.8
Oxytetracycline
0–40
0.993
9.4
Tetracycline
0–40
0.997
9.1
10 40 75 15 40 75 10 40 75 14 40 75 18 40 75 30 40 75 11 40 75 20 40 75 20 40 75 20 40 75 40
90 90.7 85.7 85 91.5 89.3 98 90 85 104 92.4 86.3 98.9 96 89.4 93 94 100 86.9 91.2 88.1 57 74.9 61 59 56.1 53 64 57 51.3 57
10.1 4.9 3.4 6.0 2.9 3.5 12.6 5.2 7.5 8.1 4.3 3.6 2.8 5.5 3.8 14.2 10.8 13.4 4.5 1.5 2.6 11.3 4.8 7.5 9.5 3.3 4.5 7.9 5.5 3.8 6.6
88.4 85.4 90 94 92.7 92.2 91 84 88 99.2 92.0 94 96.4 91 92.5 82 105 100.0 97 85 91.3 56 63 63 51 53.5 59 52 53.9 58 63
1.6 4.7 7.9 9.2 4.1 2.5 5.8 5.6 5.7 4.4 3.8 10.3 2.6 7.4 4.4 10.1 15.9 0.7 13.6 6.8 5.0 5.7 10.5 10.4 9.0 3.0 8.8 11.1 2.6 5.8 5.8
86 92 84
14.0 15.4 15.3
85 89 86
14.3 13.6 12.9
Family
Quinoxalines
TCd6 Mean for all analytes
Spiking 1 Spiking 2 Spiking 3
nd, not determined. a Recovery based on 1 day, n = 6. b Recovery based on 3 days and six measurements for each day, n = 3.
Fig. 5. Example of the standard addition method employed for robenidine in three matrices, spiked prior to extraction with 80, 160, and 240 L of a standard mixture to a sample already spiked with 40 ng g−1 (final concentration of 5.3 ng mL−1 ). Analyte concentration was obtained by the equation y = ax + b, and for y = 0; x = −b/a. Then, [robenidine]0 = 5.1, 5.9 and 5.5 ng mL−1 in piglet, bovine and lamb feeds, respectively.
In addition, the recoveries obtained with the different matrices (bovine and lamb feeds) are presented in Table 4. The recoveries of the fluoroquinolone (ciprofloxacin, danofloxacin, enrofloxacine, and marbofloxacin) and tetracycline families in porcine and lamb feed were both found inferior (20% on average) compared to the piglet feed. For the other families, no major differences were detected as a function of the matrix. These results highlight the two main problems associated with the matrix, i.e. the recovery and the signal variation. Therefore, the standard addition method (SA) should be applied to compensate matrix effects on the signal variation during detection, either by performing SA after the extraction and to determine true recovery, or prior to extraction to account for both varying recovery and signal effects. The linear regression coefficients obtained in the SA method were generally considered as good (r2 > 0.98). Recoveries presented in Table 4 were relatively similar between external calibration and standard addition for the majority of compounds. Main differences were observed for maduramycin, monensin, valnemulin, bacitracin and oxytetracycline in the lamb feed, where recoveries were found to be lower for the standard addition method (up to 46% for monensin). In order to obtain high and comparable recoveries for each feed, it is recommended to apply the standard addition directly on the matrix, i.e. prior to the extraction step. The example presented in Fig. 5 shows clearly that, in spite of the matrix effect observed for robenidine, an accurate concentration and good recoveries can be obtained by employing SA, and the mean recoveries (n = 3 matrices) calculated for antibiotics ranged from 88 ± 10.8% for bacitracin to 113 ± 5.4% for carbadox.
A. Boscher et al. / J. Chromatogr. A 1217 (2010) 6394–6404
6403
Table 4 Recovery of antibiotics from bovine and lamb feeds spiked at 40 ng g−1 with veterinary drugs using external calibration and standard addition, and signal suppression being evaluated in piglet, bovine and lamb feedingstuffs. Antibiotic
% Recoveries (RSD)a
Signal suppressionb
Bovine feed c
Trimethoprim Flavophospholipole Lasalocidf Maduramycin Monensin Narasin Robenidine Salinomycin Lincomycin Spiramycin Tilmocosin Tylosin Amoxicillinf Penicillin G Penicillin V Chloramphenicol Florfenicol Valnemulin Bacitracine Nalidixic acid Oxolinic acid Ciprofloxacin Danofloxacin Enrofloxacin Flumequine Marbofloxacin Carbadox Olaquindox Virginiamycin Sulfadiazin Doxycycline Oxytetracycline Tetracycline Mean of recoveries for all analytes a b c d e f
Lamb feed d
c
ESM
SAM
ESM
SAM
81.2 (3.7) 62 (5.6) 77 (15.6) 76.6 (1.2) 80.0 (3.4) 62.5 (2.0) 37.1 (2.7) 68.3 (3.7) 83.7 (3.9) 66.9 (4.1) 80 (8.8) 75 (5.3) 61.8 (3.0) 88 (10.4) 78 (9.6) 100 (6.8) 96.5 (3.7) 72.9 (3.9) 82 (5.6) 81.5 (3.8) 79 (8.5) 46.6 (2.6) 58.3 (2.5) 66.5 (4.1) 79.8 (3.4) 65 (9.0) 78 (5.3) 79 (8.7) 77.9 (17.9) 75 (10.7) 42.7 (4.0) 37.1 (3.7) 39.8 (4.2)
88.9 69.7 101.1 73.5 99.1 60.3 22.9 65.1 90.0 69.7 60.2 72.9 53.7 83.0 57.2 105.1 122.6 91.4 85.0 75.4 87.4 53.3 70.9 66.1 81.1 59.3 83.4 74.7 120.9 80.8 62.5 27.5 37.6
89 (9.4) 57 (6.5) 68 (16.4) 95 (10.3) 90.8 (4.6) 94 (5.2) 44.2 (1.4) 94 (5.8) 95.5 (4.9) 88 (6.6) 106 (8.4) 87.4 (4.3) 75 (6.1) 94 (7.0) 91.5 (4.5) 91 (6.6) 85 (6.1) 83.6 (6.7) 87 (11.1) 78.3 (3.0) 88.7 (4.4) 50.5 (3.6) 64.3 (3.9) 73 (5.4) 78.6 (3.0) 69.7 (3.3) 86 (6.7) 91.6 (3.1) 80.9 (4.1) 87.2 (2.7) 38.1 (2.7) 30.7 (1.3) 33.7 (1.7)
77.6 55.8 92.5 66.4 54.2 112.6 35.6 92.3 101.4 90.5 102.4 91.2 73.7 109.3 87.8 107.0 110.9 49.8 51.2 81.5 84.9 49.4 64.3 58.8 75.8 62.4 106.0 114.4 62.9 87.0 33.0 14.7 26.4
71 (15.1)
80 (23.0)
Piglet feed
Bovine feed
Lamb feed
0.27 0.40 0.81 0.52 1.09 1.56 0.64 1.43 0.70 0.99 2.17 0.81 0.48 0.52 0.51 0.26 0.34 0.5 0.81 0.43 0.34 1.3 1.92 1.63 0.52 1.09 0.34 0.19 0.48 0.38 1.90 2.98 2.63
0.19 0.54 0.83 1.55 1.24 1.75 0.62 1.45 0.46 0.59 2.23 0.49 0.12 0.24 0.12 0.45 0.67 0.47 0.99 0.33 0.27 0.87 1.13 1.07 0.41 0.68 0.26 0.13 0.16 0.28 1.09 2.17 1.66
0.26 0.66 0.57 1.18 0.77 1.17 0.73 0.96 0.66 0.72 2.13 1.03 0.35 0.74 0.57 0.43 0.44 0.59 0.94 0.50 0.39 1.18 2.07 1.31 0.61 1.02 0.38 0.18 0.76 0.30 1.75 2.82 2.36
d
78 (19.5)
70 (25.7)
Relative standard deviation. Signal suppression: peak area ratio of analyte response from spiked blank matrix extract to the equal concentration of analyte in water/MeOH (90/10; v/v), n = 2. External standard method (n = 6). Standard addition method (n = 1). Spiking at 160 ng g−1 . Spiking at 80 ng g−1 .
4. Conclusion
Acknowledgements
In this work, a relatively simple, reproducible and sensitive method was developed for the quantification of a large range of veterinary drugs in feedingstuffs, covering a wide diversity of polarities and pKa values. The method employs ultrasonic-assisted extraction combined with dispersive solid-phase extraction and HPLC–ESI-MS/MS detection. However, as matrix effects were detected and could impact the accuracy of the method, simple quantification based on a single sample is predominantly recommended for screening, while for accurate results quantification based on standard addition is recommended, with the advantage of avoiding matrix effects resulting in varying recoveries and in signal suppression. Nevertheless, as a number of additional extractions would then be needed (four times as many than a method based solely on external calibration), this final method is more time-consuming. The developed method will nevertheless be helpful for the monitoring process of veterinary drugs and represents one of the rare published HPLC-MS/MS methods for the simultaneous detection of multiple classes of antibiotics from feedingstuffs employing a single extraction procedure.
This work was supported by the ASTA (Administration des Services Techniques de l’Agriculture in Luxembourg). We wish to express our sincere thanks to Mr. Navette from Versis for providing the feedingstuff samples, and Boris Untereiner for this contribution to the experiments. Appendix A. Supplementary data Supplementary data associated with this article can be found, in the online version, at doi:10.1016/j.chroma.2010.08.024. References [1] M. Becker, E. Zittlau, M. Petz, Anal. Chim. Acta 520 (2004) 19. [2] H. Berrada, F. Borrull, G. Font, R.M. Marcé, J. Chromatogr. A 1208 (2008) 83. [3] S. Bogialli, C. Ciampanella, R. Curini, A. Di Corcia, A. Laganà, J. Chromatogr. A 1216 (2009) 6810. [4] V. Carretero, C. Blasco, Y. Picó, J. Chromatogr. A 1209 (2008) 162. [5] M.P. Hermo, E. Nemutlu, S. Kir, D. Barrón, J. Barbosa, Anal. Chim. Acta 613 (2008) 98. [6] R.H. Gustafson, R.E. Bowen, J. Appl. Microbiol. 83 (1997) 531. [7] B. Hardy, Anim. Biotechnol. 13 (2002) 129.
6404
A. Boscher et al. / J. Chromatogr. A 1217 (2010) 6394–6404
[8] K.N. Woodward, J. Vet. Pharmacol. Therap. 28 (2005) 171. [9] Commission Regulation 378/2005/EC of 5th March amending Regulation 1831/2003/EC on additives for use in animal nutrition, European Union, Brussels, 2005. [10] Council Regulation 2377/90/EC of 26 June 1990 laying down a Community procedure for the establishment of maximum residue limits of veterinary medicinal products in foodstuffs of animal origin, Brussels, Belgium, 1990. [11] Commission Decision 2002/657/EC implementing Council Directive 96/23/EC concerning the performance of analytical methods and interpretation of results, European Union, Brussels, 2002. [12] J. Chico, A. Rúbies, F. Centrich, R. Companyó, M.D. Prat, M. Granados, J. Chromatogr. A 1213 (2008) 189. [13] K. Granelli, C. Branzell, Anal. Chim. Acta 586 (2007) 289. [14] K. Granelli, C. Elgerud, A. Lundström, A. Ohlsson, P. Sjöberg, Anal. Chim. Acta 637 (2009) 87. [15] A. Kaufmann, P. Butcher, K. Maden, M. Widmer, J. Chromatogr. A 1194 (2008) 66. [16] A.A.M. Stolker, U.A.T. Brinkman, J. Chromatogr. A 1067 (2005) 15. [17] M.J. Schneider, K. Mastovska, S.J. Lehotay, A.R. Lightfield, B. Kinsella, C.E. Shultz, Anal. Chim. Acta 637 (2009) 290. [18] R. Yamada, M. Kozono, T. Ohmori, F. Morimatsu, M. Kitayama, Biosci. Biotechnol. Biochem. 70 (2006) 54. [19] C. Van Poucke, K. De Keyser, A. Baltusnikiene, J.D.G. McEvoy, C. Van Peteghem, Anal. Chim. Acta 483 (2003) 99. [20] E. Chéneau, J. Henri, Y. Pirotais, J.P. Abjean, B. Roudaut, P. Sanders, M. Laurentie, J. Chromatogr. B Analyt. Technol. Biomed. Life Sci. 850 (2007) 15. [21] L. Mortier, E. Daeseleire, C. Van Peteghem, J. Chromatogr. B Analyt. Technol. Biomed. Life Sci. 820 (2005) 261. [22] M. Olejnik, T. Szprengier-Juszkiewicz, P. Jedziniak, J. Chromatogr. A 1216 (2009) 8141. [23] S.B. Turnipseed, J.E. Roybal, A.P. Pfenning, S.A. Gonzales, J.A. Hurlbut, M.R. Madson, J. AOAC Int. 84 (2001) 640. [24] U. Vincent, M. Chedin, S. Yasar, C. von Holst, J. Pharm. Biomed. Anal. 47 (2008) 750. [25] J. Wilga, A.K. Wasik, J. Namieœnik, Talanta 73 (2007) 812. ˜ J.L. Urraca, M.C. Moreno-Bondi, J. Pharm. Biomed. Anal. 49 [26] E. Benito-Pena, (2009) 289. [27] S. De Baere, P. De Backer, Anal. Chim. Acta 586 (2007) 319. [28] T. Goto, Y. Ito, S. Yamada, H. Matsumoto, H. Oka, J. Chromatogr. A 1100 (2005) 193. [29] S.H. Hsieh, H.Y. Huang, S. Lee, J. Chromatogr. A 1216 (2009) 7186.
[30] K. Mastovska, A.R. Lightfield, J. Chromatogr. A 1202 (2008) 118. [31] M. Hansen, E. Björklund, K.A. Krogh, B. Halling-Sørensen, TrAC - Trends Anal. Chem. 28 (2009) 521. [32] H.G. Mol, P. Plaza-Bolanos, P. Zomer, T.C. de Rijk, A.A. Stolker, P.P. Mulder, Anal. Chem. 80 (2008) 9450. [33] A.M. Jacobsen, B. Halling-Sørensen, F. Ingerslev, S.H. Hansen, J. Chromatogr. A 1038 (2004) 157. [34] I. Pecorelli, R. Galarini, R. Bibi, A. Floridi, E. Casciarri, A. Floridi, Anal. Chim. Acta 483 (2003) 81. [35] Y.A. Hammel, R. Mohamed, E. Gremaud, M.H. LeBreton, P.A. Guy, J. Chromatogr. A 1177 (2008) 58. [36] M. McDonald, C. Mannion, P. Rafter, J. Chromatogr. A 1216 (2009) 8110. [37] D.W.M. Sin, C. Ho, Y.C. Wong, S.K. Ho, A.C.B. Ip, Anal. Chim. Acta 517 (2004) 39. [38] S. Zhang, Z. Liu, X. Guo, L. Cheng, Z. Wang, J. Shen, J. Chromatogr. B Analyt. Technol. Biomed. Life Sci. 875 (2008) 399. [39] Y. Ito, T. Goto, H. Oka, H. Matsumoto, K. Takeba, J. Chromatogr. A 1042 (2004) 107. [40] A. Kaufmann, P. Butcher, Rapid Commun. Mass Spectrom. 19 (2005) 3694. [41] M. Anastassiades, S.J. Lehotay, J. AOAC Int. 86 (2003) 412. [42] G. Kesiunaite, E. Naujalis, A. Padarauskas, J. Chromatogr. A 1209 (2008) 83. [43] C. Pan, H. Zhang, S. Chen, Y. Xu, S. Jiang, Acta Chromatogr. 17 (2006) 320. [44] G. Stubbings, T. Bigwood, Anal. Chim. Acta 637 (2009) 68. [45] AFNOR XP T 90-2, Essais des eaux. Protocole d’évaluation d’une méthode alternative d’analyse physico-chimique quantitative par rapport à une méthode de référence, Association Franc¸aise de Normalisation 1999. [46] J.N. Miller, J.C. Miller, Statistics and Chemometrics for Analytical Chemistry, fifth ed., Pearson Education Limited, Harlow, 2005. [47] C.R. Anderson, H.S. Rupp, W.H. Wu, J. Chromatogr. A 1075 (2005) 23. [48] H. Oka, Y. Ito, H. Matsumoto, J. Chromatogr. A 882 (2000) 109. [49] A.F. Forti, G. Campana, A. Simonella, M. Multari, G. Scortichini, Anal. Chim. Acta 529 (2005) 257. [50] H.T. Ronning, K. Einarsen, T.N. Asp, J. Chromatogr. A 1118 (2006) 226. [51] J. Wang, D. Leung, Rapid Commun. Mass Spectrom. 21 (2007) 3213. [52] H.C. Higgins, J.D.G. McEvoy, Food Addit. Contam. 19 (2002) 819. [53] Y. He, Y.H. Liu, Chromatographia 65 (2007) 581. [54] O. Shimelis, Y. Yang, K. Stenerson, T. Kaneko, M. Ye, J. Chromatogr. A 1165 (2007) 18. [55] E. Dubreil-Chéneau, M. Bessiral, B. Roudaut, E. Verdon, P. Sanders, J. Chromatogr. A 1216 (2009) 8149. [56] L. Mortier, E. Daeseleire, C. Van Peteghem, Rapid Commun. Mass Spectrom. 19 (2005) 533.