(ERA)/Prony portable software tool and its use to perform ... acquisition and signal analysis software, SCOPEVIEW. This use ... tool in commercially available software such as ..... Available:http://www.transmission.bpa.gov/business/operations.
The 11th International Conference on Information Sciences, Signal Processing and their Applications: Special Sessions
DEVELOPMENT OF A PORTABLE SOFTWARE TOOL FOR TIME DOMAIN MODAL ANALYSIS Mathieu Perron*, Innocent Kamwa*, Louis-A. Dessaint** *Institut de Recherche d’Hydro-Québec, **École de Technologie Supérieure
ABSTRACT Estimation of dynamic behaviors in power systems is a key feature for low-frequency oscillations characterization in wide-area monitoring and control systems (WAMS, WACS). This paper presents the development of an eigensystem realization algorithm (ERA)/Prony portable software tool and its use to perform robust modal analysis in a single-input-singleoutput (SISO) measurement-based context. The algorithm is developed using C language and open source libraries to minimize portability issues. The performance of the proposed algorithm on discrete-time signals is evaluated through field measurement data analysis, and then by a comparison with rotational invariance (ESPRIT) techniques. Index Terms— Modal analysis, power systems identification, power systems dynamics, eigensystem realization algorithm (ERA), prony analysis. 1. INTRODUCTION
M
ODAL analysis is widely used as a technique to characterize power systems’ dynamic behaviour and increase their stability. Study of low-frequency phenomena offers a broad range of wide-area applications including monitoring, optimized tuning of operational characteristics or design of dynamic security systems. Traditionally, model-based methods [1, 2] were used for eigenvalue analysis on complete or partial models of power systems. However, the modeling issues of present-day networks and the demand for real-time wide-area control technology have established needs for more convenient measurement-based methods. Thus, in recent years, methods addressing this growing demand have been thoroughly documented [3]-[19]. Following a breakthrough in parametric approach based on Prony analysis [3], reduced-order black-box modeling methods started to emerge [4]-[12], [14]-[15], [19]. Among those methods, the one using the ERA [4]-[8] are pulseresponse and ringdown based, whereas the numerical
978-1-4673-0382-8/12/$31.00 ©2012 IEEE
1371
subspace state-space system identification (N4SID) methods [9]-[12] respond to probing and ambient data, offering the option of cross-validation with field tests. Most N4SID methods employ stochastic, blockprocessing approaches as proposed in [13]. Similarly, mode shape methods [14]-[15] were designed to emphasize the estimation and physical pattern of oscillatory mode across the grid. Alternatively, recursive methods based on least square estimation [16]-[17] have also been explored. Reference [18] presents the use of Hilbert transform and empirical mode identification (EMD) in power system analysis. More recently, a Teager-Kaiser energy operator with linear filter decomposition method [19] was proposed for early detection of power systems dynamics using an ERAbased multi-band modal analysis (MBMA) optimized scheme. Whereas most of these methods address the problem of precisely estimating the dynamic behaviour of power systems, few of them offer an open source solution free of simulation software with embedded linear algebra functionality. This paper deals with a portable software tool developed for time-response modal analysis based on a joint ERA/Prony algorithm, according to the work in [4][8]. The main purpose of this software tool is to provide a robust and fast way to compute and estimate the dynamic parameters of discrete-time signals on a variety of Ccompliant platform, without legal or third-party software dependencies. The ERA/Prony algorithm is detailed, based on the relation between the analyzed measurement and the pulse-response of the ERA model. Thus, a statespace model of reduced-order is realized by singular value decomposition (SVD) of a Hankel block matrix. Later, Prony parameters of the system are estimated from eingenvalue decomposition of the state and residue matrices of the measurement-based model. The software features are specified and two study cases show the validity of the method. Studied cases include the analysis of sampled data from Hydro-Québec’s network following a loss of synchronization between LG-4 and Boucherville substations, and a comparison exercise with ESPRITbased methods on real-time probing test data obtained
n (0) U V H H n n n
from the Western Electricity Coordinating Council (WECC) network. The studies were carried out by importing the product into Hydro-Québec’s data acquisition and signal analysis software, SCOPEVIEW. This use demonstrates the portability aspect of the product and moreover gives access to a modal analysis tool in commercially available software such as HYPERSIM and EMTP-RV.
(5)
1
1
n (1) (U 2 ) F ( 2V H ) H n n n n n
(6)
leading to the system identification [5]: Fn ( n
1
2
n (1)(V 1 2 ) U nH )H n n
(7)
1
(8)
G n ( n 2V n H )
2. SYSTEM IDENTIFICATION
1
(9)
Pn (U n n 2 )
This section is devoted to the state-space reduced-order model identification, using ERA on a sampled measurement y sp ( k ) . This modeling approach is justified
3. PARAMETER ESTIMATION
through two main hypotheses. First, the analyzed signal is presumed as the impulse-response of the identified black-box model. The second hypothesis considered this state-space model to reproduce the power system’s dynamic characteristics through the state-vector transformation of the similarity translation lemma [7]: x (t ) ( M 1 AM ) x (t ) ( M 1 B)u (t )
(1)
y (t ) ( MC ) x (t ) Du (t )
This section is a review of dynamic parameters estimation using a Prony approach on state-space system through eigenvalues and residual terms calculation. The proposed method presumes that any measurement signal always produces distinct eigenvalues from its system decomposition. This hypothesis can be verified from practical observations [7], where theoretical multi-pole problems never occur. 3.1.
Prony approach
where M ( n n ) is regular and invertible for distinct eigenvalues of A, and x M 1 x . This transformation shows an unchanged input to output relation and therefore justifies the search for a reduced-order realization under those mathematical restrictions.
The parameter estimation method used in this paper is based on the Prony approach to oscillatory signal as a summation of sines with independent dynamic characteristic generalized by:
2.1.
y (t )
System’s equations
n
a e k 1
k
kt
cos k t k
(10)
The system’s dynamic behaviour is described by the following continuous and discrete state-space equations:
3.2.
x ( t ) An x ( t ) B n u ( t ) x ( k 1) Fn x ( k ) G n u ( k ) (2) y ( t ) C x ( t ) n y ( k ) Pn x ( k )
Dynamic parameters estimation requires the system’s equations (2) to be replaced by their Laplace transform and residual matrix form using the inverse impulseresponse matrix [1]:
where the reduced-order of the SISO realization is n. The ERA algorithm is based on Hankel matrices using sampled data y sp ( k ) and Markov parameters for [5, 20]: ysp (k 1) ysp (k ) y (k 1) ysp (k 2) (k 1) sp H ) y ( k 1) y ( k sp sp PFG 2 (1) PF G H PF G
PF 2 G PF 3 G
PF 1G
y ( s ) C n sI An B n u ( s ) 1
ysp (k 1) (3) ysp (k 2)
PF G F 1 PF G
therefore, with SVD decomposition, determination and orthogonality [5, 7, 21]:
System’s equations, and residual terms
(4)
Rk
k 1
k
(11)
where R k is the residue matrix associated with mode k leading to [1]: 1 C n k kH B n (12) R k s k C n sI An B n s k
from eigendecomposition of An according to [1]: An k k k , k An k k
n-order
n
s
(13)
With the eigendecomposition and the residue matrix form, (11) is factorized for complex and real eigenvalues and their associated residual terms, finally leading to a
1372
contains 10 arguments in reference to signal properties and analysis characteristics, which are listed as follow:
rewriting of (10): n l
n l
i 2 j j R 2 (14) R R y ( s) s s j s j i 1 j 1 j 1 i j j j j l
n2 l l i k t y ( k ) j e j k t cos k t (15) Rie 2 R j j sp j 1 i 1
amod(y, ndata, t_ech, f_low, f_high, alim, zlim, trig, mod_order, filter); - double *y: The analyzed signal y sp ( k ) .
where y sp ( k ) is the estimated reconstitution of the original sampled signal y sp ( k ) . From (10) and (15), the
k
2 k
2 k
0 k 100%
(17)
Calculation of the amplitude, damping, frequency, phase angle and damping ratio of each identified dynamic behaviour. Production of an estimated signal y sp ( k ) from the identified dynamic parameters for graphic comparison to y sp ( k ) .
-
-
double f_low: Lowest frequency display limit. double f_high: Highest frequency display limit. double alim: Proportional amplitude limit between highest and lowest displayed modes. double zlim: Highest damping ratio display limit. double trig: Triggering time of analysis. int mod_order: The order of the ERA realization. Depending on the settled value, the n-order is either algorithmically or manually fixed. int filter: This optional argument defines the type of numerical filter applied to the reconstitution of y sp ( k ) .
-
This section presents a brief overview of the developed software tool based on the ERA/Prony methodology as discussed in sections 2 and 3. The product’s main functions and specifications are:
-
double t_ech: The sampling time of y sp ( k ) .
(16)
4. SOFTWARE DEVELOPMENT
-
-
-
The damping ratio term k is calculated, providing independent-frequency mode comparison [1]:
k
int ndata: The number of sample in y sp ( k ) .
-
amplitude a k , damping k , frequency k and phase angle k of each complex mode can be determined by: j ; ; ; arg R j ak 2 * R k j k j k
-
User selection of studied frequency bandwidth between 0,05Hz and 60Hz. Allowing total portability without legal or software limitations.
Following the call to amod(), the measurement data are automatically preprocessed prior to modal analysis. This preprocessing evaluates the optimum down-sampling rate and Hankel matrix order, based on practical observations and Nyquist criteria. This process is designed to provide the best trade-off between noise reduction, computational time, and dynamic content estimation in the specified frequency range. The portability aspect of the modal analysis tool is ensured by the use of open source libraries such as cLAPACK, and LogPack [22], and code conformity to AINSI C standards. Multi-platform compatibility is available on Windows, Linux, and Sun systems through standard Gnu C Compiler (GCC), and the product can be updated for 64-bit architecture. The source code is also protected against memory leaks and overflow with the aid of IBM’s PURIFY software. 5. APPLICATIONS This section contains two applications of modal analysis using the portable software tool described in section 4. The proposed applications are related to dynamic stability studies in electrical networks with special regards to ringdown and ambient data analysis. The measurement data collected for the two study cases come from realtime sampling on actual networks. For each modal analysis case, the only available data were the analyzed signals and their sampling time.
The ERA/Prony algorithm is designed to perform complete modal analysis on any sampled signal, from any given source, under specific user conditions. The portable software tool is meant to be executed under a C language compatible host software with graphic display characteristics as the use of Hydro-Québec’s data acquisition and signal analysis software, SCOPEVIEW, demonstrates in section 5 of this paper. The modal analysis is launched from a call to the algorithm’s main function named amod(). This function
5.1.
Application 1: Hydro-Québec’s SMDA
The first application deals with ringdown data sampled from Hydro-Québec’s 735 kV network through the so-
1373
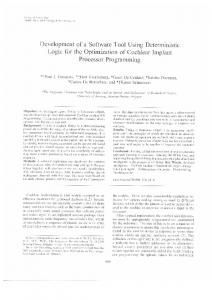
called angle shift measurement system (ASM-NET), better known in French as ‘système de mesure du décalage angulaire’ (SMDA). The use of the ERA/Prony algorithm on real-time sampled data with dense modal content is the main interest of this application. The SMDA system is a phasor measurement unit (PMU)-based wide-area monitoring system conceived as a centralized supervision tool of dynamic behaviour on the main 735 kV network [23]. The SMDA configuration as seen in Fig. 1 is composed of eight PMU carefully distributed on key busses around the grid (10 as of december 2011). These PMUs are linked to a GPS system synchronizing angles, frequencies, and harmonic distortion measurements with a precision of 1 μs. Those data are collected by a supervisory control and data acquisition (SCADA) system with a 60 Hz sampling rate. Finally, online processing is performed for GPS error correction and time reconciliation before the data is stored. The studied case concerns a ringdown phenomenon observed at Boucherville substation following a generator loss at LG-4 substation on March 2nd, 2006. The measured data is the relative angle at Boucherville. The SCOPEVIEW call to amod() is set to respect a frequency bandwidth limits of 0.05 Hz to 10 Hz with a damping ratio limit of 25 %. The sampling time in this case is 16.67 x 10⁻³ s, the modeling order is manually adjusted to n = 27, and the optional filter argument is settled to include null-frequencies and under-damped modes to the signal reconstitution, providing the best fitting results. 5.1.1 Results and discussion The modal analysis results of the relative angle oscillation are presented in Table 1, where the Prony parameters of each identified mode fitting the analysis conditions are listed. The associated signals are displayed in the two-graphs Fig. 2 where the estimated signal y ( k ) is superimposed on the original sampled data and sp
Table 1. Modal Analysis of SMDA Sampled Data. ak fk k k Mode 1 2 3 4 5
1.277 0.286 0.180 0.173 0.033
0.681 Hz 0.870 Hz 1.138 Hz 1.423 Hz 0.253 Hz
-57.62° -178.26° -59.10° 48.78° -155.13°
20 % 4.7 % 4.0 % 6.1 % 5.3 %
Figure 1. Hydro-Québec’s SMDA configuration.
their respective FFT are superimposed on the second graph. Despite the dense modal content, Fig. 2 shows a mean square error (MSE) of 0.042° between sampled and estimated signal, whereas FFT comparison demonstrates a close to exact fit, thus confirming the estimation of the dynamic parameters to be valid and robust. In this application the circumstances of the ringdown are unknown such that the modal analysis results become more of a hypothesis tool to further research. For instance, the observed data in Table 1 suggest that mode 2 to 4 might be considered of interest because of their substantial amplitude combined to a relatively low damping ratio. As for the major-mode 1 (0.681 Hz), its associated damping ratio of 20 % suggests that its effect on the overall dynamic stability of the system is under control. These observations would not be so obvious to formulate from the FFT analysis of Fig. 2 alone, confirming the usefulness of modal analysis on real sampled data cases with low sampling rate.
Figure 2. Signals and FFT of SMDA sampled data.
1374
5.2.
Table 2. Major-Mode Estimation on MALN-Round Mountain. k fk k Method
Application 2: WECC MALN-Round mountain probing test
The second application deals with ringdown and ambient measurements data sampled from the Western Electricity Coordinating Council (WECC) network. The use of the ERA/Prony algorithm on those data is presented as a comparison exercise with the ESPRIT-based modal analysis results presented in [17]. The comparative modal analysis methods are the TLS-ESPRIT and the improved fourth-order cumulant based 4CB-TLS-ESPRIT techniques. Basically, these recursive methods use the auto-correlation matrix instead of the Hankel matrix and are based upon a least-square estimation of parameters. They are normally used for their higher noise immunity at the cost of a slightly higher computational time. The analyzed data are obtained following the WECC real-time testing plan of September 14th, 2005 [24], which included dynamic break insertions, mid-level (±125 MW) single-mode square wave (SMSW) and lowlevel pseudo-random noise (LLPRN) probing test performed by HVDC modulation. The testing plan was divided in three time-windows corresponding to the first (20:10:11.993-20:10:20.526 UTC) and second (20:15:13.324-20:15:21.857 UTC) dynamic brake insertion of a 1400 MW load pulse of 0.5 s at Chief Joseph, and a pre-test ambient data sampling (20:00:03.333-20:00:11.866 UTC). For window 1 and 2, the estimated mode reported by the WECC in [25] for the North-South swing was at 0.318 Hz for an 8.3% damping ratio. This comparative application focuses on the modal analysis of the real power data from the MALN – Round Mountain 1 line for time-windows 1, and 3. In both cases the SCOPEVIEW call to amod() is set to respect a frequency bandwidth limit of 0.05 Hz to 10 Hz with a damping ratio limit of 25 %. The sampling time of the data is 33.3 x 10⁻³ s, and the modeling order are respectively adjusted to nW1 = 22, and nW3 = 35, providing the best fitting results.
TLS-ESPRIT 4CB-TLS-ESPRIT ERA/Prony TLS-ESPRIT 4CB-TLS-ESPRIT ERA/Prony
Window 1 Analysis -0.2818 0.3317 Hz 13.52 % -0.1326 0.3253 Hz 6.48 % -0.1147 0.3178 Hz 5.73 % Window 3 Analysis -0.0404 0.2927 Hz 2.19 % -0.0460 0.2982 Hz 2.45 % -0.0962 0.2852 Hz 5.36 %
Figure 3. Signals and FFT of ringdown analysis.
5.2.1 Results and discussion The modal analysis results for the major-mode of the power oscillations are provided in Table 2, where the three compared methods are listed for each analyzed window. The associated signals are displayed in the twographs Fig. 3, and Fig. 4, where the estimated signal y ( k ) is superimposed on the original data and their sp respective FFT are superimposed on the second graph. Comparisons between sampled and estimated signals show MSE in the range of 2.884 MW for the ringdown analysis of Fig. 3, and MSE of 0.0737 MW for the ambient data analysis of Fig. 4. This, adding to a close to exact fit of their FFT comparison proves the accuracy of the estimated dynamic parameters. In Table 2, it is observed that the estimated mode from the proposed ERA/Prony method is closer to the WECC value (0.318 Hz) than the ones obtained from ESPRIT-based techniques in the ringdown case.
Figure 4. Signals and FFT of ambient data analysis.
For the ambient data analysis, a first use of the ERA/Prony analysis produced similar values to the ESPRIT ones, but following empirical use of the model order and graphical validation, the MSE was reduced, and the identification finally concluded on a precise value of 0.2852 Hz for the major-mode estimation, which demonstrates the fine tuning aspect of the software tool.
1375
[12] N. Zhou, J. W. Pierre, and D. J. Trudnowski, “A Bootstrap Method for Statistical Power System Mode Estimation and Probing Signal Selection,” IEEE Power Engineering Society General Meeting, PES’06, 7 pp. Oct 2006.
6. CONCLUSION AND FUTURE WORK This paper presents an interesting portable software tool for time-domain modal analysis. The ERA/Prony algorithm, on witch the software is based, proved to be accurate and reliable in all study cases including ringdown, and ambient data analysis. In a global control perspective, developments are underway to extend the use of the software to multi-input-multi-output (MIMO) minimal realization, enhancing the observability and controllability aspects. Further researches will also be conducted toward dynamic vulnerability assessment.
[13] R. W. Wies, J. W. Pierre, and D. J. Trudnowski, “Use of ARMA Block Processing for Estimating Stationary LowFrequency Electromechanical Modes of Power Systems,” IEEE Transactions on Power Systems, vol. 18, no. 1, pp. 167-173. Feb 2003. [14] D. J. Trudnowski, “Estimating Electromechanical Mode Shape From Synchrophasor Measurements,” IEEE Transactions on Power Systems, vol. 23, no. 3, pp. 1188-1195. Aug 2008.
REFERENCES
[15] N. Zhou, Z. Huang, L. Dosiek, D. J. Trudnowski and J. W. Pierre, “Electromechanical Mode Shape Estimation Based on Transfer Function Identification Using PMU Measurements,” IEEE Power Engineering Society General Meeting, PES’09,7 pp. Oct 2009.
[1] P. Kundur, Power System Stability and Control. New York: McGraw-Hill, 1994. [2] P. Kundur, G. K. Morison, and N.J. Balu, “A comprehensive approach to power system analysis,” CIGRÉ, Paris, pp. 38-106, 1994.
[16] N. Zhou, D. J. Trudnowski, J. W. Pierre, and W. A. Mittelstad, “Electromechanical Mode Online Estimation Using Robust RLS Methods,” IEEE Transactions on Power Systems, vol. 23, no. 4, pp. 1670-1680. Nov 2008.
[3] J. F. Hauer, C. J. Demeure, and L. L. Scharf, “Initial Results in Prony Analysis of Power System Response Signals,” IEEE Transactions on Power Systems, vol. 5, no. 1, pp. 80-89. Feb 1990.
[17] P. Tripathy, S. C. Srivastava, and S. N. Singh, “A Modified TLS-ESPRIT based Method for Low Frequency Mode Identification in Power Systems utilizing Synchrophasor Measurements,” IEEE Transactions on Power Systems, vol. 26, no. 2, pp. 719-727. May 2011.
[4] I. Kamwa, R. Grondin, J. Dickson , and S. Fortin, “Minimal Realization Approach to Reduce-Order Modelling and Modal Analysis for Power System Response Signal,” IEEE Transactions on Power Systems, vol. 8, no. 3, pp. 1020-1029. Aug 1993.
[18] T. J. Browne, V. Vittal, G. T. Heydt, and A. R. Messina, “A Comparative Assessment of Two Techniques for Modal Identification From Power Systems Measurements,” IEEE Transactions on Power Systems, vol. 23, no. 3, pp. 1188-1195. Aug 2008.
[5] J.-N. Juang, Applied System Identification. New Jersey: PTR Prentice-Hall, 1994.
[19] I. Kamwa, A. K. Pradhan, and G. Joos, “Robust Detection and Analysis of Power System Oscillations Using the TeagerKaiser Energy Operator,” IEEE Transactions on Power Systems, accepted for publication.
[6] I. Kamwa, and L. Gerin-Lajoie, “State-Space System Identification-Toward MIMO Models for Modal Analysis and Optimization of Bulk Power System,” IEEE Transactions on Power Systems, vol. 15, no. 1, pp. 326-335. Feb 2000. [7] I. Kamwa, Modal Analysis Course on Power Systems. Research and Development Work Group, Varennes(Qc): IREQ93-292, 1993.
[20] B. L. Ho, and R. E. Kalman, “Effective Construction of Linear State-Variable Models from Input/Output Data,” Proceedings of the 3rd Annual Allerton Conference on Circuit and System Theory. 1965, pp. 449-459.
[8] I. Kamwa, D. Ndereyimana, D. Asber, and R. Grondin, Modal Analysis : Command Systems Applications and Concepts Validation. Research and Development Work Group, Varennes(Qc): IREQ-97-227, 1997.
[21] B. D. Rao, and K. S. Arun, “Model Based Processing of Signals: A State Space Approach,” Proceedings of the IEEE. Aug 1992, vol. 80, no 2, pp. 283-309. [22] S. H. Cheng, N. J. Higham, C. S. Kenney, and A. J. Laub, “Approximating the Logarithm of a Matrix to Specified Accuracy,” SIAM J. Matrix Anal. Appl., vol. 22, no. 4, 2001, pp. 1112-1125.
[9] I. Kamwa, G. Trudel, and L. Gerin-Lajoie, “Low-Order Black-Box Models for Control System Design in Large Power Systems,” IEEE Transactions on Power Systems, vol. 11, no. 1, pp. 303-311. Feb 1996.
[23] I. Kamwa, R. Grondin, J. Béland, C. Lafond, G. Trudel, and D. McNabb, “Wide-Area Monitoring and Control at HydroQuébec: Past, Present and Future,” IEEE Power Engineering Society General Meeting, PES’06, 12 pp. Oct 2006.
[10] N. Zhou, J. W. Pierre, and J. F. Hauer, “Initial Results in Power System Identification From Injected Probing Signals Using a Subspace Method,” IEEE Transactions on Power Systems, vol. 21, no. 3, pp. 1296-1302. Aug 2006.
[24] PDCI Probe Testing Plan 2005 website. [online]. Available:http://www.transmission.bpa.gov/business/operations /SystemNews/.
[11] D. J. Trudnowski, J. W. Pierre, N. Zhou, J. F. Hauer, and M. Parashar, “Performance of Three Mode-Meter BlockProcessing Algorithms for Automated Dynamic Stability Assessment,” IEEE Transactions on Power Systems, vol. 23, no. 2, pp. 680-690. May 2008.
[25] Report and data of WECC. [online]. ftp://ftp.bpa.gov/pub/WAMS_Information/.
1376
Available: